


 English (pdf)
 Article in xml format
 Article references
 Send this article by e-mail
 Cited by SciELO
  Cited by Google
  Similars in
SciELO
Similars in
SciELO  Similars in Google
 Permalink
Introduction
In recent years, the growth of Bubaline livestock in Brazil has been proportionally higher than cattle (Malhado et al., 2007). There are now approximately 1,319.5 million head of buffalo in Brazil, with 3.37% increase rate in 2015 (IBGE, 2015). The increase in buffalo numbers in this country has mainly been driven by the unique chemical characteristics of milk and meat, greater resistance to infection by endo and ectoparasites (Bastianetto, 2009), and to a broad ecological tolerance allowing greater occupancy of available areas (Garcia et al., 2016). Buffaloes also have higher fertility, increased longevity and lower mortality rates as compared to cattle (Bernardes, 2007).
The increase in buffalo numbers in Brazil provided the basis for several studies, mainly in dairy buffaloes (Sesana et al., 2014; Malhado et al., 2017; Rezende et al., 2017). Nevertheless, there is still a lack of knowledge of genetic parameter estimates in buffaloes used for meat production. Although such GxE effects are well known in cattle (Mattar et al., 2011; Ambrosini et al., 2012; Rezende et al., 2019), pigs (Knap and Su, 2008) and quail (Oroian, 2010), to the best of our knowledge no published studies on genotype by environment interactions (GxE) in buffaloes are available - and this critical information is of paramount importance in a large country such as Brazil, where buffalo herds may be farmed in a wide variety of bioclimatically and ecologically distinct environments. If GxE are not considered, genetic values can be biased thereby reducing the response to selection (Streit et al., 2012).
Various reaction norm (RN) models have been used to describe phenotypic change over environmental gradients. Such models can detect gradual changes in the reaction norm by examining the performance of genotypes along the environmental gradient (De Jong, 1995). The advantage of these models is that the selection response can be predicted, not only in phenotypic expression in the environment, but also in the environmental sensitivity of the changes in the environment (De Jong and Bijma, 2002). Therefore, the objective of this study was to quantify genotype by environment interaction in the Mediterranean water buffalo in Brazil using reaction norm models. The phenotypic trait used for the analysis was body weight adjusted to 205 days of age (W205).
Materials and Methods
Data
Data for Mediterranean water buffaloes born between 1990 and 2014 were collected from five farms ascribed to the Brazilian Buffaloe Improvement Program (PROMEBUL), and located in the North (1), Northeast (1), South (2) and Southeast (1) regions of Brazil. The initial database consisted of 5,280 observations at 205 days of age (W205). However, not all the data were usable and the following records were excluded from our analysis: 605 animals with weight records lower than 70 and higher than 360 kg, 90 animals pertaining to contemporary groups (CG) with 3 or less animals with weights above 3 standard deviations from the CG mean. Additionally, 778 records were removed because they had less than two offspring. Finally, 194 records were not used because they were unrelated to the study dataset. The remaining 3,613 records, with an average of 195.3 ± 32.7 kg to W205, were used in the analyses.
We used the routines created by Cardoso (Cardoso, 2010) in SAS (SAS, 2019) to collate, format, and describe the data statistically. CGs were created to group individuals into common production environments based on year, season, herd and sex. Birth periods were grouped into four classes (period 1: September, October and November; period 2: December, January and February; period 3: March, April and May; and period 4: June, July and August).
The connections between CGs, based on the genetic links (minimum of 10) was assessed with the AMC software (Roso and Schenkel, 2006). In preparing the pedigree file, only connected CGs were included, resulting in three ‘archipelagos’: the first, with 113 CG and 3,613 animals; the second, with 31 CG and 127 animals; and the third, with 12 CG and 55 animals. For the rest of the analysis, we only used data from the main archipelago.
Data analysis
The initial analysis was performed with the standard animal model (AM) to obtain estimates of the environmental gradient based on CGs. INTERGEN software (Cardoso, 2010) adjusts Bayesian hierarchical models. This software uses parameters set at structured levels to assess the diversity of common situations in animal performance data. In the case of the reaction norm models, the genetic value of the animal is obtained by a function of an environmental average related to the CG record. Thus, for each environmental level a specific genetic value is allocated to each animal (Cardoso and Tempelman, 2012).
The standard animal model (AM), ignoring GxE interactions, was used to estimate genetic values and environmental effects: AM: yij = ß + Xj + ai + mi + epi + eij [1]. Where, yij is a record of an individual buffalo i in environment j; ß a vector of fixed effects (linear and quadratic coefficients for age of buffalo); xi , being its corresponding incidence vector; Xj is the distributed random effect of the environment j (CG effects); ai is the additive genetic value of animal i; mi is the maternal genetic value of the animal i; epi is the maternal permanent environmental effect as a covariate in the reaction norm model; and, eij is the residual error. The covariance between direct and maternal genetic effects was set to zero.
Two approaches were used to estimate hierarchical reaction norm models: 1) hierarchical RN models based on a 2-step procedure - HRNM2s, and; 2) hierarchical RN models based on 1-step procedure - HRNM1s. The first model, proposed by Kolmodin (2002), uses the AM solutions as covariates: HRNM2s: yij = ß + ФXj + ai + mi + epi + b1i + b2i + eij[2]. Here Ф is the fixed regression coefficient; ai corresponds to the additive genetic effect or intercept of animal i; mi is the maternal genetic value or intercept of animal i; epi , is the maternal permanent environmental effect; b1i is the random regression coefficient or RN slope of animal i; b2i corresponds to the maternal random regression coefficient or RN maternal slope; i is the environment represented by ; whereas is the predictor of Xj obtained in the Eq. [1]; and, eij is the residual error.
The second approach, developed by Su et al. (2006), uses estimates of environmental effects as covariate to obtain RN of the animals - meaning that Xj and bi are jointly estimated following: HRNM1s: Yij = ß + Xj + ai + mi + epi + b1i Xj + b2i Xj + eij[3].
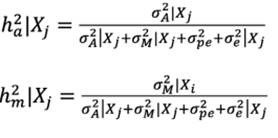
The direct additive and maternal genetic variances for a given environment X, σA 2 |Xj and σM 2 |Xj were obtained as follows: σA 2 |Xj = var (ai + b1i Xj ) = σa 2 + σb 2 Xj 2 + 2σa,b Xj and σM 2 |Xj = var (ai + b2iXj ) = σm 2 + σb 2xXj 2 + 2σa,bXj .
The heritability was estimated by the ratio of genetic variance to phenotypic variance (genetic + environmental) as:
The estimates of variance components were obtained through a Bayesian approach using a Markov Chain Monte Carlo (MCMC) method. This was achieved using the following procedure: a) running a pilot analysis with 25,000 cycles, 2,500 of burn-in and 5 of thinning; b) using the variance-component samples - Varcompsam and the R program (R DEVELOPMENT CORE TEAM, 2008) - Bayesian Output Analysis - BOA (Smith, 2007). The Raftery and Lewis (1993) test was applied to ascertain chain size and thinning, and; c) the burn-in was assessed by Heidelberg and Welch (1983) criterion. The analyses ultimately used chains varying from 440,000 to 1,350,000 cycles.
The chain convergence analysis for the models was assessed by Geweke`s Z criterion (Geweke, 1992) and applied to the conditional distribution of data, denoted by = log p for the initial samples (first 10%) and the last part of Markov chain (last 50%). This is similar to the approach proposed by Brooks and Robert (1998) using the following statistic:
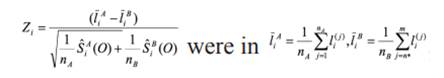
In which nA = 270.000, nB =1.350.000, n*= 1.350.001 with
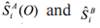 (O), being the respective statistics for spectral density in zero frequency obtained through SPECTRA approach of SAS, for the first nA and last nB cycles of MCMC of length m. The absolute values of Zi score (two-tailed) indicated rejection for the convergence test. The fit of the models (AM, HRNM2s and HRNM1s) was verified using three criteria: Deviance Information Criterion (DIC) (Spiegelhater et al., 2002); Deviance based on Conditional Predictive Ordinate (DCPO) (Gelfand, 1996); and Deviance based on Bayes Factors (DBF).
Results
The Geweke test (Z) indicates that the AM and HRNM2s models converged at 5% (p>0.05) for all parameters, while the HRNM1s model converged at 1% (p>0.01) (Table 1).
Table 1 Geweke’s Test (Z) of convergence for variance components by different models.
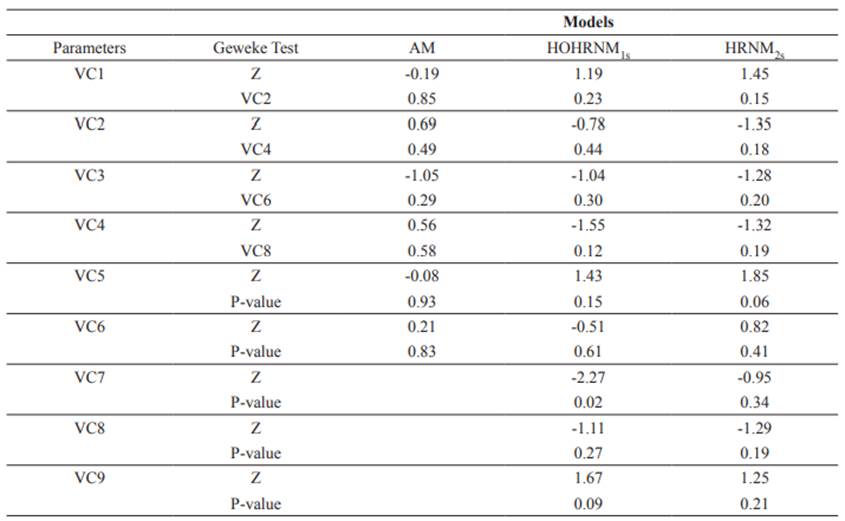
VC1 - Variance of Contemporary Group (HRNM); VC1 - Variance of direct genetic effect (AM); VC2 - Variance of reaction norm intercept (Direct Effect) (HRNM); VC2 - Variance of maternal genetic effect (AM); VC3 - Variance of reaction norm slope (Direct Effect) (HRNM); VC3 - Correlation between the variance of direct and maternal genetic effect (AM); VC4 - Correlation between the reaction norm intercept and slope (Direct Effect) (HRNM); VC4 - Variance of maternal permanent environmental effect (AM); VC5 - Variance of reaction norm intercept (Maternal Effect) (HRNM); VC5 - Variance of Contemporary Group (AM); VC6 - Variance of reaction norm slope (Maternal Effect) (HRNM); VC6 - Variance of residual error (AM); VC7 - Correlation between the reaction norm intercept and slope (Maternal Effect) (HRNM); VC8 - Variance of maternal permanent environmental effect (HRNM); VC9 - Variance of residual error (HRNM).
Based on the two criteria for model comparison (DIC and DBF), the HRNM1s model had a better fit (Table 2).
Table 2 Deviance based on Bayes Factors (DBF), Deviance Information Criterion (DIC) and Deviance based on Conditional Predictive Ordinate (DCPO).
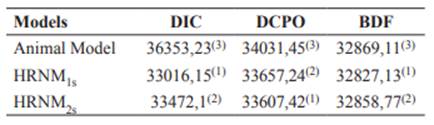
1, 2 and 3: display the best model fit.
The environmental gradient model results ranged from -33 to 47 kg, characterizing environmental levels from low to high management (Figure 1). The direct heritability estimates of HRNM1s ranged from 0.17 to 0.67 and the maternal heritability from 0.02 to 0.11 (Figure 1).
The posterior mean (for HRNM1s following data adjustment) of the correlation between the slope and the intercept in the reaction norm was high for maternal (0.82 ± 0.06) and direct effects (0.87 ± 0.15). Animals with higher direct and maternal genetic values (for weight at 205 days) responded to the environmental gradient (Figure 2 and 3 ).
The slopes of the reaction norms ranged from -1.47 to 1.32 degrees for direct effects, in which 47.06% (2,046) of the animals can be classified as robust and intermediate genotypes (inclinations between -0.20 and 0.20 degrees). Plastic genotypes (-1.47 to -0.20 and 1.32 to 0.20) were observed in 52.94% (2301) of the animals.
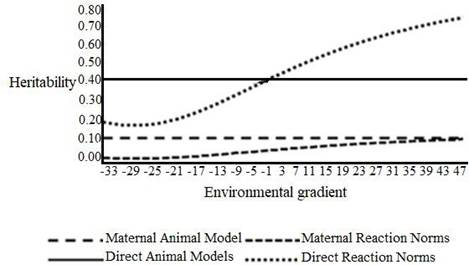
Figure 1 Heritability of W205 for direct and maternal effects in different models across environmental gradient.
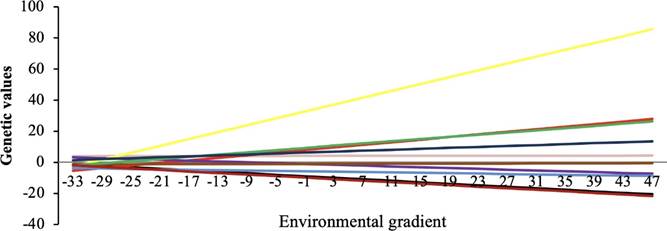
Figure 2 Reaction norm by environmental gradient for W205 for direct effect for the 10 sires with the highest number of offspring.
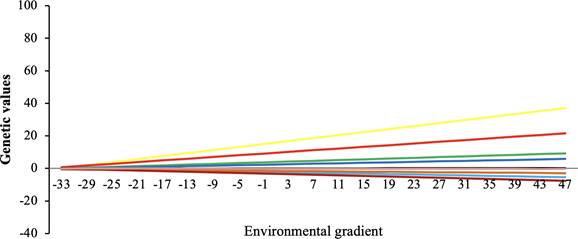
Figure 3 Reaction norm by environmental gradient for W205 for maternal effect for the 10 sires with the highest number of offspring.
The Spearman correlations among the ratings of 50% sires with higher genetic values ranged from -0.40 to 0.97 in different environments and models. When all sires were considered, the values ranged from 0.27 to 0.99 (Table 3). The lowest values were found in the comparison of Low-HRNM1s and High-HRNM1s, confirming the presence of genotype by environment interactions.
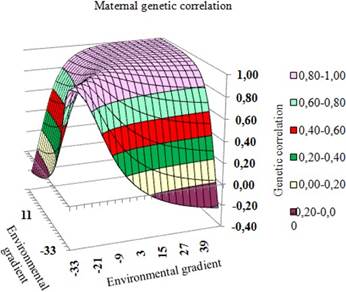
The estimated correlations among genetic values obtained via the HRNM1s model in different environments were from -0.09 to 1.00 for the direct effect (Figure 4) and from -0.22 to 1.00 for the maternal effect (Figure 5).
Table 3 Spearman rank correlations among the classifications of 50% of the sires with higher genetic values under the diagonal and with 100% of sires above the diagonal obtained by the animal model (AM) and by hierarchical reaction norm model (HRNM1s) at different environmental levels.
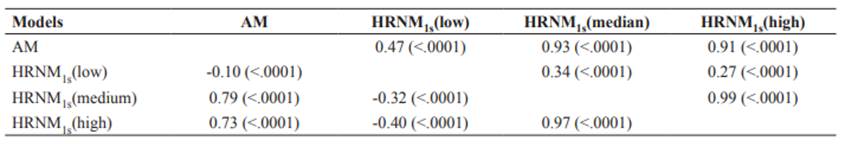
Figure 4 Response surface for correlations between direct genetic values in the environmental gradient.
Discussion
This result for model comparison (Table 2) is in accordance with several previous studies assessing standardized post-weaning gain for Devon (Côrrea, 2009), Hereford (Cardoso et al., 2011) and Canchim (Mattar et al., 2011) cattle breeds. The heritability estimates (direct and maternal) for the animal model (AM) were 0.38 and 0.12, respectively. Malhado et al. (2008), using the Restricted Maximum Likelihood (REML) method, found higher values (0.42 ± 0.06) for direct heritability and lower values (0.05 ± 0.03) for maternal heritability for W250 in this breed.
The genetic variances (direct and maternal) and heritability increased with increasing increments of the environmental gradient. Such strong environmental associations provide compelling evidence that the values of genetic parameters are dependent on the environment in which animals are bred. Such effects can accentuate the differences between more responsive animals as demonstrated in several studies on cattle (Cardoso and Tempelman, 2012; Kolmodini, 2002; SU et al., 2006). Using the HRNM model, Corrêa et al., 2009 and Cardoso et al., 2011 recorded direct heritability values close to the range studies observed in the current one for post-weaning gain of Devon cattle (0.29 to 0.70) and Hereford cattle (0.07 to 0.64).
According to the environmental gradient response, specifically, the more favorable the environment, the greater the difference in genetic values since under favorable environmental conditions the animals are better able to express their genetic potential. This result agrees with other standardized studies for growth and production in cattle (Correa, 2009; Kolmodin, 2002; Fikse et al., 2003). The GxE effect was evident observing the change in sires' genetic values (both direct and maternal) along the environmental gradient (Figures 2 and 3). The slopes of the reaction norms demonstrate the importance of considering the GxE in genetic evaluations. This information can be used to get better performance in different environments by selecting highly productive robust genotypes, or plastic genotypes that respond positively to environmental improvement.
The results of Spearman correlations make it possible that the best sires in the low-level environments are not necessarily best in the middle- and high-level environments in reason of the low correlations (-0.40 and 0.27). The highest correlations (0.97 and 0.99) were studies on cattle (Cardoso and Tempelman, 2012; Kolmodini, 2002; SU et al., 2006). Using the between Medium-HRNM1s and High-HRNM1s, indicating an absence of GxE when considering only these two environments.
Thus, sires selected on progeny information bred in medium-level environments can be used in high-level environments. Comparing AM with HRNM1s, the highest correlations were with Medium-HRNM1s, demonstrating that the animal model corrects for a medium production environment. However, genetic assessments not considering GxE can lead to inaccurate use of sires, especially in low-level environments. Before 2004 genetic evaluations for Mediterranean buffaloes did not exist in Brazil.
With the release of information based on the BLUP (best linear predictors not addicted) methodology in 2004, genetic values of Brazilian buffalo have been predicted and sire selection has started to be based on this criterion. However, as the usual genetic evaluation does not consider GxE, the gains may be lower than expected, especially in production environments with lower-level management.
Ambrosini et al. (2014) in cattle have not reported a significant change in classification when comparing the low, medium and high levels of HRNM1s. The fact that our study employed animals from four regions of Brazil may have contributed to this divergence. However, Corrêa et al. (2009) found a high change in the sires’ classification from Devon cattle, when considering the RNM.
The genetic correlation in the medium and high levels of the environmental gradient is high and positive (Figure 4 and 5), falling rapidly as the environment becomes unfavorable, with negative values between the environmental gradient extremes. Thus, selection in medium and high environments is equivalent. In practical terms, some animals are adapted and productive in adverse environments, while other animals have superior performance in the most favorable environments. These results are in agreement with those recorded for post-weaning gain in Devon cattle (Côrrea et al., 2009), for protein yield in dairy cattle, and for yearling weight in Canchim cattle (Mattar et al., 2011).
In general, GxE were identified by the best fit model (HRNM1s). This was supported by the heritability change, by the correlation values between the slope and the intercept of the reaction norm, and by the change in classification. In addition, there was a change in genetic values with a greater effect for direct values.
The data suggests that buffaloes are plastic and robust animals, providing considerable scope for selection for productivity traits in each specific environment. Genetically superior (more productive) animals in medium- and high-level environments are different from those in low- level environments. Thus, genetic evaluation programs in buffalo are required to identify superior animals in certain environments.

