


 Inglés (pdf)
 Articulo en XML
 Referencias del artículo
 Enviar articulo por email
 Citado por SciELO
  Citado por Google
  Similares en
SciELO
Similares en
SciELO  Similares en Google
 Permalink
Introduction
The Colombian poultry agribusiness depends almost entirely on imported corn for the production of complete feeds. Corn is, quantitatively, the major ingredient in poultry diets, with inclusion levels up to 50-60%. Therefore, corn quality has a significant impact on the health and performance of poultry. According to the United States Department of Agriculture (USDA), the expected global production of corn for 2019-2020 is estimated at 1.019 million tonnes (Micolucci, 2019). The United States is the largest world producer with slightly more than 347 million tonnes estimated for 2019-2020 (Micolucci, 2019). The annual corn production in Colombia is very low (about 1.5 million tons), and far from the demand of approximately 7 million tonnes (Fenalce, 2019). This high demand compared with the low local production results in the need for animal feed producers to import corn, mostly from the United States. Transport of corn to local feed mills involves long journey distances and long storage times that create a risk for grain quality deterioration and contamination. It has been reported that each time a lot of corn is handled during transport, both the percentages of broken grains and dust formation increase (Győri, 2017; Hernández et al., 2009). Further, a common issue that may impair grain quality and safety is fungal contamination of corn, both during field growth and after harvest. Fungal growth may result in the production of potentially toxic compounds (mycotoxins), which, depending on their concentration, might cause adverse effects on poultry (Diaz, 2020). Another unfavourable effect of fungal contamination is nutritional deterioration of the grain caused by fungal growth, which leads to decreased fat, carbohydrate, vitamin and protein content of the kernel. The adverse effects of fungi on nutrient composition is particularly severe on crude fat and energy contents, which results in poor bird performance (Diaz, 2020). This effect is attributed to fungal lipases, which hydrolyze triglycerides to free fatty acids, which are, in turn, used as energy source by the microorganism (Diaz, 2020; Christensen and Kaufman, 1965).
Additionally, importation of large quantities of corn puts domestic producers at risk. Policies should be established to help local corn growers become more productive and competitive. A government stimulus of corn production in Colombia could represent several advantages, including reduced transport and storage times, which in turn could reduce grain deterioration and contamination.
No studies have been conducted comparing Colombian-produced corn vs. corn imported from the USA. Therefore, the objective of the present study was to assess and compare corn quality, mycotoxin content, chemical composition and apparent metabolizable energy (AME) of domestic and imported corn.
Materials and Methods
Ethical considerations
The broiler chicken experiment was approved by the Ethics Committee of Facultad de Medicina veterinaria y de Zootecnia of Universidad Nacional de Colombia, Bogota (Colombia), under approval No. CB-FMVZ- UN-010-19.
Location of the study
Chemical analyses were carried out at the Toxicology and Animal Nutrition laboratories of the Facultad de Medicina veterinaria y de Zootecnia of Universidad Nacional de Colombia, Bogota, Colombia. The broiler chicken trial was carried out at the poultry research facilities of the same university.
Samples
Sampling was carried out by the “Federación Nacional de Cultivadores de Cereales y Leguminosas” (FENALCE). Samples of imported corn were collected at two of the major Colombian sea ports (Buenaventura and Santa Marta) over a one-year period. Precise collection instructions for each sample included a minimum of ten sampling points, with each subsample of 500 g, for a total of minimum 5 kg. Colombian corn samples were collected in the same way in Valle del Cauca and Tolima Provinces. Samples were packed in paper bags to prevent moisture condensation and sent to the laboratory immediately after collection. The corn hybrids grown in Colombia and analyzed in the present study were LEPTRA P30F35, ADVANTA 9293, PIONER 7088, SV 1035, and DOW 810. It was not possible to trace the variety of corn imported from the United States.
Corn kernel quality
The percentages of broken kernels and impurities were determined in 30 samples of locally-grown corn and 21 of imported corn. For this purpose, a 1 kg sample was sieved through 4,76 mm (mesh 4) and 2,38 mm (mesh 8) sieves, as previously described (Hernández et al., 2009; CIMMYT, 2016). The quality classification was based on the guidelines described in the “Official United States Standards for Grain” of the USDA-GIPSA (1996). Under this classification, percentages of impurities plus broken grains corresponding to <2, <3, <4, <5, and 7% are assigned to grades US1, US2, US3, US4, US5, respectively. Grains that do not meet any of these criteria are classified as SG (“sample grade”).
Proximal analysis
In order to compare the basic composition of local and imported corn, 15 samples of each type of corn were randomly selected and subjected to proximal analysis [dry matter (Method 2001.12), ash content (Method 935.12), crude protein (Method 968.06), crude fat (Method 920.39), and crude fiber (Method 962.09)] according to the methods described by the AOAC (Association of Official Analytical Chemists International, 2006). The nitrogen- free extract content was calculated from data obtained in the proximal analysis.
Mycotoxin analysis
The following mycotoxins were determined using high-performance liquid chromatography (HPLC) in the 30 samples of local and 23 of imported corn, using the Colombian Technical Standards (NTC, Norma Técnica Colombiana): aflatoxins B1, B2, G1, and G2 (NTC 1232, 1996); ochratoxin A (NTC 5472, 2007), zearalenone (NTC 4881, 2000), T-2, and HT-2 toxins (NTC 6027, 2013), and deoxynivalenol (NTC 5961, 2012). These analyses were conducted on a Shimadzu Prominence system (Shimadzu Scientific Instruments, Columbia, MD, USA) equipped with a DGU-20A3R degassing unit, two LC-20AD pumps, a SIL-20ACHT autosampler, a CTO-20A column oven, an RF- 20AXS fluorescence detector, an SPD-20AV visible-ultraviolet spectrophotometric detector and a CBM-20A bus module, all controlled by “LC Solutions” software. Fumonisins B1, B2, and B3 were analyzed by HPLC-tandem mass spectrometry (LC-MS/MS) according to the method described by Martos et al. (2010).
Determination of the fatty acid profile
Ten random samples each of local and imported corn were analyzed for fatty acid composition. Corn kernel oil was extracted by shaking finely ground kernel samples with diethyl ether for 12 hours. The percentage of fatty acids was determined by gas chromatography according to the method described by Aguillón-Páez et al. (2020). About 20 µL of the ether extract (containing about 2 mg corn oil) were added to 160 μL toluene and 20 μL Meth-Prep II transesterification reagent (Alltech Associates, Inc., Deerfield, IL, USA). The mix was left at room temperature for 30 min and then 1 μL of the solution was injected into the gas chromatograph for determination of fatty acid methyl esters (FAME). The FAME were separated on a 30 m × 0.32 mm inside diameter × 0.25 μm film thickness SGE BPX70 capillary column (SGE Analytical Science, Australia) using a Shimadzu GC-2014 Gas Chromatograph (Shimadzu Scientific Instruments, Columbia, MD, USA) equipped with a flame ionization detector. Separation was obtained with a temperature ramp (initial temperature 80 °C for 2 min, 30 °C/min until 140 °C, then 10 min at 140 °C, 2.9 °C/min to 200 °C, and finally 9 min at 200 °C) using helium as the carrier gas and nitrogen as the make-up gas. The injection was made in split mode with a split ratio of 1:30. Retention times were compared with those of known standards (37 component FAME mix, Merck KGaA, Darmstadt, Germany).
Apparent metabolizable energy
The apparent metabolizable energy (AME) of one random sample of locally-grown corn and one random sample of imported corn was determined in a trial conducted with 180 one- day-old male chicks from the Ross 308 AP strain. The chicks were randomly distributed in three experimental groups. Each group was replicated 6 times, with 10 birds per replicate pen. The experimental treatments corresponded to three different diets provided ad libitum from days 1 to 21 of age, as follows. Diet 1: reference diet (starch-based); diet 2: 60% reference diet + 40% locally-grown corn; and diet 3: 60% reference diet + 40% imported corn. The reference diet reached or exceeded the nutritional requirements of broiler chickens (NRC,1994) (Table 1).
Table 1 Composition of the reference diet.
| Ingredientes % | Reference diet (starch-based) |
|---|---|
| Starch | 45.6 |
| Soybean meal | 32.1 |
| Full-fat soybean | 10.0 |
| Fish meal | 8.0 |
| Vegetable oil | 1.26 |
| Sodium chloride | 0.30 |
| Calcium carbonate | 0.45 |
| Calcium phosphate | 0.80 |
| Bicarbonate | 0.30 |
| Vitamin mix* | 0.05 |
| Mineral mix* | 0.05 |
| Choline | 0.10 |
| Methionine | 0.32 |
| Threonine | 0.03 |
| Chromium oxide | 0.50 |
| Calculated analyses (%) | |
| Metabolizable energy (kcal/kg) | 3,224 |
| Crude protein | 25 |
| Crude fat | 5.21 |
| Crude fiber | 2.65 |
| Linoleic acid | 1.29 |
| α-linolenic acid | 0.20 |
| Calcium | 0.80 |
| Total phosphorus | 0.64 |
| Available phosphorus | 0.37 |
| Digestible lysine | 1.79 |
| Digestible methionine | 0.59 |
| Digestible threonine | 1.07 |
| Digestible tryptophan | 0.33 |
| Digestible methionine + cysteine | 0.89 |
*Vitamin-mineral mix. Contet per kg: zinc 20,000 mg; iron: 8,400 mg; manganese: 35,000 mg; copper: 1,700 mg; iodo: 430 mg; selenium: 60 mg; vitamin A: 344,000 UI; vitamin D3: 680,000 UI; vitamin E: 4,000 UI; choline: 172,000 mg; niacin: 9,000 mg; calcium pantotheate: 3,060 mg; vitamin B2: 1,430 mg; vitamin B2: 1,430 mg; vitamin K3: 856 mg; vitamin B12: 4.6 mg.
The AME values were determined according to the methods described by Sakomura and Rostagno (2016) using chromium oxide (III) as a marker (Cr2O3). Feed and excreta were collected on days 19, 20 and 21 for gross energy (GE) and chromium content determination. Excreta were collected in the morning and the afternoon, cleaned of feathers and any other extraneous material, placed in aluminum trays and dried in a forced ventilation oven at 55 °C for 72 h (Sakomura and Rostagno, 2016). The GE was measured with an adiabatic calorimeter (Parr 6200, Parr Instrument Company, Moline, Illinois, USA) calibrated with benzoic acid with a known caloric value (26.4 MJ/kg). Chromium content was determined by atomic absorption spectrophometry as described by Williams et al. (1962).
The AME was calculated using the following equations:
- Indigestibility factor (IF) =
- AME of experimental diets = (GE of diet) -(GE of excreta * IF)
- AME test corn =
Statistical analysis
Depending on the variables measured, mean values were compared using a t-test for independent samples or analysis of variance. Homogeneity of variances was determined by the Levene test. Statistical analyses were carried out using the STATISTIX version 9 program (Statistix, 2008), with a significance level of 0.05.
Results
Corn kernel quality
Twenty percent (6/30) of the locally-grown corn samples were classified as US1, while none of the imported corn samples (0/21) fell into this category (Figure 1). Further, 13% (4/30) of the locally-produced corn samples were classified as US2 grain compared to 5% (1/21) of the imported grain. Atotal of 10 out of the 21 samples of imported corn (48%) fell into grades US3 to US5, whereas the remaining 10 samples (48%) were classified as SG. In the case of the locally- produced corn, 14 out of 30 samples (47%) corresponded to US3-US5 grades, with only 6 out of 30 (20%) falling into the SG category (Figure 1). Interestingly, soybean kernels were found in 15 of the 21 samples of imported corn, but in none of the domestic corn samples.
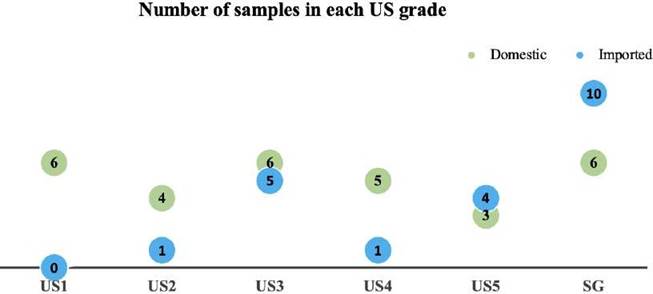
Figure 1 Locally-grown and imported corn samples classified into US grades according to their content of broken kernels and impurities.
Proximal analysis results of 15 samples of each corn source are summarized in Table 2. Significant differences were found for dry matter, ash, and nitrogen-free extract of local and imported corn.
Table 3 summarizes the apparent metabolizable energy (AME) results calculated for one sample of locally-grown corn and one of imported corn. The AME values (on a dry-matter basis) for the local and imported corn were significantly different.
Table 4 shows the average percent fatty acid composition of the 10 samples analyzed for each type of corn. With the exception of palmitoleic acid (C16:1), the percentage of all fatty acids differed significantly (p<0.05). The content of monounsaturated fatty acids (MUFAS), polyunsaturated (PUFAS), saturated (SFAS), n-3, n-6 and the ratio n-6/n-3 also differed significantly (p<0.05). The fatty acid found in highest concentration in both domestic and imported corn was linoleic acid (C18:2, n-6), followed by oleic, palmitic and stearic acids. The other fatty acids were found in percentages close to 1% or lower, including the only omega-3 fatty acid present in corn oil (C18:3, n-3).
Table 2 Proximal analysis (%) of domestic and imported corn samples (on a dry-matter basis).
| Dry matter | Crude protein | Ash | Crude fat | Crude fiber | NFE | |
|---|---|---|---|---|---|---|
| Domestic | 88.0 ± 0.2a | 7.6 ± 0.3a | 1.2 ± 0.1a | 3.8 ± 0.3a | 2.0 ± 0.1a | 85.4 ± 0.4b |
| Imported | 86.7 ± 0.2b | 7.5 ± 0.2a | 1.0 ± 0.0b | 3.1 ± 0.3a | 1.7 ± 0.1a | 86.7 ± 0.3a |
| p-value | <0.001 | 0.822 | 0.011 | 0.101 | 0.146 | 0.010 |
Values are means ± SEM of 15 samples. Different superscripts letters (a, b) within columns indicate significant difference (p<0.05).
NFE: nitrogen-free extract.
Table 3 Apparent metabolizable energy (AME) for broiler chickens of a locally-grown corn sample and an imported corn sample, measured using chromium oxide (Cr2O3) as a marker.
| Results as dry matter (DM) | Experimental diets | |||
|---|---|---|---|---|
| Starch-based | Locally-grown corn | Imported corn | p-value | |
| DIETS | ||||
| Dry matter (g/kg diet) | 902.7 | 896.9 | 896.2 | - |
| Gross energy (kcal/kg) | 4,440 | 4,380 | 4,350 | - |
| Chromium content (g/kg) | 4.8 | 4.6 | 5.3 | - |
| EXCRETA | ||||
| Dry matter (g/kg excreta) | 927.8 ± 0.29 | 932.9 ± 0.13 | 926.3 ± 0.08 | 0.007 |
| Gross energy (kcal/kg) | 3,547 ± 34.8b | 3,808 ± 29.2a | 3,825 ± 19.8a | <0.001 |
| Chromium content (g/kg) | 14.8 ± 0.43b | 18.9 ± 0.63a | 19.7 ± 0.29a | <0.001 |
| Indigestibility factor | 0.327 ± 0.01b | 0.245 ± 0.01a | 0.269 ± 0.01a | <0.001 |
| Diet AME (kcal/kg) | 3,282 ± 33.3b | 3,448 ± 28.0a | 3,321 ± 13.1b | 0.001 |
| Corn AME (kcal/kg DM) | 3,697 ± 70.1a | 3,378 ± 32.8b | 0.002 |
Values are means ± SEM of 6 replicate pens per treatment. Different superscripts letters (a, b) within rows indicate significant difference (p<0.05).
The mycotoxin analyses conducted on 30 samples of domestic corn and 23 of imported corn are summarized in Table 5. No detectable levels of aflatoxins B2, G1 or G2, ochratoxin A or T-2 and HT-2 toxins were found in any of the samples. Aflatoxin B1 was found in only 2 of the 23 imported corn samples, and in one of the 30 domestic samples.
Table 4 Percent fatty acid composition of domestic and imported corn samples.
| Corn origin | |||
|---|---|---|---|
| Fatty acid (%) | Domestic | Imported | p |
| C16:0 (palmitic) | 13.3 ± 0.13a | 12.5 ± 0.32b | 0.038 |
| C16:1 (palmitoleic) | 0.17 ± 0.09a | 0.14 ± 0.01a | 0.057 |
| C18:0 (stearic) | 2.14 ± 0.08a | 1.69 ± 0.05b | <0.001 |
| C18:1 (oleic) | 31.3 ± 0.73a | 27.7 ± 0.20b | <0.001 |
| C18:2, n-6 (linoleic) | 50.6 ± 0.69a | 55.5 ± 0.34b | <0.001 |
| C18:3, n-3 (α-linolenic) | 0.94 ± 0.02b | 1.12 ± 0.01a | <0.001 |
| C20:0 (araquidic) | 0.57 ± 0.03a | 0.33 ± 0.01b | <0.001 |
| C20:1 (eicosamonoenoic) | 0.31 ± 0.01a | 0.26 ± 0.00b | <0.001 |
| MUFAS | 31.8 ± 0.74a | 28.1 ± 0.21b | <0.001 |
| PUFAS | 51.5 ± 0.70b | 56.6 ± 0.34a | <0.001 |
| SFAS | 16.0 ± 0.23a | 14.6 ± 0.36b | 0.006 |
| n-6 | 50.6 ± 0.76b | 55.5 ± 0.28a | <0.001 |
| n-3 | 0.94 ± 0.02a | 1.12 ± 0.01a | <0.001 |
| n-6/n-3 | 53.8 ± 1.09a | 49.5 ± 0.67a | 0.001 |
Values are means ± SEM of 10 samples. Different superscript letters (a, b) within rows indicate significant difference (p<0.05). MUFAS: monounsaturated fatty acids; PUFAS: polyunsaturated fatty acids; SFAS: saturated fatty acids; n-6: omega 6 fatty acids; n-3: omega 3 fatty acids.
Table 5 Mycotoxin contamination in domestic and imported corn samples.
| Mean | Median | Minimum | Maximum | |||||
|---|---|---|---|---|---|---|---|---|
| Mycotoxin | Origin | Number of samples analyzed | Number of positive samples | Percentage of positive samples | µg/kg | µg/kg | µg/kg | µg/kg |
| Aflatoxin B1 | D | 30 | 1 | 3% | 2.8 | -- | 2.8 | 2.8 |
| I | 23 | 2 | 9% | 1.9 | 1.9 | 1.7 | 2.1 | |
| Deoxynivalenol | D | 30 | 0 | -- | -- | -- | -- | -- |
| I | 23 | 14 | 61% | 252 | 182 | 109 | 484 | |
| Zearalenone | D | 30 | 0 | -- | -- | -- | -- | -- |
| I | 23 | 10 | 43% | 53 | 55 | 28 | 88 | |
| Fumonisin B1 | D | 30 | 30 | 100% | 889 | 718 | 113 | 3,290 |
| I | 23 | 23 | 100% | 694 | 682 | 95 | 2,390 | |
| Fumonisin B2 | D | 30 | 27 | 90% | 283 | 252 | 61 | 1,200 |
| I | 23 | 18 | 78% | 184 | 173 | 58 | 596 | |
| Fumonisin B3 | D | 30 | 20 | 67% | 154 | 139 | 52 | 308 |
| I | 23 | 12 | 52% | 112 | 93 | 59 | 213 | |
| Total fumonisins | D | 30 | 30 | 100% | 1,196 | 1,099 | 52 | 4,798 |
| I | 23 | 23 | 100% | 864 | 559 | 95 | 3,199 |
D: domestic corn; I: imported corn.
Deoxinivalenol (DON) and zearalenone (ZEA) were only found in imported corn, in 61 (14 of 23) and 43% (10 of 23) of the samples, respectively. DON levels ranged from 109 to 484 ppb, while ZEA levels ranged from 28 to 88 ppb. Fumonisins B1, B2 and B3 were found in all samples, regardless of their origin. In locally- grown corn total fumonisin values ranged from 52 to 4,798 ppb, while in imported corn the values ranged from 95 to 3,199 ppb.
Discussion
Corn is the main ingredient in complete poultry rations and therefore its quality plays an important role on the performance of laying hens and broiler chickens. Corn quality can be evaluated using different approaches, including the measurement of physicochemical variables or through biological assays. Corn quality can be measured using the subjective grading scale of the USDA-GIPSA (US1 to US5 and SG), and the corn imported from the United States into Colombia is expected to be US2 grade (Vanegas-Angarita, 2019). In the present study, however, only one of the 21 samples of imported corn tested was found to correspond to US2 grade (10 were US3-5 grades and 10 were SG grade). Two different scenarios could potentially explain this particular finding. The first possibility is that even though US2 grade corn is being imported into the country, the percentage of broken grains and dust formation increases during transportation and handling (Győri, 2017; Hernández et al., 2009), leading to lower quality grains. The second possibility is that corn from lower quality than US2 is being imported, a scenario that could even have legal implications. In any case, the end result is the same for the local producer: imported grain corresponds to mostly US3 grade or lower. Another important aspect of corn quality is the presence of specific contaminants such as potentially harmful seeds. The high occurrence of soybeans found in the imported corn samples (15/21) might represent a potential risk for poultry, due to the fact that raw soybeans are known to contain protease inhibitors, lectins, saponins, and other anti-nutritional compounds (Perilla et al., 1997). Although no studies have been reported regarding the cause of contamination of corn lots with soybeans, it is most likely that this contamination occurs during transportation, when the ships are loaded with both types of seeds.
Regarding the proximal analyses, the differences found in dry matter and ash contents between domestic and imported corn could be attributed to differences in the quantity and type of fertilizers used, soil composition and/or environmental factors (Agama-Acevedo et al., 2011). In regard to carbohydrate content (expressed as nitrogen- free extract), it has been reported that it may vary according to the type, size and shape of the grain; however, previous studies have not found differences between crystalline corn (indurata variety, the corn grown in Colombia) and floury corn (indentata variety, corresponding to imported corn) (Tovar and Colonia, 2013). Nevetheless, in the present study imported corn had significantly higher carbohydrate content compared with locally produced corn. This difference could possibly be related to differences in endosperm composition since domestic corn contains both hard and soft endosperm, while imported varieties only contain soft endosperm (Tovar and Colonia, 2013). The protein levels found in the present study were similar for both domestic and imported corn and are in agreement with previously reported crude protein values (Tovar, 2008; Tovar and Colonia, 2013).
An accurate assessment of energy content available for the bird from dietary ingredients is important in poultry nutrition because modern strains of poultry demand a precisely defined energy to protein balance. In commercial poultry, the term metabolizable energy (ME) is used to express the fraction of ingested gross energy used by the bird, and the apparent ME (AME) is the difference between gross energy in the feed and gross energy from losses -such as those from digestive secretions, intestinal flaking, bacteria and nitrogenous constituents from protein catabolism (Leeson and Summers, 2001). The present study compared the AME of one corn sample from domestic corn and one from imported corn. The results show a large difference in calculated AME values between imported and the domestic corn (319 kcal/kg higher in the latter). This difference in AME could be associated with lower crude fat content in imported corn (Table 3), which in turn might be the result of higher percentage of broken kernels and loss of corn germ (lesser quality). Another possible explanation for this difference could be the higher Fusarium mycotoxin content found in imported corn, which could be associated with fungal contamination in the field. Fungi secrete lipases that hydrolyze triglycerides to free fatty acids, which are then used as energy source by the fungus (Christensen and Kaufman, 1965). This fungal activity, therefore, decreases the energy content of the grain.
The fatty acid profile of the oil extracted from the two types of samples is consistent with previous studies (Carrillo et al., 2017; Győri, 2017 ). On the other hand, even though statistically significant differences were found in the present study, the overall fatty acid composition was similar between both types of corn. The predominant fatty acid in corn oil is linoleic (C18:2, n-6), followed by oleic (C18:1), palmitic (C14:0) and stearic (C18:0) acids (Győri, 2017). In a recent trial, the fatty acid profile of a corn sample included 52.7% linoleic acid, 29.7% oleic acid, 12.6% palmitic acid, and 2.0% stearic acid (Carrillo et al., 2017). These percentages are similar to those found in the present study for both types of corn, although the imported had a higher percentage of linoleic acid than the domestic corn (55.5 and 50.6%, respectively). Differences in fatty acid content can be attributed to changes in temperature before harvest (both heat or cold/freezing stress), which may decrease the content of specific fatty acids in the grain (Harwood, 1998).
As for mycotoxin content, a similar pattern of contamination with Aspergillus spp. mycotoxins (aflatoxins and ochratoxin A) was found in both samples. It should be noted, however, that corn samples used in this study represent only one crop year, and mycotoxin contamination may vary considerable as weather changes. Only two samples of imported and one of domestic corn contained AFB1 above the detection limit of the analytical technique (1 µg/kg), and in all cases the levels were below 3 µg/kg, whereas none of the samples contained ochratoxin A. Maximum residue levels for total aflatoxins are 10 and 20 µg/kg in human foods and animal feeds, respectively (Regulation 4506/2013 of the Ministry of Health and Social Protection of Colombia, and NTC 535-1, 2014). The AFB1 levels found in the samples analyzed do not pose toxicological risk for domestic species, even to the most sensitive ones such as pigs and ducks. These results are in contrast with those of a previous study conducted in Colombia, in which 4 out of 33 corn samples contained AFB1, with 20 µg/kg average concentration ( Díaz and Céspedes,1997), and underscore the need for continous monitoring of mycotoxins in corn. On the other hand, the lack of ochratoxin A contamination in both domestic and imported corn is consistent with previous studies conducted in Colombia (Céspedes, 1997), as well as in other countries of the American continent (Lee and Ryu, 2017). An interesting finding of the present study was the absence of the fusariotoxins DON and ZEA in domestic samples, which were present in 61 and 43% of the imported corn samples, respectively. These results agree with several studies conducted in the United States, in which high prevalence of DON and ZEA has been reported (Lee and Ryu, 2017). The DON and ZEA levels found pose no risk to chickens or hens (Diaz, 2020), however, they could potentially have adverse effects on health and productive performance of pigs. In regard to the fusariotoxins T-2 and HT-2, no detectable levels were found in domestic or imported corn. These results agree with recent studies (Lee and Ryu, 2017) and are the basis for the decision taken by the European Union about not regulating these toxins in human food or animal feed. The fusariotoxins known as fumonisins were the only mycotoxins found in all samples analyzed. These results are not surprising since fumonisins are commonly found in corn (Diaz, 2020); they are produced by a fungus that is a normal inhabitant -an endophyte- of the grain (Fusarium verticillioides). The importance of fumonisins lies not on their presence, but on their actual concentrations. In this regard, the levels found in some domestic and foreign samples were above the recommended levels for domestic animals such as horses and rabbits, for which no more than 1 mg of total fumonisins /kg is recommended in a complete diet (FDA, 2001).
In conclusion, the results of the present study show that corn imported from the US tends to have a higher content of broken grains, which might result from increased grain deterioration due to transport and loading and unloading processes. The dry matter content of imported corn was significantly lower than that in domestic corn, and resulted in numerically lower crude fat, which could be the reason for the lower AME value found in the imported corn sample, compared with the domestic one. In addition to these findings, the occurrence of soybean seeds in 71% of the imported corn samples may represent a potential hazard due to protease inhibitors and other anti-nutritional compounds present in raw soybeans. Further, imported corn samples contained fusariotoxins commonly found in North America that were not detected in domestic corn. Taken together, these findings suggest that domestic corn has better nutritional qualities and is safer in terms of mycotoxin and foreign seed contamination compared to imported corn. More studies are needed to investigate if these findings are consistent over time, and to determine if mycotoxin concentrations may vary depending on sampling times. Further studies are needed to determine if the differences observed in the present study result in differences in productive performance of poulty when these types of corn are used to formulate complete diets.

