


 Inglés (pdf)
 Articulo en XML
 Referencias del artículo
 Enviar articulo por email
 Citado por SciELO
  Citado por Google
  Similares en
SciELO
Similares en
SciELO  Similares en Google
 Permalink
Introduction
Even though genetics has a major influence on litter size in sheep, there are many environmental, nutritional and management factors playing a big role in the variation of litter size at birth (LSB) at the farm level. By focusing on some of these crucial factors, it is possible to improve not only litter size but importantly also, other traits such as weaning capacity. In general, increasing birth weight is difficult but still one can manage other factors to improve it slightly, and also to improve litter size viability at birth. The LSB is inherently a categorical trait and should be analysed using threshold models and it is a major determinant of successful reproduction in ewes and includes other sub-traits (ovulation rate, embryo survival, and uterine capacity) (Yazdi et al., 1999). Direct heritability estimates for LSB in sheep are usually low to medium (Hagger et al., 2002). Genetic evaluations for categorical traits, e.g., LSB, are achieved through different methodologies compared to evaluating continuous traits (Abdel-Azim et al., 1999). On the other hand, LSB in sheep can be effectively improved through phenotypic selection, even in small flocks (Casellas et al., 2007). The genes controlling LSB in any parity may differ from another; therefore, each parity must be treated as a different trait (Noguera et al., 2003; Roeche et al., 1995). The Bayesian approach via the Gibbs sampling has been used to estimate genetic parameters of LSB and birth weight, body weight, LSB, carcass traits and visual scores, survival, body condition score, wool shedding, worm resistance, wool and growth traits, and daily gain traits in several sheep populations (Latifi et al., 2017; Yadollahi et al., 2019; Yazdi et al., 1999; Ghavi Hossein- Zadeh, 2010; Júnior et al., 2017; King et al., 2006; Alves et al., 2016; Vargas Jurado et al.,2016; Ciappesoni et al., 2013; Gowane et al., 2015). The LSB is one of the most important meat production traits in sheep and could be used in genetic improvement schemes for meat production (Olesen et al., 1994).
There are approximately 50 million sheep and 27 breeds in Iran that provide about 42% of Iran's protein supply (Vatankhah et al., 2004). In the Middle East of Iran, the fat-tailed sheep, e.g., Makouie, are dominant (Esmailizadeh et al., 2011). Ewes and rams are often kept in the herd up to 7 parities and 5 breeding seasons, respectively. Lambing occurs once a year (late January to March) (Jafari et al., 2012). Even though some studies on Makouie sheep (growth traits, fleece and post-weaning weight, some reproductive traits) have been reported (Jafari et al., 2014; Jafari et al., 2012; Rahimi et al., 2014), very little is known about the genetic attributes of LSB in this breed. Thus, this study aimed to estimate genetic parameters for LSB in Makouie sheep using Bayesian threshold models.
Materials and Methods
Data preparation
This study was based on 7,091 LSB records from 14,968 dams and 682 sires collected from 1986 through 2012 at Makouie sheep breeding station, Makou, Iran. The data included the birth date, lambing date, herd, parity, gender, pedigree information and LSB, measured by the number of lambs born per ewe lambing. Due to low numbers of records, the triplets in each parity and total parities, and records in parities 3 (n = 904, 9.8% of total LSB records) and 4 (n = 424, 4.5% of total LSB records) were not considered in this analysis. The twin percentages in parities 1 and 2 were 8.4 and 8.8%, respectively (Table 3). The pedigree was prepared using CFC software (Sargolzaei et al., 2006) and its structure is shown in Table 1.
Statistical analysis
The parameters for data analysis used in the current study are presented in Table 2. Herd, year, and season of lambing, parity, and age of dam were assumed as fixed effects and were included in a multiple logistic regression model (Alison et al., 2001) to determine their effects on LSB. Only herd (45 levels) and year of lambing (17 levels) had significant effect on LSB (p<0.05). Therefore, herd and year were used as fixed effects in the statistical models.
Table 1 Structure of the Makouie sheep pedigree data.
| Individuals | Number |
|---|---|
| Total animals | 42,783 |
| Evaluated animals | 42,783 |
| Inbred in evaluated animals | 273 |
| Total sires | 682 |
| -Progeny | 11,249 |
| Total dams | 14,968 |
| -Progeny | 27,551 |
| Total inbred animals | 273 |
| Founders | 14,963 |
| -Progeny | 19,823 |
| -Sires | 520 |
| -Progeny | 8,135 |
| -Dams | 10,382 |
| -Progeny | 17,496 |
| -Without progeny | 4061 |
| Total animals with progeny | 15,650 |
| Total animals without progeny | 27,133 |
| Inbred animals: | |
| 0.00 < F ≤ 0.05 | 109 |
| 0.05 < F ≤ 0.10 | 33 |
| 0.10 < F ≤ 0.15 | 81 |
| 0.20 < F ≤ 0.25 | 49 |
Repeated threshold models
In the repeated-model analysis, the LSBs in all parities were considered simultaneously in the analysis. The data were analysed using six models, by considering different random effects (additive, maternal, and permanent environmental effects) and covariance between direct and maternal genetic effects. The models used were as follows:
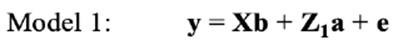


where y is the continuous random liability of the LSB, b, a, pe, m and e are the vectors of fixed, direct genetic, permanent environmental, maternal genetic and residual effects, respectively. Also, X, Z1, Z2 and W are the design matrices for fixed, direct genetic, maternal and permanent environmental effects, respectively. It was assumed that residual effects have an independent normal distribution with zero mean and
 variance.
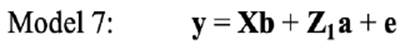
Univariate threshold models
In the univariate analysis, LSB for each parity was analysed separately. Therefore, the following models were fitted on LSB in each parity:


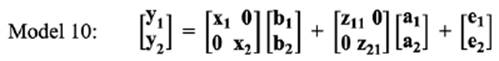
Bivariate threshold models
In the bivariate analysis, for estimating the genetic correlation between LSB in different parities, three bivariate models were fitted, as follows:


Bayesian estimation and priors
A uniform prior distribution was assumed for fixed effects. Normal prior distributions (N) were applied to the additive, maternal and permanent environmental effects as:
 where A, M, and I were the numerator additive genetic, maternal genetic relationship, and the identity matrices, respectively. Inverted chi- square distribution was assumed for variance components of additive, maternal, permanent environmental, and residual effects as:
 where subscript zero denotes the prior variances.
 and .
and .  .were set to
 of the total variance. For bivariate analysis, bivariate normal prior distributions were used for the additive genetic effect as:

where
 was the Kronecker product and G and M were the additive and maternal genetic (co) variance matrices, respectively. Inverted Wishart distributions (IW) were assumed for the (co) variance components as:

Bayesian estimation of variance components and genetic parameters in different threshold models were conducted using Gibbs sampling implemented in THRGIBBS1F90 from the Blupf90 program.
POSTGIBBSF90 was applied to calculate posterior means and 95% of the highest posterior density region (HPD 95%). The model compared with different fitted models to select the most appropriate model using the deviance information criterion (DIC) calculated as:
 ,where
 and
and
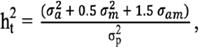
 are the posterior expectation of log-likelihood and log-likelihood evaluated at the posterior mean of the parameters, respectively. The model with the lowest DIC was considered the best model. In the end, for relevant modelling scenarios, more parameters were computed as well. Total heritability
 was computed as:
 were
were
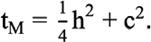
 was covariance matrix between additive and maternal effects. Total maternal effect (tM) was defined as
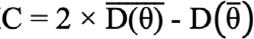
 Additive coefficient of variation (CVA) was computed as: CVA = 100 *
 where
where
 was the mean number of samples (x) and
 was additive genetic variance(Ghafouri-Kesbi et al., 2016).
Results
Descriptive statistics of LSB in Makouie sheep are shown in Table 3. The number of records in parity 1 was approximately twice the observations in parity 2 (4,997 vs. 2,219). The total mean (± standard error) and coefficient of variation (CV) of the trait were 1.084±0.278 and 26.65%, 1.087± 0.282 and 25.94% for parities 1 and 2, respectively. Herd and lambing year had significant effects (p<0.05) on LSB in this study. The current results showed 0 to 25% inbreeding rate in the Makouie sheep breed. The number of records in each analysis are shown in Table 3.
Table 3 LSB parameters and number of records in Makouie sheep breed used for the Bayesian analyses.
| Parity | Singles | Twins | Records | Mean | SD | CV% |
|---|---|---|---|---|---|---|
| Parity 1 | 4,997 | 461 | 5,458 | 1.084 | 0.278 | 25.65 |
| Parity 2 | 2,219 | 214 | 2,443 | 1.087 | 0.282 | 25.94 |
| Overall | 7,216 | 675 | 7,901 | 1.088 | 0.283 | 26.01 |
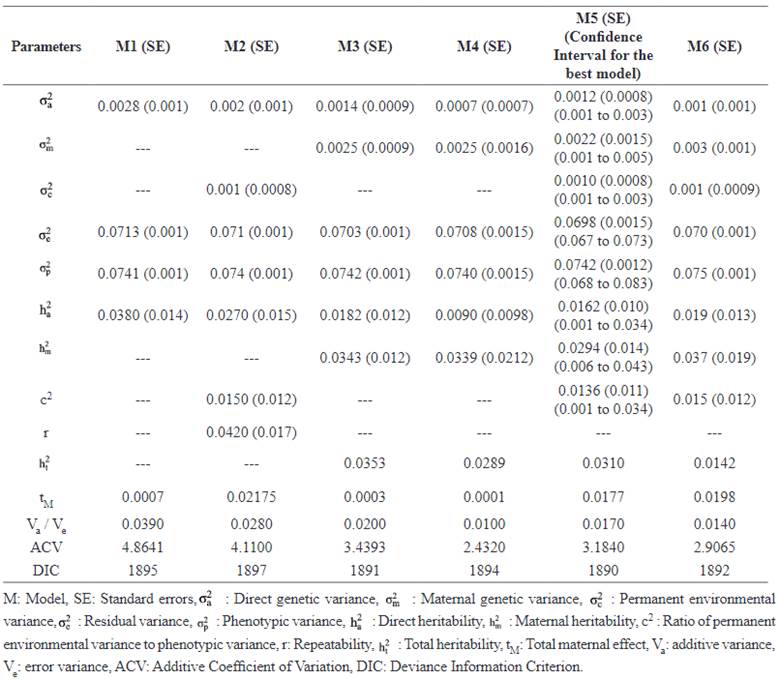
Estimates of repeated measures threshold models
The mean estimates of MPDs of genetic parameters for LSB obtained from repeated models, standard errors and HPD 95% interval for the best model (Model 5, shown bold-faced) are provided in Table 4. When maternal effects were considered in the model, additive genetic variance and direct heritability decreased. The direct heritability for LSB ranged from 0.0090 (Model 4) to 0.0380 (Model 1). The additive coefficient of variation CVA was also significantly different among the models and estimated lower in complex models (2.4320 and 2.9065, in Models 4 and 6, respectively) compared to the model with the lowest number of random effects (4.8641; in Model 1).
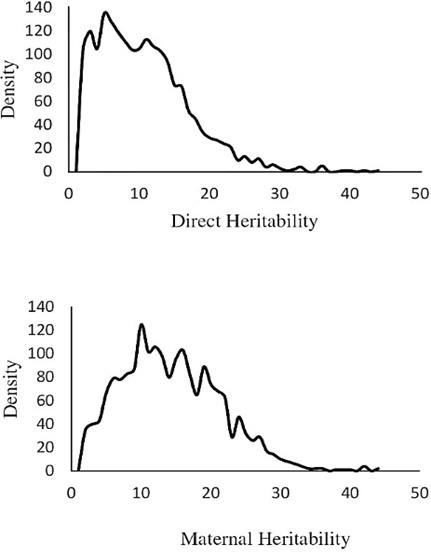
The animal-dependent permanent environ- mental variance was estimated as 0.001. The heritability of LSB in Makouie sheep ranged from 0.01 to 0.03. The models adopting covariance between additive and maternal effects resulted in lower estimations of total heritability. Figure 1 shows the MPDs of direct and maternal heritabilities (%) in repeated measurement analysis (the best model).
Estimates of univariate analysis
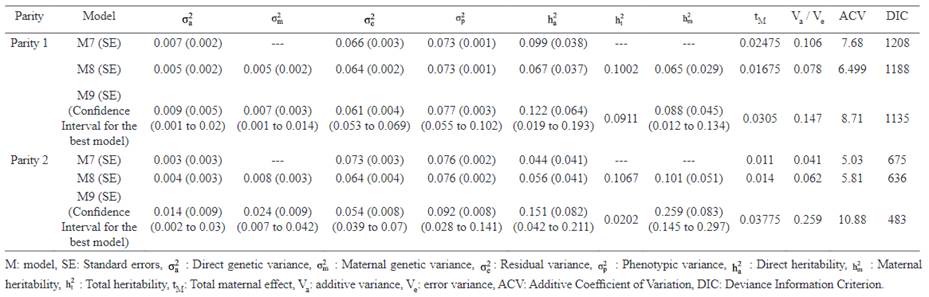
The additive genetic variance and direct heritability estimated by Models 7 and 8 were higher in parity 1 compared to those of parity 2. But the estimates obtained by Model 9 were higher in parity 2. The highest estimate of CVA was observed in Model 9 and this pattern was similar in both parities. Also, the highest estimate of additive genetic variance, maternal genetic variance direct heritability and maternal heritability (0.014, 0.024, 0.151 and 0.259, respectively, in model 9) were observed in parity 2.
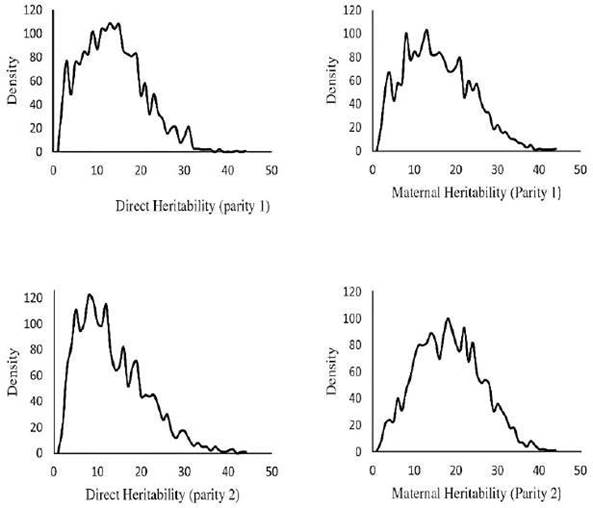
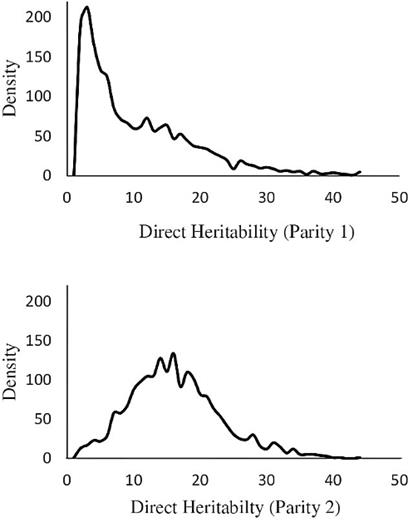
The means of posterior distributions (MPDs) of direct and maternal heritabilities in parities 1 and 2 were plotted for the best model (Figure 2).
The MPDs of direct heritabilities for parities 1 and 2 were very similar and were skewed in these parities. The highest ACV was estimated in Model 9 in each parity (4.11, 5.03 and 9.19 for Models 7, 8 and 9, respectively), and was maximum in parity 2. This trend was also observed for total maternal effect. The maximum estimate for total heritability was obtained for Model 8 in parity 2 (0.249).
Estimates of the bivariate model
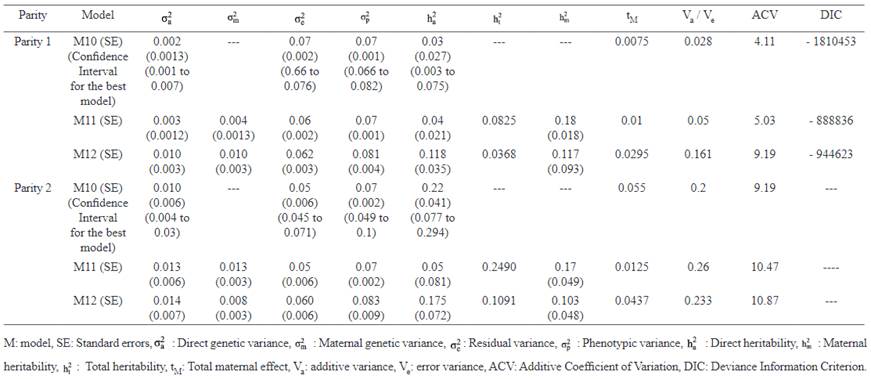
Means of MPDs, standard errors and HPD (95%) interval of parameters for the best fitted model in bivariate analyses of LSB are summarized in Table 6. Minimum (0.002) and maximum (0.010) estimates of genetic variance in parity 1 were obtained by Model 11 and Model 12, respectively. For maternal genetic variance, Model 12 had a higher estimate in parity 1 (0.010) than parity 2 (0.008).
In Model 11, an increasing trend for genetic variance was observed from parity 1 (0.004) to parity 2 (0.013). The estimates of direct heritabilities in parity 1 ranged from 0.030 (Model 10) to 0.118 (Model 12). On the other hand, maximum (0.220 in Model 11) and minimum (0.050 in Model 10) estimates of direct heritabilities were observed in parity 2. Conversely, the opposite trend was observed for maternal heritabilities in the present study (Model 11: 0.180 to 0.170; Model 12: 0.117 to 0.103 from parity 1 to 2). The largest estimate of total heritabilities for LSB was obtained using Model 11 for the first two parities.
Correlations between LSB at different parities
The estimates of phenotypic, direct genetic, maternal genetic, and residual correlations for LSB in the first two parities of Makouie sheep are shown in Table 7.
Discussion
The number of records in parity 2 was less than parity 1, which could be due to culling or mortality of some ewes after the first lambing. The mean of LSB in parity 1 (1.084) and parity 2 (1.087) showed a relatively flat trend that was consistent with the means reported by Bunter et al. (2013), suggesting that with increasing age, the mean of LSB increases from 1.40 (yearling) and 1.62 (2 years of age) to 1.74 (>2 years of age). Two breeds (maternal-cross ewes and merino ewes) were classified using their reproductive performance as a yearling (under 1.5 years of age), hogget (from 1.5 to 2.5 years of age) and adult (upper 2.5 years of age) groups (Newton et al., 2014). There is a tendency to improve ewe productivity with age (Ekiz et al., 2005) and it generally reaches a maximum level between four and seven years of age in ewes (Sodiq et al., 2011), but this was not confirmed in this study. However, the differences among parities were negligible (1.084 vs. 1.087 for parity 1 and 2, respectively). This was probably due to the low number of twins in the first two parities of Makouie sheep (twins in parity 1 and 2 were 9.22 and 8.79% of all records, respectively). These results were similar to the mean number of LSB reported in Baluchi sheep (1.10 to 1.12 in parity 1 to parity 4), but showed discrepancy with another report (Dominik et al., 2016; Yazdi et al., 1999). Our results were in agreement with the estimated mean numbers of LSB (1.75 in the first parity and 1.88 in the second parity) in Mule ewes (Mekkawy et al., 2010). Since the frequency of twins was low, this could have consequently resulted in a small variance. An average CV of LSB (36%) indicated the low phenotypic variation of this trait (Fogarty et al., 1995).
Table 7 Estimates of correlations between LSB at different parities.
| Parity 1 | Parity 2 | |
|---|---|---|
| Maternal genetic and phenotypic correlations | ||
| Parity 1 | 1 | 0.2575a (0.054) |
| Parity 2 | 0.0708a (0.004) | 1 |
| Direct genetic and environmental correlation | ||
| Parity 1 | 1 | 0.1243a (0.021) |
| Parity 2 | 0.0663a (0.002) | 1 |
Off-diagonal: maternal genetic correlation (above) and phenotypic correlation (below), Off-diagonal: direct genetic correlation (above) and residual correlation (below). aSignificant at p<0.05.
The significant effect of lambing year can be partially described by the variation in the climate conditions and impact of pasture on sheep feeding as well as different management and breeding conditions of ewes in different years (Yavarifard et al., 2015). The results showed that direct heritability estimates in all models were very low in the Makouei breed and ranged from 0.009 (Model 4) to 0.038 (Model 1). These results were in accordance with findings in Kermani sheep (0.01), Shall sheep (0.02), Zandi sheep (0.11), D’man ewes (0.1) and Lori sheep (0.175) (Mokhatri et al., 2009; Posht-e-Masari et al., 2013; Mohammadi et al., 2012; Boujenane et al., 2013; Mohammadi et al., 2015); however, a very low heritability for LSB (0.00) was estimated using a similar method in Guilan sheep (Eteqadi et al., 2017), and a nearly higher estimate (0.12) was reported using the same method in Australian fine-wool merino sheep (Mekkawy et al., 2010). The results showed that maternal variances were relatively high across entire estimated variance components, indicating higher effects of these components on LSB in Makouie sheep. The ACVs (Fogarti et al., 1995) over different models were different and the highest values for ACV were estimated for Models 1 and 2 (4.86 and 4.11, respectively), indicating a possible potential to genetically improve LSB in this parity. Interestingly, the largest estimate of SE was also observed in parity 2 for Model 9. This may be due to the lower number of records in parity 2 than in parity 1. By increasing the age of ewes and then parities, direct genetic variances increased in all modelling scenarios, which could be due to the lower direct heritability of reproductive traits and greater proportional influence of environmental effects than others. The heritability of LSB in Arabi sheep was estimated as 0.05, which was nearly in accordance with the present results in parity 1 (0.06 for Model 8) and parity 2 (0.044 and 0.056 for Models 7 and 8, respectively) (Roshanfekr et al., 2015). Interestingly, an increasing trend was observed for total heritability with increasing parity. A direct heritability of 0.03 was reported for LSB in Makouie sheep (Jafari et al., 2014), which is in accordance with current results obtained by bivariate analysis in parity 1 and 2. The direct heritabilities for LSB in the first three parities in Baluchi ewes using Bayesian bivariate analysis were 0.34 to 0.43 (Yazdi et al., 1999). The multivariate analysis was used and direct heritabilities were estimated as 0.52 to 0.57 for LSB in the first to fifth parities of Hungarian Merino sheep (Nagi et al., 1999). The Bayesian bivariate analysis estimated direct heritabilities from 0.12 to 0.18 for LSB in Mule ewes (Yavarifard et al., 2015). The MPDs for maternal heritabilities were different and, except for parity 2, the other parities had different trends that did not follow a Gaussian distribution. The MPDs of maternal heritabilities for LSB in parity 1 were more skewed than in parity 2, possibly due to the low number of twins at this parity. Moreover, it did not fit a normal distribution. A multi-trait analysis of LSB in five sheep breeds showed that estimated heritabilities had an ascending trend in parity 1 through parity 3 (Hagger et al., 2002).
In Model 9, direct and maternal heritabilities increased as the parity number increased. This is completely in agreement with another study that categorized reproductive performance of ewes based on their age (yearling, 2 years of age, and upper ages), and that heritability of LSB increased as age increased (0.05, 0.10 and 0.11 for yearling, 2 and 2+ ages, respectively) (Newton et al., 2014). However, the present results contrasted to another study where estimated heritability had a decreasing trend in cross-maternal ewes with increasing age (Ekiz et al., 2005). On the other hand, in two other models, the estimates of parameters in parity 2 showed a descending trend. The highest estimate of maternal variance for parity 2 (0.024) was obtained in the last model. This could be due to the maturity of ewes in parity 2 when they have become post-pubertal. Young mothers (2 to 3 years old) give birth to lighter lambs than sheep in middle age (4 to 5 years old) (Milan et al., 2011). In parity 2, the genetic variance was greater than in parity 1. Trends of estimated direct heritabilities from parity 1 to parity 2 in each model increased (Table 6) (Roshanfekr et al., 2015; Yazdi et al., 1999; Hagger et al., 2002). The production and reproductive traits in four sheep breeds (Danish Texel, Shropshire, Oxford Down and Suffolk) were studied to find that direct and maternal heritabilities of LSB in bivariate analyses were increased with increasing parities and direct heritabilities for the Suffolk breed and other breeds were reported to be 0.04 and 0.06, respectively (Maxa et al., 2005). This trend showed that LSB was affected by different genetic and environmental factors in each parity. Ascending trends were obtained for total heritabilities, total maternal effects and ACVs from parity 1 to 2. It seems that high additive genetic variances of LSB in parity 2 would result in high ACV values. Model 10 was selected as the best one in the bivariate analysis of LSB in Makouie sheep based on the DIC values. Figure 3 shows the MPDs of direct heritability for LSB in bivariate analysis. This indicates the similarity of environmental effects affecting LSB in different parities of Makouie sheep. It has been suggested that when the genetic correlation between repeated observations at different times is >0.80, there is no need to treat repeated observations as different traits because selection response will not significantly improve by this strategy (Yavarifard et al., 2015). Therefore, considering LSB at different parities as separate traits would be an acceptable strategy because twin lambing rate and heritability of LSB was very low as well as we found LSB's genetic correlation between two parities was very low (0.12). In this way, the maternal genetic correlation of LSB between two parities was also positive (0.26). High genetic correlations have been reported between parities or age groups for LSB in other studies, e.g., 0.928 to 0.999 between the first three parities (Hagger et al., 2002), 0.85 in different age groups (yearling, 2 and >2 ages) (Newton et al., 2014), 0.7 between parities 1 and 2 in Mule ewes (Yavarifard et al., 2015), and 0.8 between the first two parities in Hungarian Merino sheep (Nagi et al., 1999) using multivariate analysis. Overall, a positive correlation between LSB in different parities was observed. The factors that affect LSB in sheep are known: follicular activity, initiation of ovulation, ewe condition during mating, various gene activities including the activity of GDF9, Booroola, uterine environment, sheep maturity and age, effects of disease and abortion, feed availability and feeding, lamb birth weight, lamb thermogenesis, the effect of parasites, etc. Therefore, LSB is the net outcome of various factors that are typically variable, although they may not be easily controlled or individually measured. Overall, LSB could be considered a foundation for further analysis of the various factors related to lamb survival and lambing performance. The permanent environmental estimation of LSB in Makouie sheep was 0.015, indicating a considerable influence of environmental effects on LSB in Makouie sheep when compared with its heritability (0.027). Direct heritability of number of lambs born in Makouie sheep was reported as 0.03 (Jafari et al., 2014), which agreed with the present results (Model 1). Direct heritability and the ratio of permanent environmental effect to LSB in Rambuillet ewes were estimated as 0.09 and 0.05, respectively (Hanford et al., 2005). Direct heritability of number of lambs born per lambing was reported as 0.1 in Lori Bakhtiari sheep (Vatankhah et al., 2008). In the context of repeatability analysis, Model 5 was fitted on data with the best DIC criterion. Estimates of direct heritability, direct genetic and permanent environmental effects in all analyses and models compared well to findings of other studies and were very low, mainly due to the typical strong influences of environmental factors on LSB and low occurrence of twins in Makouie sheep.
In conclusion, the estimated means of MPDs of genetic parameters of LSB in Makouie sheep in conventional repeated models, univariate and bivariate models were obtained. Comparing different repeated models, the model with additive genetic, maternal and permanent environmental effects was the best. Under univariate analysis, estimated parameters of the best model (fitting additive genetic and maternal effects) increased with increasing parity, while a decreasing trend was obtained for other models. The results showed that the estimated variance components were very different among parities and depend on the model. Differences in estimated parameters over parities suggest that different factors influence LSB over time in Makouie sheep. In bivariate analysis, an increasing trend for genetic parameters over parities was obtained (based on the best model). Direct genetic and maternal effects have an important effect on LSB in Makouie sheep. We observed an ascending trend for direct heritabilities over parities.

