


Services on Demand
Journal
Article
 English (pdf)
 Article in xml format
 Article references
 Send this article by e-mail
Indicators
-
 Cited by SciELO
 -
 Access statistics
Related links
-
 Cited by Google
 -
 Similars in
SciELO
Similars in
SciELO -
 Similars in Google
Share

 Permalink
Revista ION
Print version ISSN 0120-100X
Rev. ion vol.27 no.1 Bucaramanga Jan./June 2014
vacuum residues and molecular distillation fractions using MIR-ATR
Jorge A. Orrego-Ruiz1,2; Rafael Cabanzo2; Enrique Mejía-Ospino2*
1 ECOPETROL S.A - Instituto Colombiano del Petróleo, Piedecuesta, Colombia.
2 Laboratorio de Espectroscopía Atómica y Molecular, Centro de Materiales y Nanociencias (CMN), Universidad
Industrial de Santander, Bucaramanga, Colombia.
*emejia@uis.edu.co
Fecha Recepción: 21 de octubre de 2013
Fecha Aceptación: 08 de mayo de 2014
In this work, prediction models of Saturates, Aromatics, Resins and Asphaltenes fractions (SARA) from thirty-seven vacuum residues of representative Colombian crudes and eighteen fractions of molecular distillation process were obtained. Mid-Infrared (MIR) Attenuated Total Reflection (ATR) spectroscopy in combination with partial least squares (PLS) regression analysis was used to estimate accurately SARA analysis in these kind of samples. Calibration coefficients of prediction models were for saturates, aromatics, resins and asphaltenes fractions, 0.99, 0.96, 0.97 and 0.99, respectively. This methodology permits to control the molecular distillation process since small differences in chemical composition can be detected. Total time elapsed to give the SARA analysis per sample is 10 minutes.
Keywords: MIR-ATR, PLS, SARA analysis, molecular distillation, vacuum residue.
de vacío y fracciones de destilación molecular usando MIR-ATR
En este trabajo se obtuvieron modelos predictivos para la determinación de la fracción de saturados, aromáticos, resinas y asfáltenos (SARA) en fondos de vacío y sus fracciones, a partir del análisis de treinta siete muestras de dichos fondos. Se utilizó espectroscopia infrarroja en el modo de reflectancia total atenuada en combinación con regresión de mínimos cuadrados parciales para predecir de manera relativamente exacta el análisis SARA. Los coeficientes de regresión para la calibración fueron de 0,99, 0,96, 0,97 y 0,99 para los modelos predictivos de saturados, aromáticos, resinas y asfáltenos, respectivamente. El tiempo requerido para el análisis SARA por muestra fue de 10 minutos.
Palabras claves: MIR-ATR, PLS, análisis SARA, destilación molecular, fondos de vacío.
de vácuo e frações de destilação molecular utilizando MIR-ATR
Neste trabalho, os modelos preditivos para determinar a fração de saturados, aromáticos, resinas e asfaltenos (SARA) em fundos de vácuo e suas frações foram obtidas a partir da análise de trinta e sete amostras de fundos. A espectroscopia de infravermelho foi utilizada em modo de reflectância total atenuada em combinação com regressão parcial para prever com precisão relativamente à SARA análise dos mínimos quadrados. Os coeficientes de regressão para calibração foram de 0,99, 0,96, 0,97 e 0,99 para os modelos preditivos saturados, aromáticos, resinas e asfaltenos, respectivamente. O tempo necessário para a análise SARA por amostra foi de 10 minutos.
Palavras-chave: MIR-ATR, PLS, análise SARA, a destilação molecular, fundos de vácuo.
Citar como: Orrego-Ruiz JA, Cabanzo R, Mejía-Ospino E. PLS models for determination of SARA analysis of Colombian vacuum residues and molecular distillation fractions using MIR-ATR. 2014;27(1):43-48.
Heavy oil reserves account for more than three times the amount of combined world reserves of conventional oil and gas, and while is growing the production, the amount of residues (like vacuum residues) in refineries will grow too [1]. The molecular study of vacuum residues has been very important in the field of Petroleum Chemistry, due to many refining processes that are closely related to their composition and chemical structure [2].
Molecular distillation is a process has found important applications in the purification of sensible materials to the temperature [3] and in fractioning of vacuum residues [4]. With the characterization of these fractions trough viscosity, API gravity and SARA analysis [5], it can be extended the true boiling point (TBP) curve [6,7]. The extension of TBP is very important in taking of a decision in refinery considering that Colombia produces a great variety of crude oil from different reservoirs and variable behaviour in distillation [8-10]. In addition, structural analysis focused on understanding of molecular distillation can be done using other spectroscopic techniques. Nevertheless, the gross analysis of vacuum residue and its fractions demand more than 200 grams per sample and this amount, depending of vacuum residue, could not be obtained easily to some fractions of molecular distillation. Additionally all these analyses spend long time, taking about 2 days per sample without considering the consumption of large amounts of toxic solvents [11]. The development of accurate and fast methods is an urgent need for quality control in processes in which are involved refining residues. Mid-infrared (MIR) spectroscopy in the attenuated total reflectance mode (ATR) has been used in the determination of physicochemical properties of crude oil and its fractions in association with chemometric tools with good results [12,13]. For that reason, a preliminary methodology to obtain the SARA analysis of vacuum residues and fractions of distillation molecular based on MIR-ATR spectroscopy and PLS regression was developed in the Colombian Institute of Petroleum of ECOPETROL S.A.
Experimental
Samples
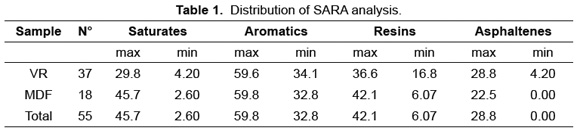
Thirty-seven vacuum residues (VR) of representative Colombian crude oils and eighteen molecular distillation fractions (MDF) were used to obtain the correlation models. Table 1 shows the maximum and minimum values of each component of SARA analysis which were obtained according to ASTM D-4124 [14]. Molecular distillation fractions have a broader variation, especially in saturates, and resins, in comparison with vacuum residues SARA components. While the maximum saturates concentration in vacuum residues is 29.8wt% in the molecular distillation fractions are as high as 45.7wt%.
The molecular distillation fractions were obtained from three vacuum residues from initial group of samples, using a wiped-film molecular distillation unit (model KD-6-1S of Chem. Tech. Services, Inc). In each run are possible obtaining three cuts to three temperatures from 350 to 691ºC AET (atmospheric equivalent temperature). So from each cut two fractions, condensed and residue, were obtained.
Acquisition of MIR spectra
The MIR spectra were recorded on a Shimadzu IR-Prestidge 21 spectrometer with a spectral resolution of 8cm-1 over the range of 4000-650cm-1 and 32 scans. This resolution was used in spite that in the majority of works the acquisition of spectra is reported with 4cm-1. The aim was to reduce acquisition time to one half, important aspect for analyzing a high number of samples. It is important to show that increasing the resolution does not affect the ability to predict gross properties and analysis time reduces. The spectrometer was equipped with a Pike Miracle attenuated total reflectance (ATR) diamond cell with simple reflection and incidence angle of 45º. An adjustable pressure system was used for assuring the contact between the sample and the ATR crystal. Acquisition time for 32 scans was 15 seconds, approximately. The spectral files were transformed to ASCII format using the IR-Solution software and exported to The Unscrambler® version 9.7 to perform the multivariable analysis.
Data analysis
Unlike traditional chromatographic methods (open column), the MIR spectroscopy does not resolve the sample components. All chemical information about components is embedded on multiple absorption bands; most of them highly overlapped (reference). To establish the relationship between MIR spectral data and SARA components Partial Least Squares (PLS) were used. The quality of models was evaluated according to values of root mean square error of calibration (RMSEC) and root mean square error of prediction (RMSEP). According to ASTM norm E1655-05 [15] preliminary studies can be performed to determine if there is a relationship between the IR spectra and the component/property of interest collecting 30 to 50 samples covering the entire range for the constituent/property of interest and testing the calibration model by cross-validation (ASTM E1655, 2005). In our case, 55 samples were used and validation of models was done using the full cross validation method [16].
Results and Discussion
Spectral features and data pretreatment
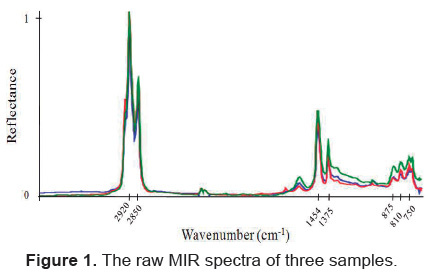
In general, vacuum residues have shown very similar spectra to those observed with other petroleum fractions (reference). Figure 1 shows MIR spectra of three samples of calibration. The most intense bands correspond to stretching vibrations at about 2920 and 2850cm-1 and bending vibration at 1454 and 1375cm-1 of aliphatic CH2 and CH3, less intense but also important for the chemometric analysis are vibrations associated to CH in aromatic rings [17] at 875, 810 and 750cm-1. Before processing the data in the PLS regression analysis all spectral signals were first derived and then normalized subtracting from them the regions from 1900-2750 and 3100-4000cm-1 where do not appear assignable signals to hydrocarbons to avoid interferences with atmospheric gases like CO2 and humidity.
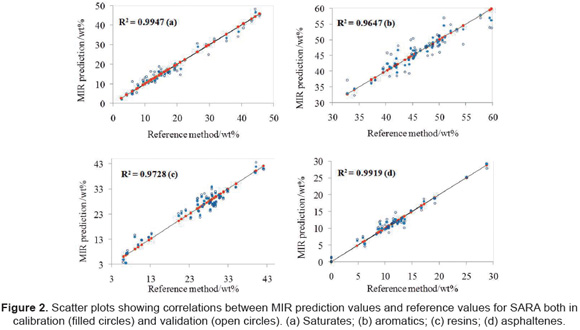
Partial least squares (PLS) regression analysis Individual calibration models were generated for each SARA component. With the purpose of evaluate the predictability of the models, pretreatments as derivation and normalization before and after derivation using data of different spectral regions were proved. Full cross validation was employed additionally to provide the optimal number of latent variables finally used in each model.
As shown in Table 2, resulting models are able to explain most of the X-variance; they have coefficients of regression highest than 0.96 and RMSEC lowest than 2%. From each model near to 10% of samples were excluded as outliers. Two types of outliers can be identified during the calibration procedures. The first type is a sample that represents an extreme composition relative to the remainder of the calibration set. The second type of outlier is one for which the estimated value differs from the reference value by a statistically significant amount. Such outliers could indicate an error in the reference measurement, an error in the spectral measurement, a clerical error in sample attribution or reference value transcription, or a failure of the model. In this last type of outlier we classify the samples that were discarded [15] (ASTM E1655. 2005). However, anyone of them corresponds to fractions of molecular distillation which means that the exclusion of samples did not affect the range of calibration. Even though the four SARA components are interrelated, the contribution of each one of them is determined individually. This implies that, if a particular sample did not have account for one particular model, not necessarily it must be excluded from the rest of models.
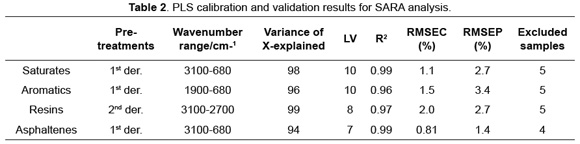
The Figure 2 summarizes the results obtained for each model. In addition, taking into account that the number of latent variables (LV) obtained in this work was smaller than those reported in other works, i.e. more than 10LV, the confidence is bigger. More than 10LV affects negatively the model robustness [12]. Success in obtaining prediction models lies in the accuracy of Y-values. If these values have a high uncertainty, then the models will have it also. The predictor model of aromatic fraction had the highest RMSEP and the lowest value of R2. It could be explained if it is considered that vacuum residues and its fractions are very heavy and they have a considerable amount of aromatic molecules with huge structural variety. The initial values of aromatic fractions could be uncertain since a part of them could elute with resins and other part could do it with saturates. Therefore, the initial values of aromatics have a high uncertainty which was "transferred" to the PLS model. So this predictor model reproduced the error of raw data.
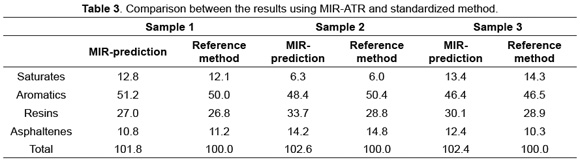
Models were posterior proved with the analysis of two fractions from molecular distillation unit (samples 1 and 2) and one vacuum residue (sample 3). All models were independent among themselves. So, if the sum of the components is near to one hundred, it means that the models are consistent. The three samples had SARA analysis with sums around 100%. In addition, in most of the cases, the differences between MIR prediction and reference method [14] (ASTM 4124) values were less than one. The results are summarized in Table 3.
Determination of SARA analysis of molecular
distillation fractions
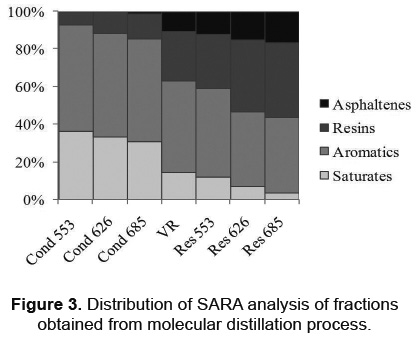
Finally the SARA analysis for a group of fractions from molecular distillation unit, were predicted. With this methodology was possible to differentiate each one of the six fractions obtained from three cuts (553, 626, 685ºC AET) of a raw vacuum residue. As we expect, the condensed are lightest and the residues are heaviest than raw vacuum residue, in terms on the increasing of resins and asphaltenes and the decreasing of saturates and aromatics values of these fractions. This can appreciate in Figure 3. Thus it is possible to infer that every one of these fractions is clearly differentiated between them and they can be used to extent the TBP curve of this crude.
Conclusion
Mid-Infrared (MIR) attenuated total reflection (ATR) spectroscopy was used to build models for predicting SARA analysis of vacuum residues. Vacuum residue from representative Colombian crudes and fractions obtained from molecular distillation process were used in order to have a huge variation range that allows doing an adequate quality control of molecular distillation process. The validation results indicate that there are consistencies between the MIR predicted values and those provided by the references methods. In addition it was possible to detect subtle changes in chemical composition of condensed and residue obtained in molecular distillation, namely, differentiating every fraction of molecular distillation process from a raw vacuum residue in terms on SARA analysis. Finally it was demonstrated that increasing the resolution from 4 to 8cm-1 does not affect the ability to predict gross properties and analysis time reduces.
Acknowledgments
The authors are grateful to Ecopetrol S. A. for its support through the "Convenio de Cooperación Tecnológica 003 de 2007" between Ecopetrol and Universidad Industrial de Santander (UIS) and to Colciencias by its scholarship "Francisco José de Caldas"
[1] Hinkle A, Shin EU, Liberatore M, Herring AM, Batzle M. Correlating the. Chemical and Physical Properties of Heavy Oils from around the World. Fuel. 2008;87:3065-70. [ Links ]
[2] Zhang ZG, Guo S, Zhao S, Yan G, Song L, Chen L. Alkyl Side Chains Connected to Aromatic Units in Dagang Vacuum Residue and Its Supercritical Fluid Extraction and Fractions (SFEFs). Energy Fuels. 2009;23:374-78. [ Links ]
[3] Hirota Y, Nagao T, Watanabe Y, Suenaga M, Nakai S, Kitano A, et al. Purification of steryl esters from soybean oil deodorizer distillate. J. Am. Oil Chem. Soc. 2003;80:341-6. [ Links ]
[4] Sbaite P, Batistella C, Winter A, Vasconcelos C, Maciel M, Filho R, et al. True Boiling Point Extended Curve of Vacuum Residue Through Molecular Distillation. Pet. Sc. and Tech. 2006;24:265-74. [ Links ]
[5] Speight JG. The Chemistry and Technology of Petroleum. Florida: Taylor and Francis Group; 2007. [ Links ]
[6] Boduszynski MM. Composition of heavy petroleums. 1. Molecular weight, hydrogen deficiency, and heteroatom concentration as a function of atmospheric equivalent boiling point up to 1400ºF (760ºC). Energy Fuels. 1987;1:2-11. [ Links ]
[7] Filho R, Batistella C, Sbaite P, Winter A, Vasconcelos C, Maciel M, et al. Evaluation of Atmospheric and Vacuum Residues Using Molecular Distillation and Otimization. Pet. Sc. and Tech. 2006;24:275-83. [ Links ]
[8] Molina DR, Navarro U, Murgich J. Correlations between SARA fractions and physicochemical properties with 1H NMR spectra of vacuum residues from Colombian crude oils. Fuel. 2010;89:185-92. [ Links ]
[9] Orrego-Ruiz JA, Guzmán A, Molina M, Mejía-Ospino E. Mid-infrared Attenuated Total Reflectance (MIR-ATR) Predictive Models for Asphaltene Contents in Vacuum Residua: Asphaltene Structure-Functionality Correlations Based on Partial Least- Squares Regression (PLS-R). Energy Fuels. 2011;25:3678-86. [ Links ]
[10] Meléndez LV, Lache A, Orrego-Ruiz JA, Pachón Z, Mejía-Ospino E. Prediction of the SARA analysis of Colombian crude oils using ATR-FTIR spectroscopy and chemometric methods. J. Pet. Sc. and Eng. 2012;90-91:56- 60. [ Links ]
[11] Kharrat AM, Zacharia J, Cherian VJ, Anyatonwu A. Issues with comparing. SARA methodologies. Energy and Fuels. 2007;21:3618-21. [ Links ]
[12] Aske N, Kallevik H, Sjoblom J. Determination of Saturate, Aromatic, Resin, and Asphaltenic (SARA) Components in Crude Oils by Means of Infrared and Near-Infrared Spectroscopy. Energy & Fuels. 2001;15:1304-12. [ Links ]
[13] Hongfu Y, Xiaoli C, Haoran L, Yupeng X. Determination of multi-properties of residual oils using mid-infrared attenuated total reflection spectroscopy. Fuel. 2006;85:1720- 28. [ Links ]
[14] American Society for Testing and Materials D4124. Separation of Asphalt into four fractions; 2001. [ Links ]
[15] American Society for Testing and Materials E1655. Standard Practices for Infrared Multivariate Quantitative Analysis; 2005. [ Links ]
[16] Svante-Wold MS, Eriksson L. PLS-regression: a basic tool of chemometrics. Chem. and Intelligent Lab. Sys. 2001;58:109-30. [ Links ]
[17] Khanna SK, Khan HU, Nautiyal SP, Agarwal KM, Aloopwan MK, Tyagi OS, et al. IR and HNMR Analysis of Asphaltic Materials Present in Some Indian Crude Oils of Gujarat Region. Pet. Sc. and Tech. 2006;24:23-30. [ Links ]
