


Services on Demand
Journal
Article
 English (pdf)
 Article in xml format
 Article references
 Send this article by e-mail
Indicators
-
 Cited by SciELO
 -
 Access statistics
Related links
-
 Cited by Google
 -
 Similars in
SciELO
Similars in
SciELO -
 Similars in Google
Share

 Permalink
Revista ION
Print version ISSN 0120-100X
Rev. ion vol.27 no.2 Bucaramanga July/Dec. 2014
Methods Coupled to Support Vector Machines using
H- NMR data (data of olive and hazelnut oils)
Oscar Eduardo Gualdron1*; Claudia Isaza2; Cristhian Manuel Duran1
1 Multisensory systems Research group.
* oscar.gualdron@unipamplona.edu.co
2 SISTEMIC Research group. Department of Electronic Engineering, Universidad de Pamplona, Colombia.
Fecha Recepción: 28 de diciembre de 2013
Fecha Aceptación: 17 de octubre de 2014
One of the principal inconveniences that analysis and information processing presents is that of the representation of dataset. Normally, one encounters a high number of samples, each one with thousands of variables, and in many cases with irrelevant information and noise. Therefore, in order to represent findings in a clearer way, it is necessary to reduce the amount of variables. In this paper, a novel variable selection technique for multivariable data analysis, inspired on stochastic methods and designed to work with support vector machines (SVM), is described. The approach is demonstrated in a food application involving the detection of adulteration of olive oil (more expensive) with hazelnut oil (cheaper). Fingerprinting by H NMR spectroscopy was used to analyze the different samples. Results show that it is possible to reduce the number of variables without affecting classification results.
Keywords: feature selection, H-NMR, simulated annealing, support vector machine, olive oil, hazelnut oil.
estocásticos acoplados a Maquinas de soporte vectorial
usando datos de H-NMR (data de aceite de oliva y avellana)
Uno de los principales inconvenientes que se presentan en el análisis y procesamiento de la información, es que en la representación de la información normalmente se encuentra un alto número de muestras, cada una de ellas con cientos de variables, en muchos casos con información irrelevante y ruidosa. Por lo que se hace necesario reducir la cantidad de variables. En este artículo se describe una novedosa técnica de selección de variables, inspirada en métodos estocásticos y diseñados para trabajar con máquinas de soporte vectorial (SVM). Los resultados son demostrados usando un conjunto de datos de aplicaciones alimentarias, específicamente, en la detección de la adulteración del aceite de oliva (más costosa) con aceite de avellana (barata). Para el análisis de las muestras se usó la técnica de espectroscopia RMN-1H (Resonancia magnética nuclear de protones). Los resultados demostraron que es posible reducir el número de variables sin afectar los resultados de clasificación.
Palabras clave: selección de parámetros, H-NMR, recocido simulado, máquinas de soporte vectorial, aceite de oliva, aceite.
estocásticos acoplados a máquinas de vetores de suporte,
utilizando dados H-NMR (dados de azeite de oliva e avelã)
Uma das principais desvantagens que surgem na análise e processamento de informação, é que na representação da informação normalmente existe um número elevado de amostras, cada uma com centenas de variáveis, muitas vezes, com informação irrelevante e barulhenta. Tornando-se, então, necessário para reduzir o número de variáveis. Este artigo descreve uma nova técnica para a seleção de variáveis, inspirada em métodos estocásticos e desenhados para trabalhar com máquinas de vetor de suporte (SVM). Os resultados são mostrados usando um conjunto de dados de aplicações alimentares, especialmente, para detectar a adulteração de azeite de oliva (mais caros) com óleo de avelã (mais barato). Para análise de amostras, utilizou-se a técnica de espectroscopia de 1H-RMN (ressonância magnética nuclear protónica). Os resultados demonstraram que é possível reduzir o número de variáveis, sem afetar os resultados da classificação.
Palabras-chave: seleção de parâmetros, H-NMR, recozimento simulado, máquinas de vetores de suporte, azeite de oliva.
Cita: Gualdron OE, Isaza C, Duran CM. Novel feature selection method based on Stochastic Methods Coupled to Support Vector Machines using H- NMR data (data of olive and hazelnut oils). rev.ion. 2014;27(2):17-28.
The use of both static and dynamic features from the response of H-NMR technology have resulted in an explosion of the variables that can be input to the pattern recognition (PARC). However, the use of a high number of variables at the input of a PARC system does not necessarily grant a better performance. In fact, using noisy or irrelevant variables at the input of a PARC system can jeopardise its training phase and result in lower performance during the recognition phase. Therefore, the idea behind variable selection is to get rid of response features that are redundant, noisy or irrelevant for the classification/ quantification tasks envisaged, in such a way that the dimensionality of data can be reduced without loss of useful information. By doing so, the PARC system could be trained faster and would generalise well. Moreover, an optimal configuration of the information could be devised using relevant features selected by the variable selection algorithm. Different strategies have been reported for the reduction of dimensionality but very little has been reported on variable selection for H-NMR information [1-3]. These, basically, consist of either choosing directly among the variables available [4-6] or to compute new variables called factors (e.g., by performing a principal component analysis or a linear discriminant analysis, etc.) [7-8].
The aim of this work is to introduce a new strategy for variable selection using stochastic search method (Simulated Annealing), and coupled classification techniques such as support vector machines (SVM), because they are one of the most promising pattern recognition algorithms for multisensory instruments due to their well-founded mathematical base, good generalization ability and robustness against outliers [9]. This strategy helps to prevent the use of noisy, irrelevant or redundant variables and provides more robust, accurate, and parsimonious classification models. The usefulness of this implementation is benchmarked by evaluating its performance in terms of three objective parameters: the success rate in classification, the dimensionality of the final set of variables used for training and the time needed to complete the variable selection procedure. The method developed is validated with data taken from 189 NMR measures of olive oil and hazelnut, both pure, and mixed.
The adulteration of virgin olive oil has been a serious problem for regulatory agencies, oil suppliers and customers for a long time. Due to the similarity between olive oil and hazelnut oil, this adulteration is hard to detect. Because of these illegal practices and the need to analyze the quality of the virgin olive oil, various analytical methods for the examination of the volatile compounds of olive oils have emerged. In this way, a large number of components that contribute to the aroma of olive oil have been identified. Distillation methods have traditionally been applied in the analysis of plant materials. For example, dynamic headspace techniques have been used to correlate the composition of the olive oil headspace to sensory attributes. More recently, the solid-phase microextraction (SPME) technique has been introduced as an alternative to the dynamic headspace technique as a sample pre-concentration method prior to chromatographic analysis [10-12]. This allowed the characterization of virgin olive oils form different varieties and regions.
The Nuclear Magnetic Resonance is other instrument used for these studies. Although not as sensitive as other techniques such as Gas Chromatography-Mass Spectrometry (GC-MS), it offers a fast and holistic glimpse into the samples being analyzed. Moreover, sample preparation is simple and does not destroy the sample, which can then be reused for other measurement techniques. A typical NMR spectrum is comprised by a set of resonances corresponding to different chemical compounds. The problem comes when the sample matrix is complex since there is no straight correspondence between peaks and compounds. In these spectra the same compound can have more than one peak and a single peak can hide the overlapping of different compound resonances. The obtained signal cannot be used directly with bio-informatics algorithms, with which it is necessary to carry out a series of basic operations (generally referred to as the pre-processed signal). These operations include the adjustment of the level of baseline, suppression of water response (in RMN), alignment of peaks, normalization, and selection of variables to name but a few. Normally, one encounters a high number of samples, each one with thousands of variants, and in many cases with irrelevant information and interference. Therefore, in order to represent findings in a clearer way, it is necessary to reduce the amount of variables. For example, a typical NMR spectrum contains as many as 65536 ("64k") data points. Most of these points are equal, highly correlated, or even meaningless among all the samples measured and irrelevant to the problem studied.
Database
In this study a database was obtained in experimental laboratory procedures, which was provided by the MINOS group at the University Rovira I Virgili of Tarragona (Spain). The data corresponds to both pure and mixed olive oils and hazelnut. Four commercial extra virgin olive oils, denoting the company and the olive fruit variety were used in the analysis: Carrefour Arbequina (ca), Carrefour Hojiblanca (ch), Carrefour Picual (cp) and Oleaurum Arbequina (oa).
Two types of hazelnut oil were used to prepare adulterations of 30%, 10%, 5% and 2% of hazelnut oil in extra virgin olive oils. The first hazelnut oil was regular hazelnut oil (av) (the type most commonly used in adulteration) and the second one was ecologic hazelnut oil (avp). For NMR analysis, approximately 2mL of each oil sample was introduced into a standard 5mm disposable NMR tube. Five preparations were made for each dilution, giving a total of 190 samples grouped in 38 classes: 4 pure olive oils, 2 pure hazelnut oils and 32 olive oil-hazelnut oil adulterations.
Each sample has been measured five times except in one case due to an experimental error. To be more precise, each sample has been measured only once by the equipment, but five preparations have been done in identical conditions of dilution and with the same method (i.e, five preparations for each type of oil were measured individually using the equipment). This number of repetitions was sufficient to be used in the processing stage using pattern recognition techniques (SVM), where n samples per class were used for the training stage and the rest for the validation stage of classifier model. Therefore, the error of repetition will be due to the combination of the repetition of the instrument (reliable) and that of the person who has prepared the results.
For each sample, H NMR spectra was recorded at 310K on a Bruker Avance III 600 spectrometer operating at a proton frequency of 600.20 MHz using a 5mm CPTCI triple resonance (1H, 13C, 31P) gradient cryoprobe. One-dimensional 1H pulse experiments were carried out using the nuclear Overhauser effect spectroscopy (NOESY)- presaturation sequence (RD-90°-τ1-90°-τm-90° ACQ) to suppress the residual water peak. τ1 time was set to 4μs and τm (mixing time) was 100ms. The 90° pulse length was calibrated for each sample and varied from 10.89 to 11.36μs. The spectral width was 30ppm, and a total of 64 transients were collected into 64k data points for each 1H spectrum.
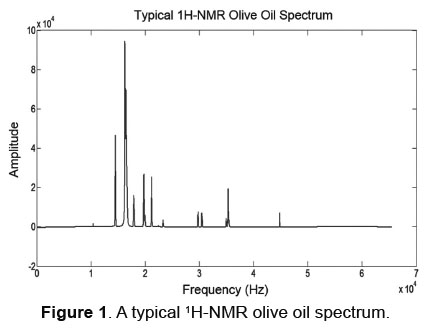
Figure 1 shows a typical 1H-NMR spectrum obtained with these samples of oils. It can be clearly seen the high number of overlapping peaks and the difficulty of processing these data in certain regions. Therefore, it is necessary to find strategies to reduce the dimensionality of the data set using variable selection techniques, without losing important information and assistance in data processing. In other words, one of the main priorities should be to reduce the dimensionality of each spectrum, trying to eliminate the noisy regions of the spectra (the parts not related to the problem being studied), while preserving the meaningful information, maximizing its numerical importance.
This measures represent the intensity value of the spectrum (relative frequency, it ranges between -2.2 and 11.5, including 0). Equally, a pre-process stage was done with the oils in the following manner: The measures have been aligned according to the peak of TSP that are exactly 0ppms. They are then aligned according to the area of their peak of TSP.
Variable selection process
To begin with, a normalization process is carried out with all of the data taken from the olive oil and hazelnut. Initially eliminated non-relevant information (elimination of extremes), where most irrelevant data provide information near zero, corresponding to values before and after of the process of acquiring the NMR spectrum. These regions don't were selected for variable selection process (Figure 1).
The variable selection process implemented consists of three steps that are run consecutively, the first step allowed us to reduce the number of variables by using signal-treating techniques, especially wavelet transform. The second step helped to detect and remove non-informative, noise variables and was conducted in a supervised way. Finally, in the last step a greedy search method was applied to the reduced variable set (simulated annealing), which results from applying the first two steps. With this strategy, we assured a considerable reduction in variables with a low computational cost, principally in the first two steps.
Compression and reduction variables
After carrying out the process of elimination of extremes, and due to the great dimensionality of the data obtained through HNMR analysis (more than 20,000 variables), it was necessary to reduce the number of variables even more, and in this way, reduce the computational time of the process. For that a strategy based on new techniques of compression, like the wavelet transform, was proposed. The wavelet transform can be used for many reasons: compression [13-14], multi-scale cluster analysis [15], denoizing [16], etc. The wavelet transform belongs to a series of signal analysis techniques commonly called multi-resolution analysis. This means that it is capable of varying the resolution of parameters which are analyzed throughout the analysis (scale, time and frequency concepts), therefore making correlations between the original signals with the mother wavelet and projecting the signal over wavelet. Taking as a foundation the fact that signals used in this work are non-stationary, it was carried out the compression process, using Discrete Transform Wavelet (DTW) to reduce the size of the variables, and selecting wavelet coefficients of approximation (they stored relevant information). It is important to mention that depending on the signal characteristics, a mother wavelet is determined, which in our case was a haar mother wavelet (this because to scale the behavior of the spectrum the haar wavelet was the most recommended and showed better results).
Removal of non-informative and noisy features
After a compression process featuring wavelet transform (approximation coefficients in their sixth iteration) the results are passed to a second stage of feature selection. Here, a criterion was used to rate the discrimination ability of each variable (peak NMR), to distinguish the group of measurements of each class or category with respect to the other (in our case, Oil types). This selection criterion applies the concept of variance (measure of dispersion defined as the expectation of the square of the deviation of the variable with respect to the measure). Measurements used for training were grouped in categories (e.g. measurements of the same type of oil were grouped in a category, etc.). For each peak, intra-category and inter-category variances were computed. Intra-category variance was defined as the variance of an peak considered within a given category of measurements [17- 18]. Therefore, the intra-category variance of the j-th variable (peak) was defined as: Equation 1 (Equation that applied the concept of variance).
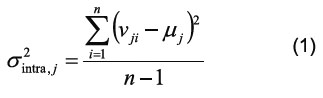
Where σ2intra,j = sum of the variance between measurements of each categories. n is the number of measurements within the category, vji is the value of peak j for measurement i and μj is the mean of peak j over the measurements within the category. In a similar way, for every peak, a inter-category variance was defined as the variance within the category means. Therefore, the inter-category variance was defined as:
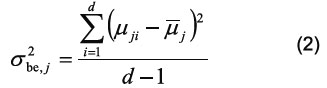
Where σ2 be,j = sum of the variances between categories, μji is the mean of peak j over the measurements within group i, d is the number of different categories and μj is the mean over the μji.
The discrimination ability of the j-th peaks was defined as follows:
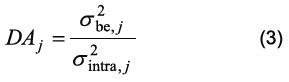
The higher the discrimination ability for a given peak is the more important is this peak to correctly discriminate between the categories. In other words, noisy or non-informative will have associated low discrimination abilities. Therefore, a set of peaks, which comprises those that have the higher figure of merit, is selected for further analysis. This method would be equivalent to compute Fisher's linear discriminant if the number of categories to sort measurements within was d = 2. This process is univariate and there is a risk of eliminating those synergetic variables that have low discrimination ability when considered individually. To minimise this problem the process is repeated considering all the possible combinations between two peaks. Figure 2 illustrates this process. As a result, a new list of figures of merit, DAi,j, i.e., the discrimination ability when peaks i and j are used simultaneously, is obtained. This allows for re-selecting variables that had been removed previously, if a synergistic effect is revealed. Figure 2 show a methodical representation of the geometrical interpretation of the process used to compute the figure of merit for any two given features (case of 3 different categories). The intra-category variance is computed as the average of the squared distances between measurements within a category (e.g., mi) and the category centroid (e.g., c1). The between-category variance is computed as the summation of the distances between category centroids and the overall centroid (cc) d2(mi-c1) [17-18].
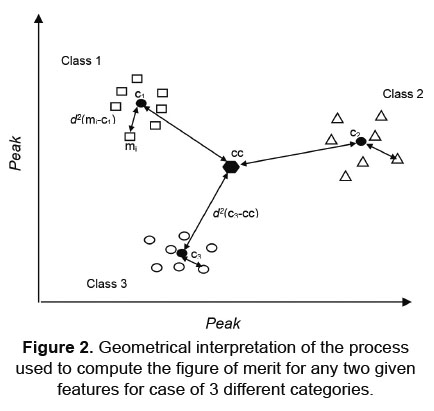
The detail steps to calculate this figure of merit are the following:
- Calculation of the centroid for each class of measurements available on the study (C1, C2 and C3 in the example on Figure 2).
- Computation of the average distance between centroids (interclass variance).
- Computation, for each class, of the average distance between all their measurements and the class centroid.
- Computation of the average value of step three for all classes (intraclass variance).
- Division of the interclass variance and the intraclass variance.
Having carried out this second stage allows a significant reduction in the number of variables and leaves the stage of pre-processing ready to continue to the third and final stage, which is based on a stochastic search strategy (simulated annealing) adjusted to efficient classification techniques, especially SVM. This gives a select group of variables as a result (biomarkers), which add up to good classification percentages when analysing and differentiating between the samples. Below shows the summary of these two methods (SVM and SA).
Support Vector Machines
SVM is a method of calculating the optimal separating hyperplane in the feature space. Optimal separating hyperplane is defined as the maximum-margin hyperplane in the higher dimensional feature space. The use of the maximum-margin hyperplane is motivated by statistical learning theory, which provides a probabilistic test error bound which is minimized when the margin is maximized [19].
The parameters of the maximum-margin hyperplane are derived by solving a quadratic programming (QP) optimization problem. There exists several specialized algorithms for quickly solving the QP problem that arises from SVMs. The original SVM was a linear classifier. However, Vapnik suggested using the kernel trick. In the kernel trick, each dot product used in a linear algorithm is replaced with a non-linear kernel function. This causes the linear algorithm to operate in a different space. For SVMs, using the kernel trick makes the maximum margin hyperplane be fit in a feature space. The feature space is a non-linear map from the original input space, usually of much higher dimensionality than the original input space. More information about this PARC method can be found elsewhere.
Stochastic Methods (Simulated Annealing)
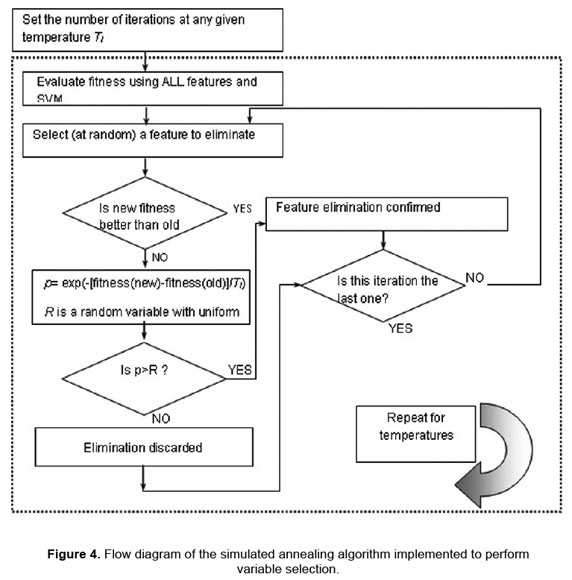
Simulated annealing (SA) is a stochastic technique derived from statistical thermodynamics for finding near globally optimum solutions to complex optimization problems (i.e., with a high number of degrees of freedom) [20]. The algorithm proceeds stepwise through a search space defined by all possible solutions to the optimization problem. After each iteration (e.g. after a variable has been removed), the value of the cost function for the new step is compared to that of the previous step. If the new solution is better than the old one, the removal of the variable is confirmed. If the new solution is worse than the old one, there is still a probability, p, for the removal of the variable to be accepted. This offers the algorithm the possibility to jump out of a local optimum [21-22]. Otherwise, the removal of the variable will be discarded and the previous step will be the starting point for the next attempt to eliminate a variable. The probability p for accepting a worse solution depends on the difference between the new and previous solution as follows:
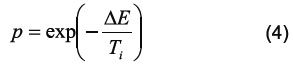
Where ΔE = fitness (new) - fitness (old) and Ti is the annealing temperature (its initial value is set by the user). Since the cost function (or fitness) being optimized by the SA is the prediction error of either a SVM based classifier, ΔE is positive when the new solution is worse than the old one. Figure 3 shows p as a function of the annealing temperature, Ti, for positive values of ΔE. This figure shows that, as the annealing temperature is reduced, the probability for accepting a worse solution decreases significantly.
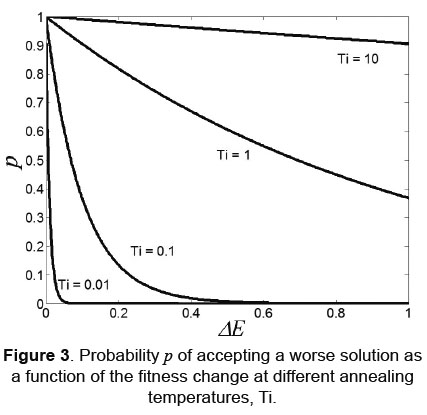
Figure 4 shows a flow diagram of the SA algorithm implemented. The initial temperature (value 0.1), and the whole process of variable selection is repeated a fixed number of times for monotonically decreasing annealing temperatures are defined by the user. After every change in the annealing temperature, the algorithm starts selecting variables from the complete set of variables. The values of R and the variable to be eliminated in each iteration were randomly selected using a random function within the program.
The cost function is used to rank the fitness of solutions (i.e., combinations of features) during the process of stochastic feature selection. Since in most metabolomic applications a high number of variables are highly collinear or non-informative, about 70% of the original variables are eliminated by the first three steps. Therefore, the last step is aimed at fine tuning the selection process. Although stochastic feature selection methods are time-consuming, run to select among a reduced set of features that result from the three previous steps is fast.
Initially, analysis of samples of extra virgin olive oils was achieved, a four-category classification was attempted, which corresponded to the identification of the four olive oils types, each category was represented by five measurements (except in a case of experimentation error), thus obtaining a database of 19x65536, a spectrum resulting from H-NMR analysis.
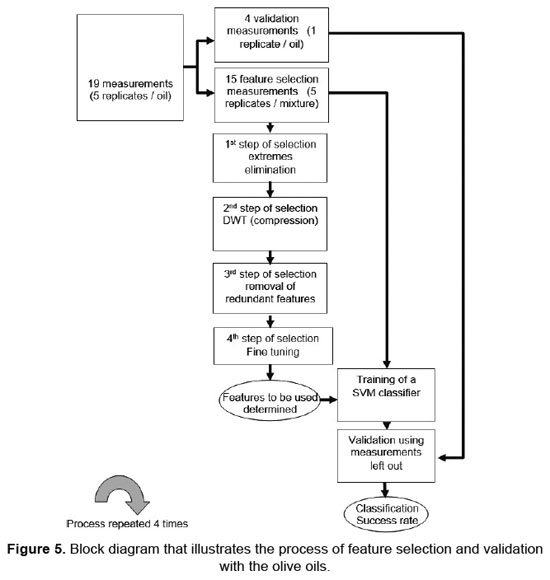
Four different training and validation sets were formed as follows: 1 replicate measurement per type of oil integrated to the validation set (e.g. the first replicate measurement was used in the first validation set, the second replicate measurement was used in the second validation fold, and so on). The remaining 3 replicate measurements per type of oil integrated to the training set. In this way 4 validation sets (4 measurements in each set), and 4 corresponding training sets (15 measurements in each set) were obtained. Then the process of variable selection was performed 4 times on each feature selection dataset.
The process of feature selection was conducted as follows. The first step of feature selection was applied to eliminate non relevant information (information close to zero), thus eliminating 30528 variables, 15264 from the top and bottom of all the classes. The second step was then applied to compress and reduce the size of the dataset. Taking as a foundation the fact that signals used in this work are non-stationary, we carried out the compression process, using Discrete Transform Wavelet (DTW) to reduce the size of the variables, and selecting wavelet coefficients of approximation (they stored relevant information). This process was repeated six times, giving as result a reduction in grouped variables in sized blocks, ordered 2^N, where N is the number of iterations. That is to say the information was grouped into 547 blocks, a process done with all the classes. It is important to mention that depending on the signal characteristics, a mother wavelet is determined, which in our case was a haar mother wavelet (this because to scale the behavior of the spectrum the haar wavelet was the most recommended and showed better results).
The third step of feature selection was applied to eliminate noisy and irrelevant features. By setting to 0.5 the threshold value of the discrimination ability (both univariate and multivariate methods), 134 features were initially selected. Computing the first three steps required about 5 minutes in an intel core i5 PC platform. Finally a simulated annealing feature selection was run to select among the remaining features. The SA algorithms were run for 3 different annealing temperatures and the number of iterations per temperature was set to 130. More details on the simulated annealing algorithm used can be found in the section 3.4. At the end, only between 10 and 38 features (beans) were selected for each class (no matter what feature selection dataset was used).
Due to the fact that in the second stage the original variables were grouped in blocks after having compressed the information using wavelet transform, it is necessary to recover the above variables, which is done by multiplying each of the blocks selected in the SA-SVM phase by the factor 2^N. Then the extracted variables on the bottom side of the original normalised matrix are added up. In this way the regions of the selected variables are present in the process.
Using these features as inputs, 4 SVM classifiers were trained employing the 4 feature selection datasets, and their performance in classification estimated using the corresponding validation datasets. A one-against-all strategy was used to build the SVM classifier. Therefore, 4 SVM were built. The first SVM was trained with the training samples in class 1 with positive labels and all other training samples with negative labels, and so on. A fold validation strategy was used to estimate the performance in extra virgin olive oils identification using SVM models. Different kernel functions were tested such as linear, polynomial (2nd degree) and radial basis. The best results were obtained when a 2nd degree polynomial was used as kernel function. The best results were obtained when C (cost parameter) was chosen to be higher than or equal to 217. Such a high value for this parameter implies that almost every training sample had to be correctly classified at the end of the training process.
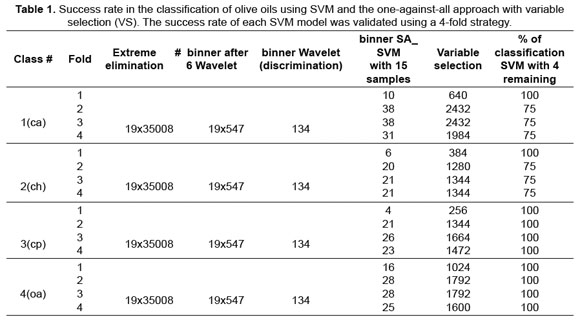
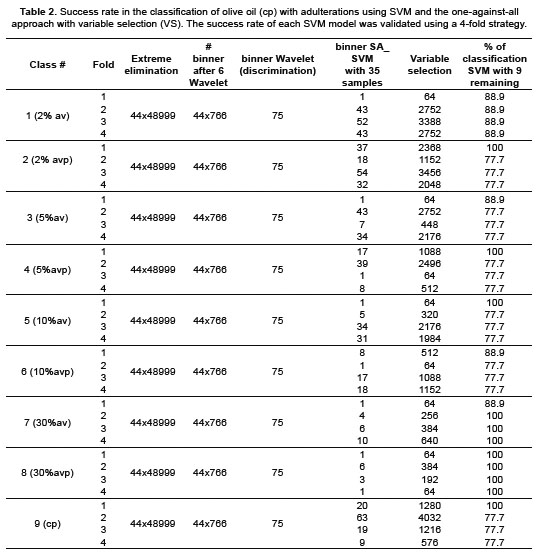
Figure 5 shows a block diagram of the feature selection and validation processes. It is important to keep in mind that for every SVM classifier, the validation implies using measurements that have not participated in the feature selection process and are, therefore, new. The success rate of a particular SVM model is obtained by averaging identification rates over the 4 folds. When the variable selection procedure was employed, the overall success rate in identification was 81.25% for (ca) oil, 81.25% for (ch), 100% (cp) and 100% (oa).Table 1 summarizes the classification results. Finally, another test was done in which the aim was not to differentiate between the oils as in the previous case but to analyse a specific oil (cp), with different grades of adulteration to hazelnut oil. (The adulterations were 2% (02), 5% (05), 10% (10) and 30% (30) with the hazelnut oils avp and av). The objective was to differentiate each of the said classes from the rest, and equally to determine that selective variables allow them to be differentiated. The variable selection process implemented was the same as that mentioned earlier. The results are shown in Table 2.
Table 1 shows the results of classification of the four types of pure olive oil, after the selection process of variables proposed in this work and it can be concluded that, in a small number of variables the percentages for the classification of each of the types of oil with respect to the other three are validated for each test with four different blocks using the model SVM classifier (for example in the case of the variety of olive oil type (cp), with a number of 256 selected variables from the initial 65536 was reached to 100 per cent in the classification (differentiation between the class with the other three). Similarly, it is possible to reduce a number of variables to 640, 384, 1024 for classes ca, ch, oa, respectively coming in all the cases to 100% in the classification.
A new method of variable selection inspired in stochastic selection has been introduced. The method is specifically designed to work with SVM classification. The usefulness of the method has been assessed using NMR database of olive and hazelnut oils. SVM classification models were built either using a small set of selected variables. The variable selection procedure led to a dramatic reduction in the number of input features used by the SVM models (between 90-95% were eliminated), obtaining significant classification percentages from the oils and their adulterations. These performances were estimated using a careful fold-validation method.
It is important to emphasise that although the results obtained are promising, the reality is that the variation of the spectrums (information given by descriptors) of each samples is not hugely significant to perform the respective adulterations. In reference to the above we conclude that the potential of SVMs as classifiers can to a certain extent be interesting when trying to differentiate between specific classes, as with the data studied, given that despite its similarities, it was able to classify a high percentage with little selected variables (even with variables with little intensity).
It can generally be said that the implemented methods are interesting and reliable for a given selection process, ensuring accuracy in the determination of efficient variables due to their stochastic searching. In addition, it is a good classification process with efficient variables because through support machines it guarantees minimal structural risk, quicker than other known techniques.
The authors thank the MINOS Group of University Rovira I Virgili for allowing access to the database. Also, thanks to the Department of Electronic Engineering at Universidad de Pamplona and to "Estrategia de sostenibilidad 2014-2015 Universidad de Antioquia". COLCIENCIAS National Grant No 11214522117 funded this project.
[1] Vigneau E, Thomas F. Model calibration and feature selection for orange juice authentication by H NMR spectroscopy. Chemometrics and Intelligent Laboratory Systems. 2012;117:22- 30. [ Links ]
[2] Di Anibal C, Callao MP, Ruisánchez I. H NMR variable selection approaches for classification. A case study: The determination of adulterated foodstuffs. Talanta. 2011;86:316-23 [ Links ]
[3] Charlton A, Robb P, Donarski J. Non-targeted detection of chemical contamination in carbonated soft drinks using NMR spectroscopy, variable selection and chemometrics. Analytical Chemical Acta. 2008;618(2):196-203. [ Links ]
[4] Sun K, Liu J, Kang J-L, Jang S-S, Wong DSH, Chen DS. Soft Sensor Development with Nonlinear Variable Selection Using Nonnegative Garrote and Artificial Neural Network. Computer Aided Chemical Engineering. 2014;33:883-8. [ Links ]
[5] Friedel M, Patz CD, Dietrich H. Comparison of different measurement techniques and variable selection methods for FT-MIR in wine analysis. Food Chemistry. 2013;141(14):4200-07. [ Links ]
[6] Goodarzi M, Coelho L. Firefly as a novel swarm intelligence variable selection method in spectroscopy. Analytica Chimica Acta. 2014;852:20-7. [ Links ]
[7] Noori R, Karbassi RA, Moghaddamnia A, Han D, Zokaei-Ashtiani MH, Farokhnia A, et al. Assessment of input variables determination on the SVM model performance using PCA, Gamma test, and forward selection techniques for monthly stream flow prediction. Journal of Hydrology. 2011;401(3-4):177-89. [ Links ]
[8] Zabalza J, Ren J, Yang M. Novel Folded- PCA for improved feature extraction and data reduction with hyperspectral imaging and SAR in remote sensing. ISPRS Journal of Photogrammetric and Remote Sensing. 2014;93:112-22 [ Links ]
[9] Khalifa SA, Maldonado-Bascón S, Gardner JW. Identification of CO and NO2 using a thermally resistive microsensor and support vector machine. In: IEEE Proceedings, Science, Measurement and Technology; 2003 March 20-25; EUA.150 p.11-14. [ Links ]
[10] Jiménez A, Beltrán G, Aguilera MP. Application of solid-phase microextraction to the analysis of volatile compounds in virgin olive oils. Journal of Chromatography A. 2004;1028(2):321-4. [ Links ]
[11] Vichi S, Castellote A, Pizzale L. Analysis of virgin olive oil volatile compounds by headspace solid-phase microextraction coupled to gas chromatography with mass spectrometric and flame ionization detection. Journal of Chromatography A. 2003;983(2):19- 33. [ Links ]
[12] Liberatore L, Procida G, d'Alessandro N. Solid-phase extraction and gas chromatographic analysis of phenolic compounds in virgin olive oil. Food Chemistry. 2001;73(1):119-24. [ Links ]
[13] Widjaja J. Multiple low-contrast fingerprint detections by using compression-based joint wavelet-transform correlator. Optics & Laser Technology. 2013;47:37-42. [ Links ]
[14] Hou X, Han M, Gong C, Qian X. SAR complex image data compression based on quadtree and zerotree coding in Discrete Wavelet Transform Domain: A Comparative Study. Neurocomputing. 2015;148:561-8. [ Links ]
[15] Wang C, Shi A-Y, Wang X, Wu F-M, Huang F-C, Xu L-Z. A novel multi-scale segmentation algorithm for high resolution remote sensing images based on wavelet transform and improved JSEG algorithm. Optik - International Journal for Light and Electron Optics. 2014;125(19):5588-95. [ Links ]
[16] Artursson T, Holmberg M. Wavelet transform of electronic tongue data. Sensors and Actuators B: Chemical. 2002;87(2):379-91. [ Links ]
[17] Llobet E, Gualdrón O, Vinaixa M, El-Barbri N, Brezmes J, Vilanova X, et al. Efficient feature selection for mass-spectrometry based electronic nose applications. Chemometrics and Intelligent Laboratory Systems. 2007;85:253-61. [ Links ]
[18] Gualdrón O, Brezmes J, Llobet E, Amari A, Vilanova X, Bouchikhi B, et al. Variable selection for support vector machine based electronic noses. Sensors and Actuators B. 2007;122:259- 68. [ Links ]
[19] Rakotomamonjy A. Variable selection using SVM based criteria. Journal of machine learning Research. 2003;3:1357-70. [ Links ]
[20] Yang X-S. Simulated Annealing. In: Nature- Inspired Optimization Algorithms. Luniver press. United Kingdom 2014. p. 67-75. [ Links ]
[21] Brusco MJ. A comparison of simulated annealing algorithms for variable selection in principal component analysis and discriminant analysis. Computational Statistics & Data Analysis. 2014;77:38-53. [ Links ]
[22] Hasan Örkcü H. Subset selection in multiple linear regression models: A hybrid of genetic and simulated annealing algorithms. Applied Mathematics and Computation. 2013;219(3):11018-28. [ Links ]
