


Services on Demand
Journal
Article
 English (pdf)
 Article in xml format
 Article references
 Send this article by e-mail
Indicators
-
 Cited by SciELO
 -
 Access statistics
Related links
-
 Cited by Google
 -
 Similars in
SciELO
Similars in
SciELO -
 Similars in Google
Share

 Permalink
Revista ION
Print version ISSN 0120-100X
Rev. ion vol.29 no.1 Bucaramanga Jan./June 2016
https://doi.org/10.18273/revion.v29n1-2016010
DOI: http://dx.doi.org/10.18273/revion.v29n1-2016010
digestion process with cattle manure slurry using a low-cost method
María Soledad Alzate Moncada1*; Mabel Quintero Silva2
1 Escuela de Microbiología y Bioanálisis.
*malzatem@hotmail.com.
2 Escuela de Ingeniería Química, Universidad Industrial de Santander, Cra. 27 Calle 9, Bucaramanga, Colombia.
Fecha Recepción: 11 de diciembre de 2015
Fecha Aceptación: 10 de enero de 2016
This study identified and quantified microbial populations in cattle manure slurry, responsible for anaerobic degradation of kitchen waste using activity tests and Most Probable Number for key trophic groups in the process. Hydrolytic, acidogenic, acetogenic, specific methanogenic acetoclastic and hydrogenotrophic activities were evaluated using as model substrates starch, glucose, propionate-butyrate mix, acetate and formate, respectively. Anaerobic digestion from kitchen waste was developed for 35 days in batch reactors of 50mL containing an inoculums/substrate ratio of 3. Samples were taken from digesters every 7 days to evaluate microbial populations by counting metabolic groups. This study demonstrates that there is an association between biomass activity and population of trophic groups related. Additionally, CMS is an inoculum with high quality to start-up the anaerobic process with kitchen waste. On the other side, MA/FB ratio and MA/SRB ratio are important microbial parameters to evaluate performance of reactor. Finally, AD from kitchen waste reached a yield coefficient of 0.41m3CH4/kgVS using cattle manure sludge as inoculum.
Keywords: trophic groups, metabolic groups, kitchen waste, cattle manure slurry, MPN, microbial activities.
proceso de digestión anaerobia con lodo estiércol
bovino usando un método de bajo costo
Este estudio identificó y cuantificó poblaciones microbianas presentes en un lodo de estiércol bovino, responsables de la degradación anaerobia de residuos de cocina usando pruebas de actividad y Número Mas Probable para grupos tróficos clave del proceso. Las actividades hidrolítica, acidogénica, acetogénica, metanogénica acetoclástica y metanogénica hidrogenotrófica fueron evaluadas usando como sustratos modelo almidón, glucosa, una mezcla de propionato - butirato, acetato y formiato, respectivamente. La digestión anaerobia de residuos de cocina fue llevada a cabo durante 35 días en reactores batch de 50mL, conteniendo una relación inóculo sustrato de 3. Las muestras fueron tomadas de los digestores cada 7 días para evaluar las poblaciones microbianas por recuento de grupos metabólicos. Este estudio demuestra que hay una asociación entre la actividad de la biomasa y la población de los grupos tróficos relacionados. Adicionalmente, el lodo estiércol bovino es un inóculo con una alta calidad para iniciar el proceso de digestión anaerobia con residuos de cocina. Por otra parte, la relación MA/FB y MA/SRB son parámetros microbiológicos importantes para evaluar el desempeño del reactor. Finalmente, la digestión anaerobia de residuos de cocina, alcanzó un coeficiente de rendimiento de 0,41m3CH4/kgVS usando CMS como inóculo.
Palabras clave: grupos tróficos, grupos metabólicos, residuos de cocina, lodo estiércol bovino, MPN, actividades microbianas.
processo de digestão anaeróbia com lama esterco
bovino usando um método de baixo custo
Este estudo identificou e quantificou as populações microbianas presentes em uma lama de esterco bovino, responsáveis pela degradação anaeróbia de resíduos de cozinha por meio de testes de atividade e Número Mais Provável para os grupos tróficos chave do processo. Atividades hidrolítica, acidogênica, cetogênica, metanogênica específica acetoclastica e hidrogenotrófica foram avaliados utilizando substratos modelo como o amido, glucose, propionato-butirato misturado, acetato e formiato respectivamente. A digestão anaeróbica de resíduos de cozinha foi conseguida por 35 dias em reatores descontínuos de 50ml contendo uma relação de inoculo/substrato de 3. As amostras foram tomadas a partir de digestores cada 7 dias para avaliar as populações microbianas por contagem grupos metabólicos. Este estudo demonstra que há uma associação entre a atividade da biomassa e a população do grupo trófico relacionado. Além disso, CMS é um inoculo com alta qualidade para o arranque do processo anaeróbio com resíduos de cozinha. Por outro lado, a relação MA/FB e MA/SRB são parâmetros microbianos importantes para avaliar o desempenho do reator. Finalmente, AD a partir de resíduos de cozinha atingiu um coeficiente de rendimento de 0,41m3CH4/kgVS usando lama esterco bovino como inoculo.
Palabras-chave: grupos tróficos, grupos metabólicos, resíduos de cozinha, lama de esterco bovino, MPN, atividades microbianas.
Cita: Alzate Moncada MS, Quintero Silva M. Characterization of trophic groups throughout an anaerobic digestion process with cattle manure slurry using a low-cost method. rev.ion. 2016;29(1):117-23.
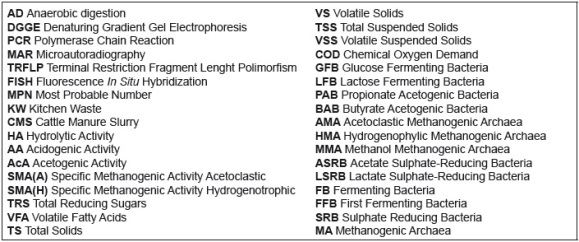
Anaerobic digestion -AD- is a very complex biochemical process developed by the symbiotic coexistence of microorganisms from Bacteria and Archaea domain. Trophic groups involved belong to three major physiological groups: hydrolytic-acidogenic bacteria, acetogenic bacteria, and methanogenic archaea [1]. Moreover, sulphate-reducing bacteria may compete with other metabolic groups for hydrogen, acetate and short-chain fatty acids to generate hydrogen sulphide and process may eventually fail [2]. AD microbial researches have been focused on genetic sequencing. Qualitative techniques such as DGGE, PCR, MAR, TRFLP are used to identify relative species present in microbial communities and their changes. FISH procedure makes possible to identify and quantify microorganisms at any taxonomical level. However, some samples have restrictions and the technique can be tedious, subjective, complex and expensive [3]. Additionally, quantifying trophic groups trough this technique is difficult because it is not based on physiological properties [4]. Microbial community quantification enables to estimate the quality of inoculum and affinity with a specific substrate. In addition, microbial trophic groups characterization allows attaining an adequate performance of anaerobic digester owing to well-balanced metabolic communities with high activity levels [5]. Bienestar Universitario's restaurant at Universidad Industrial de Santander in Bucaramanga (Colombia), attends a growing population of around 2000 students which leave about 200kg/day of cooked leftovers [6,7]. Due to energetic potential in biomass, this residue is intended to be used for biogas production with cattle manure slurry. The aim of this research was to identify and quantify active populations in cattle manure slurry, responsible for anaerobic degradation of kitchen waste using activity tests and Most Probable Number (MPN) methodology for key trophic groups.
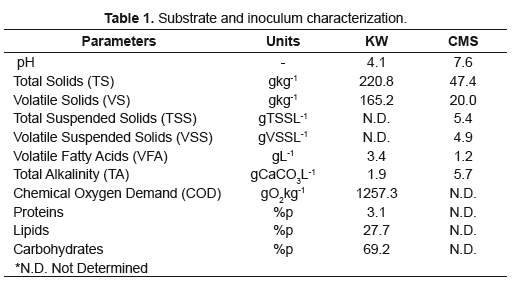
Substrate and inoculum
Kitchen Waste (KW) was collected from restaurant at Universidad Industrial de Santander. Cooked leftovers were sampled every day for four weeks and crushed to homogenize and reduce particle size. They were stored in a freezer to make two composite samples for characterization. Elemental composition of KW corresponds to the empirical formula C16H23O10N. Cattle manure slurry (CMS) used as inoculum was first obtained as fresh caw manure from urban slaughterhouse, collected and transported in anaerobic conditions to the laboratory. It was pre-incubated in a lab-reactor for 8 weeks to deplete organic material before its use (18L, room temperature, intermittent mixing every 30 minutes) and then a spot sample was analyzed. Physicochemical characterization (Table 1) was done according to Standard Methods procedures [8].
Specific activities
To evaluate the ability of the microbial population present in the inoculum to carry out different stages of AD activities were performed at mesophilic conditions. A basic medium was prepared to provide anaerobic conditions with reducing agents as cysteine and NaS2, a redox indicator, resazurin and macro/micronutrients and vitamins. Hydrolytic Activity (HA), Acidogenic Activity (AA), Acetogenic Activity (AcA) and Specific Methanogenic Activity (SMA) for acetotrophic and hydrogenotrophic groups were evaluated using model substrates: starch, glucose, propionate/butyrate, acetate and formate, respectively, at a concentration of 10gL-1. Assays were performed by triplicate at 39 ±2°C without agitation, in 500mL bottles for HA and AA and 50mL bottles for other activities. Inoculum was added at a concentration of 1.5gVSSL-1, for a working volume of about 2/3 of the bottles. Blanks with media and inoculum but no substrate were performed. Reactors were flushed with N2 for oxygen displacement and closed with butyl-rubber stoppers and metal caps [9-12].
As response variables were measured total reducing sugars (TRS) for HA by colorimetric method [13] and volatile fatty acids (VFA) for AA by titrimetric method [14] every 40 minutes for 16 hours and methane production daily by alkali displacement for other activities [12]. Average results were plotted to calculate each activity at the maximum slope of product formation, in gCODL-1d-1, as a function of the concentration of biomass used in gVSSL-1.
Microbial community determination
Relevant metabolic groups were evaluated in inoculum and along AD with KW. Digestion was achieved in batch reactors of 50mL containing an inoculum/substrate ratio of 3 (gVSinoculum/gVSsubstrate). AD was evaluated during 35 days at 39 ± 2°C with manual mixing once a day. Methane production was expressed in terms of specific methane potential at STP conditions (m3CH4/kgVSadded). Samples from digesters (1mL to dilute with reduced water) were taken initially and every 7 days to evaluate microbial populations by counting trophic groups. Glucose Fermenting Bacteria (GFB), Lactose Fermenting Bacteria (LFB), Propionate Acetogenic Bacteria (PAB), Butyrate Acetogenic Bacteria (BAB), Acetoclastic Methanogenic Archaea (AMA), Hydrogenophylic Methanogenic Archaea (HMA), Methanol Methanogenic Archaea (MMA), Acetate Sulphate-Reducing Bacteria (ASRB) and Lactate Sulphate-Reducing Bacteria (LSRB) were evaluated using bottles with 5mL of anaerobic basic medium with glucose, lactose, propionate, butyrate, acetate, H2CO2, methanol, acetate and lactate as substrate, respectively. Media contained same components detailed for activity tests and bottles were closed as well. Inoculum also was tested. To quantify trophic groups through MPN methodology, 5 replies of every dilution were sown on specific media, inoculating 0.2mL of 8 successive dilutions. Procedure was repeated for all metabolic groups. After specific incubation time (5-8 days FB, 7-15 days SRB, 15-45 days HMA, 30-60 days other groups), each group is observed to evidence growth by change in media (color green to yellow for FB, black precipitate for SRB and methane production for other groups). When some media did not evidence growth, the number of positive tubes for the last three dilutions was taken to make a three digit number to be found in McGrady's table to estimate the number of bacteria [12]. Then, the MPN of cells for each trophic group were estimated with Equation 1.

Microbial activity
HA was the highest activity, as seen in Table 2. Its value is higher than the results of Quintero et al. [15] for several inocula which values were between 0.006 y 0.068gCOD/gSSV.day using cellulose as substrate. Otherwise, it is among data reported by Regueiro et al. [5], between 0.61 and 2.18gCOD/gSSV.day for various inocula. Regarding to AA, value obtained is similar to those informed by Regueiro et al. [5], which are between 1.39 and 2.95gCOD/gSSV.day. Both activities are carried out by first fermenting bacteria -FFB- or hydrolytic-acidogenic bacteria, represented in this research by GFB and LFB. To develop HA, both groups are involved, explaining the highest value, since FFB have constitutive enzymes, amylases, to hydrolyze polymers such starch used as substrate [12]. In AA, owing to specific substrate, glucose, just GFB interview, then its value is lower. These data are well explained according to source of inoculum, as cellulose in diet of cattle must be hydrolyzed first and then converted to VFA prior to be assimilated.
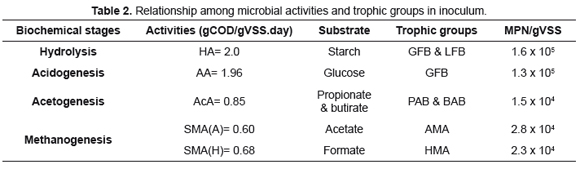
AcA follows in speed and it is 44% higher than information reported by Regueiro et al. [5] which were 0.1-0.48gCOD/gSSV.day but their substrate mix contained additionally acetate. Same mix was used by Torres et al. [16] who informed data between 0.001 y 0.42gCOD/gSSV.day for inocula studied. Syntrophic acetogenic bacteria -SAB- are the responsible group for this activity and in this research they are represented by BAB and PAB, which are populations with the smallest number of cells. However, the high activity could be explained by the fact that, additionally to acetate, SAB produces H2 and CO2, which are substrates for other trophic groups such as homoacetogenic bacteria and HMA which generate acetate and methane, respectively. Thus, from VFA mix used, two trophic groups may lead the formation of methane by several routes.
Finally, results for both SMA are last, but hydrogenotrophic is slightly higher than acetoclastic. The obtained value for SMA(H) is among ranges reported by Regueiro et al. [5] from 0.37 to 0.84gCOD/gSSV.day, but it is lower than the obtained by Sandoval et al. [10], of 0.94gCOD/gSSV.day. SMA using acetate as substrate, is amid data published by Díaz-Báez et al. [12] between 0.2 and 1.9gCOD/gSSV.day for granular sludge and biofilms. Opposing, it is higher than values reported by Quintero et al. [15] from 0.017 to 0.146gCOD/gSSV.day and Regueiro et al. [5], between 0.01 and 0.33gCOD/gSSV.day for various inocula in both researches. In contrast, it is lower than 2.39gCOD/gSSV.day obtained by Sandoval et al. [10].
Despite the larger population of AMA, SMA(A) is lower than hydrogenotrophic, due to the fact that in the first case, there is only one way to reduce the substrate, acetate, to methane, via acetoclastic. Otherwise, in SMA(H) the substrate, formate, is transformed to H2 and CO2 which may be converted into methane by HMA or to acetate by homoacetogenic bacteria and then to methane by AMA, what increases its yield.
CMS has a good quality for AD, according to the SMA obtained on acetate, which must be 0.1 and 0.3gCOD/gSSV.day, as minimum requirement for sludge and granular sludge, respectively [9].
Microbial dynamics throughout anaerobic digestion from KW
Trophic groups during digestion process:
A suitable balanced anaerobic microbial community is necessary to attain proper digestion performance. In Figure 1, results for microbial dynamics from CMS with KW in batch reactors are presented. Results show an increasing-decreasing dynamic for all the trophic groups studied. FFB (hydrolytic and acidogenic) rapidly increase their number at the beginning of the fermentation due to substrate availability but suddenly fall at day 14, when it is scarce but they recover again later. Even acetogenic bacteria (BAB and PAB) were the least abundant groups along the process they increased their population for first and second weeks, growing together with the FFB due to metabolism of products released from hydrolysis of polymers. Their growth was more stable than FFB and their changes along the process were slight, showing at the end of the process an increase of 40% PAB and 80% BAB.
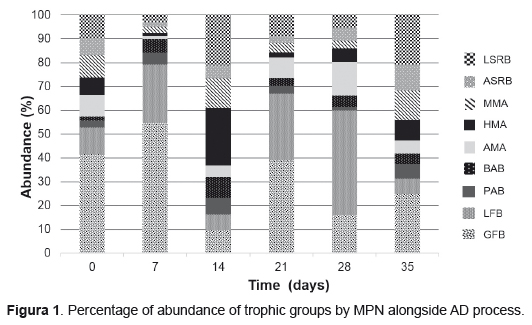
Otherwise, methanogenic archaea decreased their number the first week but increased when FFB diminished (day 14). The next two weeks these trophic groups augmented and reduced slightly and by the end of the process, methanogenic populations had fewer cells than at the beginning, MAM 7%, HMA 28% and AMA 57%. This behavior was compatible with the normal duplicating time for cells of trophic groups involved: 30 minutes for acidogenic bacteria, 1.5 to 4 days for acetogenic bacteria and 6 hours to 3 days methanogens [17]. Sulphate reducing bacteria dynamics showed to be similar to methanogens along the process, but at day 35 they recovered their population, increasing 45% LSRB and 14% ASRB.
Additionally, it was observed that the unbalanced populations on days 1 and 7, predominating FFB, became more even at the end of digestion process. Sequential up and down in populations reveal stability inside the reactor due to relationships established among trophic groups, showing a well balanced microbial population working together in a synergic way, according to substrates and products formed.
No similar researches to this were found to compare results. The only study counting trophic groups was done by Sandoval et al. [10], but they did it at 30, 60 and 90 days in two-stage AD using organic fraction of urban solid waste with sludge from wastewater treatment plant and sludge from an anaerobic reactor treating pig manure.
Prevalence of domains: Analyzing populations that carry out AD and clustered by domain, it was observed that Bacteria domain (first and secondary fermenting bacteria) was predominant over Archaea, except in day 14, in which methanogenic archaea increased their number to offset the decreasing bacteria populations. This dynamic was observed along the process so the total number of cells remained into the same magnitude number, as seen in Figure 2a. This same behavior was reported by some researchers using molecular tools to spot active populations from digesters, as Ito et al. [4] for glucose degraders along 48 hours of digestion, Regueiro et al. [5] in various inocula and Cardinali-Rezende et al. [18] from a pig manure lagoon.
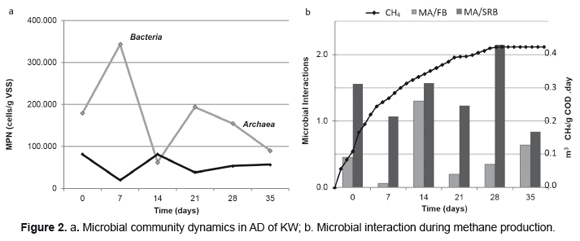
Incidence of synergism/antagonism on methane yield: Microbial interactions can be checked by methanogenic archaea (MA) fermentative bacteria (FB) ratio and MA sulphate reducing bacteria (SRB) ratio. As can be seen in figure 2b, the MA/FB demonstrates that despite the low number of MA, their enzymatic activity was enough for methane formation, reaching a yield of 0.41m3CH4/kgVS. Furthermore, MA/SRB shows that there was not inhibition due to substrate (acetate/lactate) competence. Both ratios remain around 1.0 due to similar quantity of cells (MPN) every week except for day 28 when number of methanogens doubled SRB.
Although SRB compete with various trophic groups for common substrates, data obtained along the process show a synergic behaviour resulting in a yield coefficient of 0.41m3CH4/kgVS. This might be due to the very low quantity of sulfurs in the substrate, which did not allow SRB to take the sulfate-reducing route and forced them to act like syntrophic acetogenic bacteria using VFA, especially propionate to generate acetate [19]. Hence, AD yield improved as a result of acetoclastic methanogenic pathway, which provides around 70% of methane in a reactor [1].
It was possible to quantify active trophic groups by a low-cost reliable methodology as MPN. This study highlights the parallelism between the number of microorganisms from each trophic group and the activities performed by them related to the steps in AD. Moreover, MA/FB ratio and MA/SRB ratio are important microbial parameters to evaluate performance of reactors. It provides an insight of population dynamics in CMS during AD with KW. CMS is an inoculum with high quality to startup an anaerobic process with KW. AD from kitchen waste reached a yield coefficient of 0.41m3CH4/kgVS using cattle manure sludge as inoculum. This biomass could be used in countries like Colombia where there are not enough reactors that supply inoculum in quantity and quality required. In fact, MPN is a low-cost technique for research in developing countries to evaluate diverse sources of inoculum.
[1] Angelidaki I, Karakashev D, Batstone D, Plugge C, Stams AJ. Biomethation and its potential. In: Methods in Enzymology. Editor: Rosenzweig y Ragsdale. Holanda: Elsevier Academic Press Inc; 2011. p. 327-51. [ Links ]
[2] Appels L, Baeyens J, Degreve J, Dewil R. Principles and potential of anaerobic digestion waste active sludge. PECS. 2008;34:755-81. [ Links ]
[3] Sanz J, Köchling T. Molecular biology techniques used in wastewater treatment: An overview. Process Biochem. 2007;42:119-33. [ Links ]
[4] Ito T, Yoshiguchi K, Ariesyady HD, Okabe S. Identification and quantification of key microbial trophic groups of methanogenic glucose degradation in an anaerobic digester sludge. Biores Technol. 2012;123;599-607. [ Links ]
[5] Regueiro L, Veiga P, Figueroa M, Alonso- Gutierrez J, Stams A, Lema JM, Carballa M. Relationship between microbial activity and microbial community structure in six full-scale anaerobic digesters. MR. 2012;167;581-9. [ Links ]
[6] Rodríguez Miranda, Nelson. Estudio de factibilidad técnica y financiera de utilizar biomasa para suplir las necesidades energéticas en el edificio de Bienestar Universitario (Tesis de pregrado). Bucaramanga, Colombia: Universidad Industrial de Santander; 2010. [ Links ]
[7] Álvarez E, Calderón D. Modelamiento del rendimiento de metano de los residuos sobrantes de restaurante UIS (Tesis de pregrado). Bucaramanga, Colombia: Universidad Industrial de Santander; 2012. [ Links ]
[8] APHA-AWWA-WPCF. Standard Methods for Examination of Water and Wastewater - SMEWW. 21th Ed. Washington D.C., U.S.A; 2005. [ Links ]
[9] Angelidaki I, Alves M, Bolzonella D, Borzacconi L, Campos JL, Guwy A J, et al. Defining the biomethane potential (BMP) of solid organic wastes and energy crops: a proposed protocol for batch assays. WST. 2009;59(5):927-34. [ Links ]
[10] Sandoval C, Vergara M, Carreño M, Castillo E. Microbiologic characterization and specific methanogenic activity of anaerobe sludge used in urban solid waste treatment. WM. 2009;29:704-11. [ Links ]
[11] Angelidaki I, Sanders W. Assessment of the anaerobic biodegradability of macropollutants. RESB. 2004;3:117-29. [ Links ]
[12] Díaz-Báez M, Espitia S, Molina F. Digestión Anaerobia: Una aproximación a la tecnología. Colombia: Universidad Nacional de Colombia; 2002. [ Links ]
[13] Miller G. Use of dinitrosalicylic acid reagent for determination of reducing sugar. AChemistry. 1959;31:426-8. [ Links ]
[14] Anderson G, Yang G. Determination of bicarbonate and total volatile acid concentration in anaerobic digesters using a simple titration. WER. 1992;64:53-9. [ Links ]
[15] Quintero M, Castro L, Ortiz C, Guzmán C, Escalante H. Enhancement of starting up anaerobic digestion of lignocellulosic substrate: fique's bagasse as an example. BT. 2012;108:8-13. [ Links ]
[16] Torres P, Pérez A, Cajigas A, Jurado C, Ortiz N. Selección de inóculos para el tratamiento anaerobio de aguas residuales del proceso de extracción de almidón de yuca. EIDENAR. 2007;6:105-11. [ Links ]
[17] Mussati M, Aguirre P, Scenna N. Modelado del proceso de digestión anaeróbica en reactores simples. En: Modelado, Simulación y Optimización de Procesos Químicos. Scenna NJ, Editor. Argentina: Editorial Universitaria de la UTN; 1999. p. 697-739. [ Links ]
[18] Cardinali-Rezende J, Pereira Z, Sanz J, Chartone-Souza E, Nascimento A. Bacterial and archaeal phylogenetic diversity associated with swine sludge from an anaerobic treatment lagoon. WJMBiotech. 2012;28:3187-95. [ Links ]
[19] Elferink S, Vorstman W, Sopjes A, Stams A. Characterization of the sulfate-reducing and syntrophic population in granular sludge from a full-scale anaerobic reactor treating paper mill wastewater. FEMS Microbiology Ecology. 1998;27:185-94. [ Links ]

