


 English (pdf)
 Article in xml format
 Article references
 Send this article by e-mail
 Cited by SciELO
  Cited by Google
  Similars in
SciELO
Similars in
SciELO  Similars in Google
 Permalink
Introduction
Urea (NH2-CO-NH2) is the most commonly used nitrogen fertilizer in the world, due to their low value and high nitrogen content 1,2. Urea has also many uses in chemical industries such as the manufacture of resins, medicines, cosmetics and cleaning products 1,2,3,4,5,6. Besides, it has great biological importance, since it is the final metabolite of nitrogenous compounds in mammals 1,3,5. The study of the solubility is important in the process of nucleation and crystallization 7,8,9,10,11,12. The solubility of urea is not fully explored and the process has not been studied over wide ranges of temperature and solvents 13-14.
Since ancient times, some natural and industrial processes require information of mixtures in equilibrium phases containing, or not, electrolytes. Some examples are: precipitation and crystallization processes; water desalination; control of water pollution; extraction and distillation; food processing, production of fertilizer among others 15.
Data regarding chemical compounds solubility in water and solvent mixtures are fundamental in designing of industrial separation equipment such as crystallizers, extractors, evaporators and absorption units.
The solubility of organic compounds in water is an important data in chemical, pharmaceutical, food industries, and environmental applications 16. The lack of experimental solubility data of solutes in solvents limits the development of predictive models 17.
The study of the water-organic phase behavior is essential in the design of separation process and operation of separation units in the chemical industry and in related industries 11. In many cases a complete equilibrium data is practically impossible due to the long time taken to get them and also by the high cost of analysis. Thus, models and parameters are obtained by a minimum number of experiments 18. Data on the solubility of urea in aqueous ethanol solution are essential for industrial design and further theoretical studies 10,11. In this paper, the solubility of urea in pure ethanol and in ethanol and water mixtures (0.0901; 0.2096 and 0.3757 of ethanol) at temperatures ranging from 278.2 to 333.2K was systematically measured by gravimetric method. The results were correlated using different equations available in the literature.
Materials
Urea with 99.5% (in mass) purity and ethanol with a purity of 99.8% (in mass) were purchased from Nuclear and Vetec, respectively. Deionized (E. J. Krieger & Cia. Ltd., model Permution) and distilled (Quimis, model G.341.25) water was used in the experiments. All chemicals were used without further purification.
Experimental apparatus
The solubility of urea was measured using an equilibrium cell similar to that reported in the literature 10,11,12,13,14. The solubility of urea was determined in a temperature range from 278.2 to 333.2K at atmospheric pressure (92654.3Pa), in pure ethanol and mixtures of water and ethanol with ethanol mole fractions of 0.0901, 0.2096 and 0.3757, in a previously prepared solution using analytical balance (Gehaka, AY-220± 0.0001g). A jacketed borosilicate glass cell with capacity of
40.0mL and with sampling points at the side was used in this work. Urea was added in excess to the solution, which was stirred for two hours using a magnetic stirrer (Marconi, MA-089).
Subsequently, the system was left decanting for two hours, keeping the temperature control of the cell through a thermostatic bath (Marconi, MA-184). A thermocouple (Full-Gauge, TIC-17RGTi ± 0.1K), which was calibrated using an Incoterm standard thermometer (± 0.1K), was used to measure the temperature inside the cell. The experimental apparatus can be seen in Figure 1.
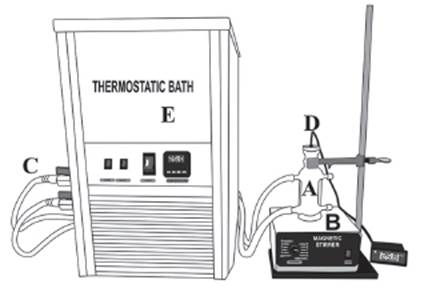
Figure 1 The experimental apparatus: (A) Equilibrium cell; (B) Magnetic stirrer; (C) Latex hose; (D) Thermocouple; (E) Thermostatic bath.
For each temperature, four samples were drawn using a glass syringe (10mL, Artiglass) to check the reproducibility of the procedure. The samples were quantified by gravimetric analysis, remaining 48h in a stove (Medicate, MD-1.3) at 338.2K.
After the drying period, the samples containing crystallized urea was placed in a desiccator with silica for 30min, then the molar fraction of dry urea was quantified to determinate the value of solubility. Four solubility values ( xexp ) were determined for each temperature. Afterwards, the average of those four measurements was computed. Equation 1 was used to calculate the mole fraction solubility 10:

where m1, m2 and m3 represent the mass of the solute (urea), solvent (water, ethanol) and ethanol only, respectively. M 1, M 2 and M 3 are the respective molecular weights.
Results and Discussion
Experimental data
Table 1 contains solubility data experimentally obtained for the urea in a mixture of ethanol and water with ethanol mole fraction of 0.0901; 0.2096 and 0.3757 and in pure ethanol. This table also reports standard deviations (δ) of the value of solubility for each temperature and shows data available in the Lee and Lahti’s 13 work for urea in ethanol and water mixtures in compositions of 0.1242 and 0.3095 (mole fraction) and in pure ethanol. These results were used for comparison and validation of the data found on this paper.
Table 1 Experimental solubility of urea in ethanol-water mixtures and in pure ethanol at different temperatures along with the solubility of urea in Lee and Lahti 13.
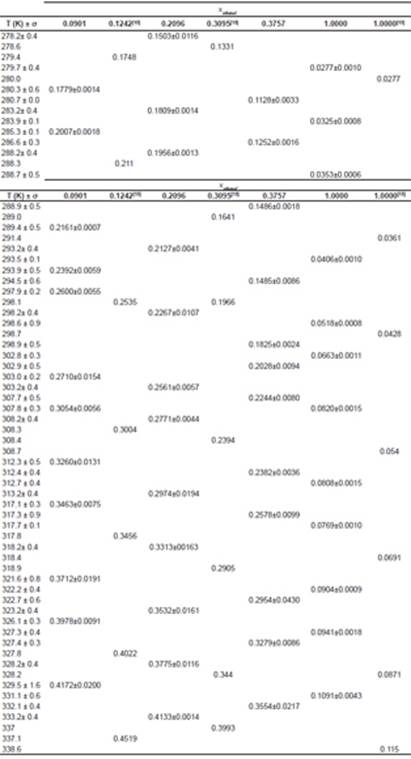
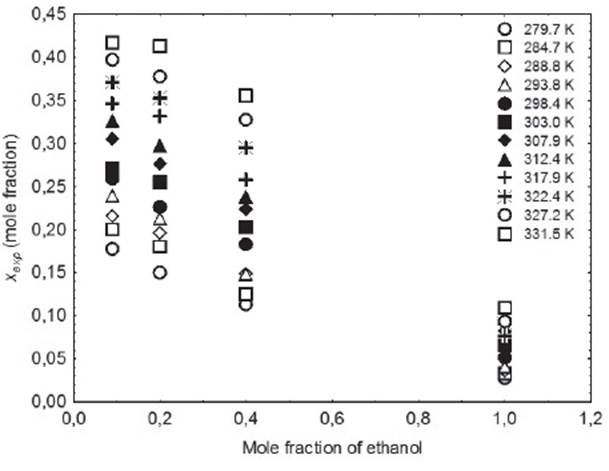
It is noticeable that the solubility of urea in a mixture of ethanol and water increases with increasing temperature and decreases with increasing ethanol concentration to the mixture. The fact that the solubility decreases with decreasing temperature at low pressures is attributed to the reduction in density 19. Figure 2 shows the decrease in solubility of urea with increasing mole fraction of ethanol in the solution.
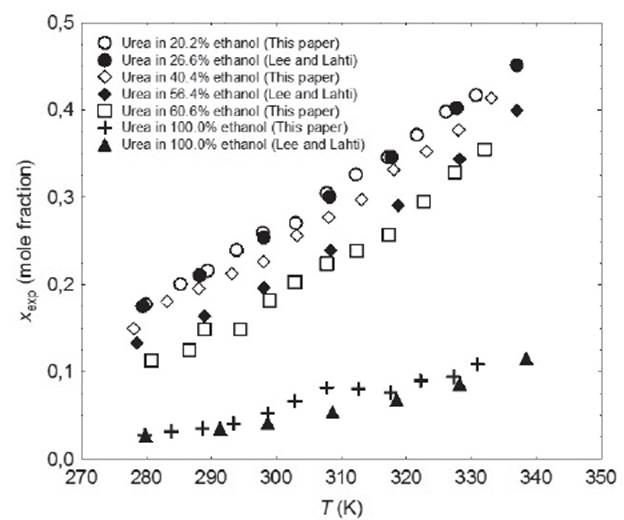
We can also observe that the standard deviation was low in all cases (about 4.7%). Figure 3 shows solubility data for urea in mixture of ethanol and water obtained in this study, along with the data of Lee and Lahti 13. Comparing the data obtained in this study with the data provided by literature, the results were consistent.
Adjustments of solubility
Literature (13, 20, 21, 22) reports several equations or models to correlate solubility data. In this paper, we can cite the useful correlations proposed by Lee and Lahti 13, Yaws et al.20, Buchowski et al.22. The solubility of urea in mixture of solvents was correlated by Eqs. (2), (3) and (4).
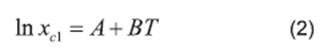
where xc1 represents the solubility calculated using the Lee and Lahti equation; A and B represent the parameters of the equation and T represents the temperature measured in Kelvin.

where xc2 represents the solubility calculated using the Yaws equation; A’, B’ and C’ represent the parameters of the equation and T represents the temperature measured in Kelvin.
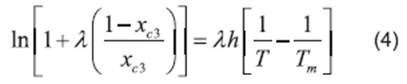
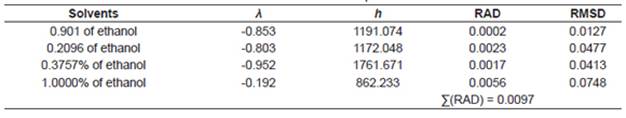
where x c3 is the solubility of urea calculated using the Buschowski equation; λ and h are the model parameters, T and Tm are the experimental and the standard melting point of urea in Kelvin, respectively.
The correlations of experimental data and data calculated using the thermodynamic models obtained from the relative deviation (RD) expressed by Equation 5 are listed in Table 2. The parameters of models obtained from linear and nonlinear regressions and their values are listed in Tables 3−4. The relative average deviation (RAD) and the corresponding root mean square deviation (RMSD) along with the R2 as expressed by eqs 5, 6, 7 are shown in Tables 3−5.
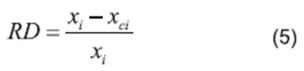


Table 2 shows the experimental and calculated results of solubility for urea in ethanol+water and in pure ethanol using the Equations 2 - 4. It is important to comment that to calculate the values in Table 2 it was follow the same experimental temperatures showed in Table 1.
According to the above-mentioned correlations of experimental data obtained at different temperatures in various mixtures of ethanol and water and in pure ethanol together with the calculated data (Tables 2−5), it was indicated that the solubility of urea calculated from the studied models showed good agreement. Taking the solubility data in the selected solvents fitted by the Yaws et al. model as an illustration, the relative average deviations are 0.01%, 0.06%, 0.16%, and 0.62%, respectively; which indicate that the modified Yaws et al. equation is suitable for correlating the solubility data of urea in the mixtures of ethanol and water and in pure ethanol. The same conclusion can be drawn after analyzing the solubility data and the parameters that fitted by the Lee and Lahti equation and the Buchowski λh equation.
However, we can see that the RAD values of Lee and Lahti equation, the Yaws et al. equation and the Buchowski−Ksiazaczak λh equation are 4.84%, 0.86%, and 0.97%.
This result indicates that the Yaws et al. model proved to be more accurate and suitable for the description of dissolution of urea in the studied solvents at various temperatures.
Figure 4 shows the solubility of urea in a mixture of ethanol and water and in pure ethanol correlated with Equation (3). Analyzing Figure 4, it can be noted that the equation proposed by Yaws et al. (Equation 3) correlates the solubility of urea data well.
Table 2 Experimental and calculated (Eq. 2 - 4) solubility of urea in pure ethanol and ethanol+water mixtures.
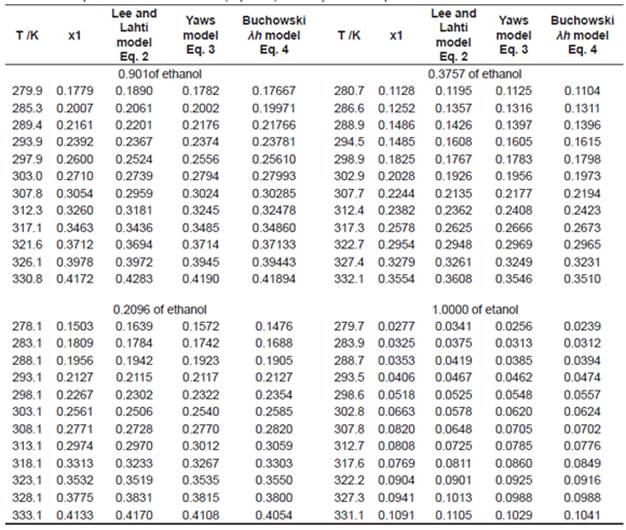
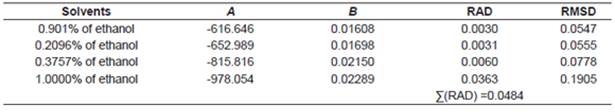
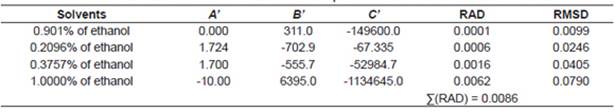
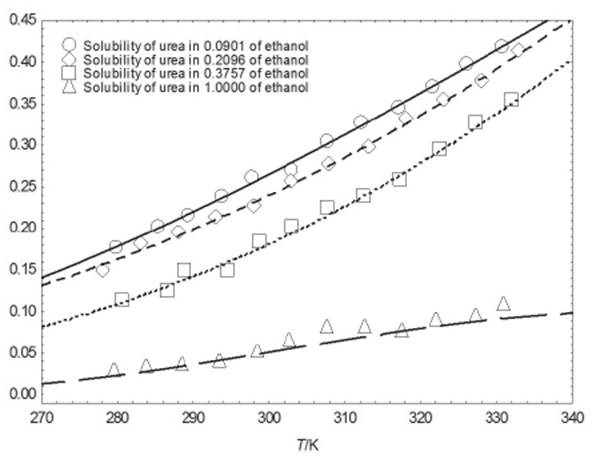
Figure 4 Mole fraction solubility of urea: (○), 20.2% ethanol; (□), 40.4% ethanol; (◊), 60.6% ethanol; (▲), 100% ethanol; (-) correlated data with Equation (3)
Conclusion
The solubility of urea in ethanol-water mixtures and in pure ethanol within the temperature range 278.1 to 333.1K was measured. The authors got the following conclusions: (1) The solubility of urea increased when temperature increased. (2) The addition of ethanol in the mixture resulted in a decreasing of urea solubility which can be verified by analyzing the experimental data of this paper and the literature data. (3) The solubility phenomena of urea were evaluated using the thermodynamics models. The data calculated from the Yaws et al. model was in good agreement with the experiment. This model was the most suitable for the description of the dissolution of urea.
Also, the experimental apparatus proved to be efficient in determining the data solubility using the gravimetric method, since the standard deviations of the samples were low.
The solubility data obtained in this paper is important because it may also contribute to other scientific research, since there are references where the solubility of urea in solution and it behavior influence and modify the system under study.
List of symbols
A Parameter of Equation 2
A’ Parameter of Equation 3
B Parameter of Equation 2
B’ Parameter of Equation 2
C’ Parameter of Equation 3
h Parameter of Equation 4
λ Parameter of Equation 4
mi Mass
Mi Molecular weight
N Number of experiments in Equation 6
T Temperature (K)
xexp Experimental urea solubility (mole fraction)
xc1 Calculated solubility using Equation 2
xc2 Calculated solubility using Equation 3
xc3 Calculated solubility using Equation 4
Δ Standard deviation

