


 texto en
  Inglés (pdf)
 Articulo en XML
 Referencias del artículo
 Enviar articulo por email
 Citado por SciELO
  Citado por Google
  Similares en
SciELO
Similares en
SciELO  Similares en Google
 Permalink
Introduction
Nutritional status assessment evaluates an individual's body composition and compares it with reference parameters to determine the respective diagnosis and nutritional requirements. Likewise, it helps monitor therapeutic interventions, evaluate the efficacy of nutritional treatment, and identify hospitalized patients with a higher risk of complications associated with malnutrition 1,2.
Anthropometry indirectly evaluates protein reserves and body fat; the classical parameters like body weight, skin fold measurements and circumferences like those of the arm, waist and calf indicate the degree of malnutrition, but abnormalities in these parameters only appear after a prolonged deficit in energy and nutrient intake 3.
Like all skeletal muscles, the thumb adductor muscle (TAM), located at the first commissure of the hand, is depleted during catabolism and atrophies due to inactivity, causing decreased contraction strength and increased muscle fatigue 3.
In recent years, TAM thickness (TAMT) measurement has positioned itself as a new technique for evaluating muscle mass and predicting complications in hospitalized patients, as it is noninvasive, quick, and inexpensive 4-8.
At the same time, technological innovation has led to the development of several sophisticated devices to directly analyze body composition, such as the bioelectrical impedance method, which uses the resistance of cells, tissues or body fluids to electrical current flow to estimate the quantity of body water, fat mass (FM) and fat-free mass (FFM) 9.
Another complementary method is muscle strength (MS) measurement using dynamometry or the digito-palmar grasp test, as it is inexpensive, simple and quick. This test was described by Klidjian et al.10 and consists of applying the maximum voluntary hand grasp pressure to estimate skeletal muscle function. In addition, it identifies individuals with a higher risk of developing complications related to malnutrition 11,12.
Based on the above, and after carrying out a search of Colombian TAM studies, with no prior studies found, we decided to conduct this pioneer study in our country, with the objective of determining the relationship between TAMT, FFM and MS in hospitalized adults at Hospital Universitario Nacional de Colombia (HUN).
Materials and methods
Study design
This was an observational, cross-sectional, analytical study to find the association between TAMT, FFM and MS using dynamometry in hospitalized adults. The population included 157 patients hospitalized at HUN, in Bogotá, who met the following criteria: Colombians by birth, 18 years old or older, able to stand without support, with physical and cognitive ability, who voluntarily agreed to participate and in whom measurements could be taken in both hands, with no inflammatory or degenerative disorders. The patients were selected through convenience sampling during the first semester of 2018 and the first semester of 2019, using the daily patient census. The inclusion criteria were verified prior to conducting the respective interviews.
Variables and instruments
A survey was applied which included socioeconomic and clinical variables like sex, date of birth, age, level of physical activity, main disease and admitting service. Other variables considered included TAMT, other anthropometric measurements (height, wrist circumference [wrist c.], build, current weight, usual weight, percent weight change, body mass index [BMI], BMI classification, arm circumference [AC], waist circumference [waist c.], triceps skinfold [TSF] and arm muscle circumference [AMC] for those under 60 years old; in those over 60, calf circumference [CC] was included, along with body composition variables [FM, total body water (TBW), FFM, bone mass (b. mass] and visceral fat (v. fat)] and MS using dynamometry. The following equipment was used: a Harpenden skinfold caliper, a Lufkin W606PM measuring tape, a Tanita BC 585F scale and a Takei Physical Fitness Test Model 68812 dynamometer.
Data collection
A pilot study was conducted to adjust the instrument. The TAMT measurement technique was established by Lameu et al.13; the rest of the anthropometric measurements were performed according to the techniques standardized by Lohman 14. Muscle strength by dynamometry was measured according to Klidjian et al.'s protocol 15. Then the information was analyzed, and the corresponding nutritional diagnosis was rendered.
Ethical considerations
The study was approved by the Ethics Committees of the Universidad Nacional de Colombia School of Medicine and HUN. Before conducting the survey, the participants signed informed consent. The "Scientific, Technical and Administrative Norms for Health Research" established in Ministry of Health Resolution No. 008430 from 1993 and Resolution 2378 from June 27, 2008, were adhered to; this was a minimal risk study.
Statistical analysis
Measures of central tendency (minimums, maximums, means and medians) and dispersion (standard deviation) were calculated for all quantitative variables. Absolute and relative frequencies were analyzed for qualitative variables. A correlation analysis was conducted using Pearson's correlation coefficients for paired quantitative variables and Spearman's correlation coefficient between qualitative and quantitative variables. The ROC curves were used to determine the TAMT cut-off points in the hand (dominant/ non-dominant), and multiple and logistic regressions were run to evaluate the relationship between TAMT as a predictor of FFM and malnutrition, as well as age as a predictor of TAMT. The level of significance used for evaluating the hypothesis of correlations other than zero was 10%. Statistical analysis was done using R free software.
Results
A total of 157 patients were studied, 61% men and 39% women; the average age was 63.3±17.0 years, with a minimum of 21 and a maximum of 94 years; 75% were over 60 years old. Most reported moderate activity (51%), followed by mild activity (43%), and a smaller proportion had intense activity (6%). Altogether, 48% were followed by internal medicine, 27% by surgery and 25% by other specialties.
Table 1 presents the overall results of the anthropometric and demographic variables. Table 2 shows a significant difference between males and females when comparing the dominant hand TAMT (DTAMT) with that of the non-dominant hand (nDTAMT). The variables which showed no significant difference between men and women, and which could be considered statistically equal for both groups, were age, BMI, AC (AMC - did have significant differences between groups), waist c. and CC.
Table 1 Anthropometric and demographic data of the study population.
| Variable | Minimum | Mean | Median | Maximum | S. Dev. |
|---|---|---|---|---|---|
| Age (years) | 21.0 | 63.3 | 66.0 | 94.0 | 17.0 |
| DTAMT (mm) | 5.2 | 17.0 | 17.3 | 27.1 | 3.7 |
| nDTAMT (mm) | 4.9 | 16.0 | 16.3 | 25.2 | 3.5 |
| Height (cm) | 139.0 | 163.2 | 163.0 | 187.0 | 9.3 |
| Wrist c. (cm) | 13.6 | 16.0 | 16.0 | 18.5 | 1.1 |
| Current weight | 36.9 | 69.3 | 68.5 | 104.7 | 13.0 |
| (kg) | |||||
| Usual weight (kg) | 42.0 | 71.6 | 70.0 | 110.0 | 13.3 |
| BMI (kg/m2) | 17.4 | 26.0 | 25.8 | 41.6 | 4.1 |
| AC (cm) | 20.5 | 29.0 | 28.8 | 38.0 | 3.6 |
| TSF (mm) | 5.0 | 15.2 | 13.9 | 40.0 | 7.8 |
| AMC (cm) | 18.8 | 26.4 | 25.8 | 33.8 | 3.2 |
| Waist c. (cm) | 74.0 | 97.9 | 97.1 | 136.0 | 10.6 |
| CC (cm) | 26.2 | 34.4 | 34.5 | 45.1 | 3.3 |
| FM (%) | 10.2 | 29.4 | 28.0 | 52.2 | 9.6 |
| TBW (%) | 34.7 | 49.1 | 49.5 | 63.9 | 6.6 |
| FFM (kg) | 28.4 | 46.2 | 46.4 | 68.0 | 8.6 |
| B. mass (kg) | 1.5 | 2.5 | 2.5 | 3.5 | 0.4 |
| V. fat (kg) | 1.0 | 11.5 | 12.0 | 31.0 | 4.7 |
| MS (kg) | 2.0 | 20.8 | 20.5 | 43.0 | 9.0 |
Given that most of the variables were significantly equal, as seen in Table 2, the significant differences between men over and under the age of 60 and women over and under the age of 60 were also reviewed. The results are presented in Table 3. We clarify that the TSF and AMC variables were not measured in those over the age of 60 and CC was not measured in those under 60, and therefore they were not included in the comparisons. From this table, we can conclude that there was a significant difference between those over and under the age of 60 for both sexes in height, current weight, usual weight, AC, FFM, b. mass and v. fat.
Table 2 Variable averages by sex.
| Variable | Males | Females | t-test p-value | ||
|---|---|---|---|---|---|
| Mean | S. Dev. | Mean | S. Dev. | ||
| Age (years) | 61.8 | 17.9 | 65.9 | 15.2 | 0.13 (n.s.) |
| DTAMT (mm) | 18.0 | 3.4 | 15.3 | 3.6 | 0.00* |
| nDTAMT (mm) | 17.0 | 3.3 | 14.5 | 3.4 | 0.00* |
| Height (cm) | 168.3 | 7.2 | 155.2 | 6.2 | 0.00* |
| Wrist c. (cm) | 16.5 | 0.9 | 15.4 | 1.0 | 0.00* |
| Current weight (kg) | 72.6 | 12.4 | 64.1 | 12.2 | 0.00* |
| Usual weight (kg) | |||||
| BMI (kg/m2) | 75.0 | 12.5 | 66.1 | 12.8 | 0.00* |
| AC (cm) | 25.7 | 3.7 | 26.5 | 4.5 | 0.23 (n.s.) |
| TSF (mm) | 29.1 | 3.3 | 28.9 | 3.9 | 0.86 (n.s.) |
| AMC (cm) | 12.4 | 5.2 | 24.7 | 7.7 | 0.00* |
| Waist c. (cm) | 27.1 | 3.2 | 23.8 | 1.6 | 0.00* |
| CC (cm) | 98.7 | 11.2 | 96.5 | 9.3 | 0.22 (n.s.) |
| FM (%) | 34.7 | 2.9 | 34.0 | 3.8 | 0.26 (n.s.) |
| TBW (%) | 24.8 | 7.9 | 36.5 | 7.5 | 0.00* |
| FFM (kg) | 52.7 | 4.7 | 43.5 | 4.9 | 0.00* |
| B. mass (kg) | 51.4 | 6.1 | 38.0 | 4.9 | 0.00* |
| V. fat (kg) | 2.7 | 0.3 | 2.0 | 0.3 | 0.00* |
| MS (kg) | 12.9 | 5.1 | 9.4 | 2.8 | 0.00* |
| FM (kg) | 25.1 | 8.0 | 13.9 | 5.5 | 0.00* |
|
| |||||
Table 3 Variables differentiated between those under and over the age of 60, by sex.
| Variable | Males | Females | ||||||||
|---|---|---|---|---|---|---|---|---|---|---|
| Mean <60 | S. Dev. | Mean >60 | S. Dev. | p-value | Mean <60 | S. Dev. | Mean >60 | S. Dev. | p-value | |
| DTAMT (mm) | 18.6 | 3.5 | 17.7 | 3.3 | 0.25(n.s.) | 16.2 | 15.1 | 3.9 | 0.13(n.s.) | |
| nDTAMT (mm) | 17.3 | 3.2 | 16.8 | 3.3 | 0.46(n.s.) | 15.6 | 1.6 | 14.3 | 3.6 | 0.09* |
| Height (cm) | 172.7 | 7.2 | 166.2 | 6.2 | 0.00* | 159.8 | 5.9 | 154.4 | 5.9 | 0.03* |
| Wrist c. (cm) | 16.5 | 1.1 | 16.5 | 0.8 | 0.75(n.s.) | 15.7 | 1.2 | 15.3 | 0.9 | 0.32(n.s.) |
| Current weight (kg) | 76.5 | 12.2 | 70.7 | 12.1 | 0.03* | 70.2 | 10.4 | 63.0 | 12.3 | 0.08* |
| Usual weight (kg) | 79.1 | 12.4 | 73.1 | 12.1 | 0.02* | 73.8 | 12.8 | 64.7 | 12.4 | 0.08* |
| BMI (kg/m2) | 25.6 | 4.1 | 25.7 | 3.6 | 0.94(n.s.) | 27.6 | 4.3 | 26.4 | 4.6 | 0.45(n.s.) |
| AC (cm) | 31.0 | 4.0 | 28.1 | 2.5 | 0.00* | 31.6 | 2.9 | 28.5 | 3.9 | 0.02* |
| Waist c. (cm) | 96.0 | 13.3 | 100.0 | 10.0 | 0.19(n.s.) | 96.6 | 12.0 | 96.5 | 8.9 | 0.98(n.s.) |
| FM (%) | 23.7 | 8.4 | 25.4 | 7.7 | 0.37(n.s.) | 36.5 | 6.9 | 36.5 | 7.6 | 0.99(n.s.) |
| Water (%) | 54.0 | 4.7 | 52.1 | 4.6 | 0.07* | 45.6 | 5.8 | 43.1 | 4.7 | 0.25(n.s.) |
| FFM (kg) | 54.7 | 6.0 | 49.8 | 5.5 | 0.00* | 41.7 | 4.8 | 37.4 | 4.6 | 0.03* |
| B. mass (kg) | 2.9 | 0.3 | 2.7 | 0.3 | 0.00* | 2.2 | 0.2 | 2.0 | 0.2 | 0.02* |
| V. fat (kg) | 8.9 | 4.7 | 14.8 | 4.2 | 0.00* | 6.1 | 3.3 | 9.9 | 2.3 | 0.01* |
| MS (kg) | 27.7 | 8.1 | 23.9 | 7.7 | 0.03* | 15.3 | 8.7 | 13.7 | 4.9 | 0.64(n.s.) |
|
| ||||||||||
There was a significant difference between men under and over 60 for TBW and MS, but not for women. On the other hand, there was a significant difference between women under and over the age of 60 for nDTAMT.
Regarding weight, only 5% had maintained their usual weight, 26% had gained weight and most of the patients (69%) had lost weight in the previous month, with a mainly moderate weight loss. When BMI was evaluated, 49% of the patients were found to have a normal weight for height, 40% had excess weight (26% preobesity, 12% Class 1 obesity, and 2% Class 2 obesity) and 11% had some degree of deficit.
Regarding body circumferences, waist c. was greater in men, and in people over the age of 60, only 14% had a waist c. within the normal range. The TSF was greater in females and AMC was greater in males. Calf circumference was normal in 88%, and smaller in females.
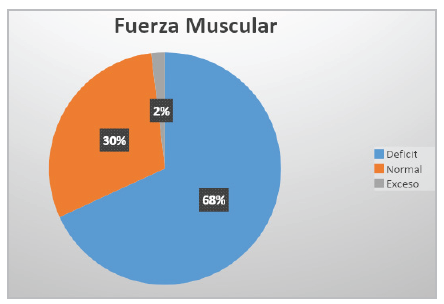
For body composition, FM, level of v. fat and FFM were evaluated; FM was higher in those over 60; likewise, v. fat was evaluated, finding that 36% of the individuals had excess fat; for FFM, the value was higher in men and people under the age of 60. For MS, 68% of the patients had a deficit, and it was lower in women and people over the age of 60 (Figure 1).
The following significant positive correlations were found in the overall population: waist c. and v. fat (r = 0.70); waist c. and BMI (r = 0.75); v. fat and BMI (r = 0.55); v. fat and current weight (r = 0.51); and MS and current weight (r = 0.46). In those under 60, the following significant positive correlations were found: BMI and TSF (r = 0.68); AMC and current weight (r = 0.65); AMC and FFM (r = 0.59); waist c. and TSF (r = 0.47); MS and AMC (r = 0.42); TSF and FM (r = 0.80); waist c. and FM (r = 0.75); current weight and FM (r = 0.49); and BMI and FM (r = 0.80). In those over the age of 60, the following significant positive correlations were found: CC and current weight (r = 0.76); BMI and CC (r = 0.70); AC and CC (r = 0.66); and CC and FFM (r = 0.55).
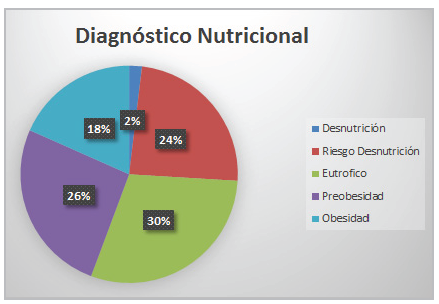
After global analysis of the different measurements and diagnosis of the nutritional status, the majority of the patients (44%) were found to have malnutrition due to excess (preobesity and obesity) (Figure 2). A significant positive correlation was found between DTAMT and nDTAMT (r = 0.93). It should be mentioned that, in the group under age 60, a significant positive correlation was also found between these two measurements (r = 0.90). For the analysis, our study took DTAMT as the reference, which corresponded to 17±3.7 mm and 16±3.5 mm in the non-dominant hand. In men, the average value was 18±3.4 mm, greater than in women, at 15.3±3.6 mm. In the non-dominant hand, an average of 17±3.3 mm was found in men, which surpassed that of women, with an average of 14.5±3.4 mm.
Regarding the comparative DTAMT by age groups, those under 60 had a higher average than those over 60. Lower values were obtained for nDTAMT, with the same behavior between those under and over the age of 60. Table 4 differentiates the TAMT values disaggregated by sex and age group.
Table 4 Average TAMT values by sex and age group.
| Males | Females | |||
|---|---|---|---|---|
| Age (years) <60 (n=31) | >=60 (n=65) | <60 (n=9) | >=60 (n=52) | |
| DTAMT (mm) | 18.6 ± 3.5 | 17.7 ± 3.3 | 16.2 ± 1.4 | 15.1 ± 3.4 |
| nDTAMT (mm) 17.3 ± 3.2 | 16.8 ± 3.3 | 15.3 ± 1.6 | 14.3 ± 3.6 | |
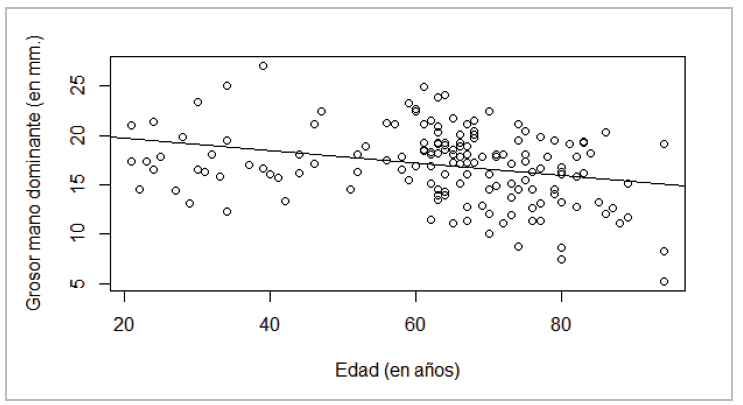
To evaluate the age-related reduction in DTAMT, a regression analysis was run between the two variables. Figure 3 shows a negative association, which implies a reduction in the thickness of this muscle as age increases. This regression model produces a line with the equation DTAMT=21-0.06*age, which would imply a 0.06-millimeter thickness reduction per year, with a significant intercept and slope. However, this model>s R2 value is only 8%, which implies that age only explains 8% of the variability and cannot be considered a sufficient predictor for TAMT.
An evaluation of the reduction before and after age 60 showed different behaviors. When the model is run for only those under the age of 60, it results in DTAMT=17.09+0.02*age, with age not significant (also with an R2=0.01, which means that the reduction is not significant before age 60), while for those over 60 the model obtained is DTAMT=29.8-0.18*Age (R2=0.17), which indicates that thickness reduction is more significant and drastic in those over 60, with reductions of 0.18 millimeters per year. Figure 4 shows a drastic reduction in those over 60, with a statistically different slope than that of those under 60.
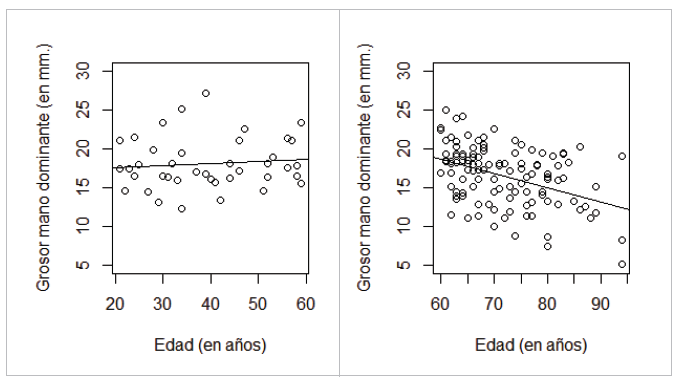
Figure 4 Line-adjusted dispersion of TAMT vs. age. (a) On the left, those under 60; (b) On the right, those over 60.
The ROC curve 16 constructed in Figure 5 detects moderate and severe malnutrition with an area under the curve of 0.9177, which is the probability of correctly classifying individuals in the Malnutrition/No malnutrition groups, using their TAMT as the classifier. Each point on the ROC curve corresponds to a possible cut-off point of the diagnostic test and reports its respective sensitivity (Y axis, approximately 90% rate of true malnutrition) and 1-specificity (X axis, approximately 20% rate of false malnutrition). According to the cut-off point set by the curve, people with a DTAMT under 13.4 mm are considered malnourished.
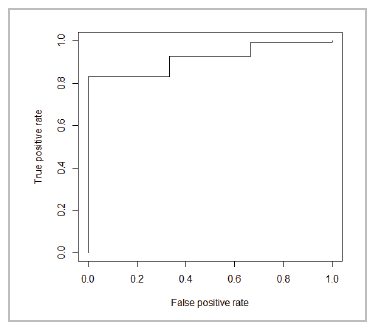
When the exercise was repeated in a separate analysis by sex, the cut-off point for men was 14.5 mm (16.2 mm for those under 60 and 14.5 mm for those over 60). For women, the cut-off point was 12.8 mm (11.9 mm for those over 60; a cut-off point could not be established for women under 60, as all the patients in this age group had malnutrition).
In addition, a multivariate logistic analysis was performed to determine the strength of association between the independent variables and the probability of not being malnourished. After eliminating all the variables which caused multicollinearity (redundant information due to correlations between the variables), the best fit was achieved with the following model: Prob(No malnutrition)=14.19 -2.25*Sex+0.16*DTAMT-0.29*TBW. For this model, all the coefficients are statistically significant with an R2=0.20.
This shows that the higher the DTAMT the lower the probability of malnutrition; women have a higher likelihood of malnutrition.
Similar to Bielemann's 17 analysis, the relationship between TAMT and FFM was studied. After verifying that the variable of sex was statistically significant, two regression analyses were run: one for men and the other for women. Significant differences were found between the groups as well as a directly proportional positive association between the two variables (r = 0.45). Drawing the regression line in two different models according to sex gives the result shown in Figure 6.
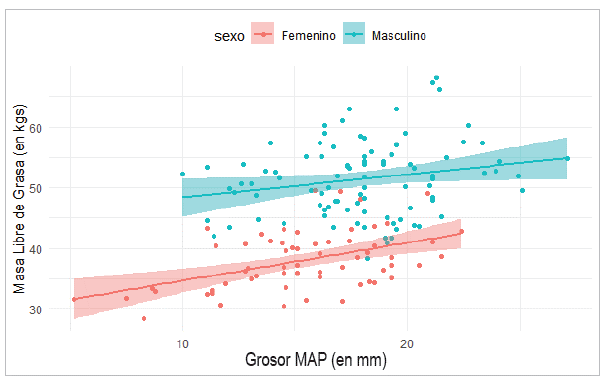
The confidence intervals between the two line adjustments do not overlap, showing significant differences between men and women. The equation for the men's line is FFM= 44.59+ 0.379*DTAMT (R2=0.04), with both coefficients statistically different from zero, while the women's line is FFM = 28.44+0.63*DTAMT (R2 = 0.22), with both coefficients also being significant. The low R2 values in both samples show that DTAMT, although significant, is not a sufficient predictor of FFM.
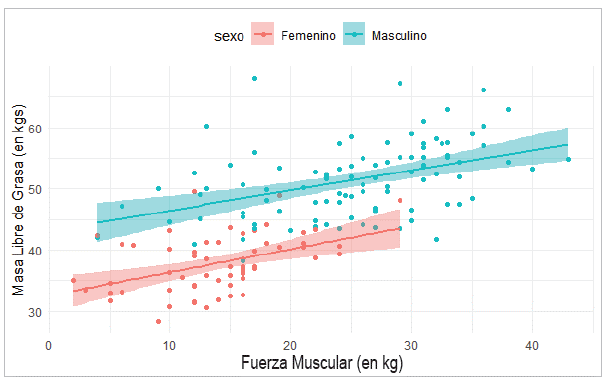
Correlating FFM and MS shows a directly proportional significant positive correlation in the total sample (r = 0.69). When this correlation was evaluated in men, the still-significant value reduced (r = 0.43), while in women it rose slightly (r = 0.45) and was also significant. The differentiation by age groups was also significant in those under 60 (r = 0.58) and over 60 (r = 0.68). Figure 7 shows the relationship between MS and FFM, in which significant differences between men and women are seen, as the confidence intervals of both regression models do not overlap. The equation for the men's line is FFM= 43.17+0.32*MS (R2=0.19), with both coefficients statistically different from zero; while the women's line is FFM = 32.56+0.37*MS (R2=0.20), with both coefficients also being significant.
The low R2 values in both samples show that MS, while significant, is not sufficient as a predictive variable for FFM. A more complete model for men, including other explanatory variables for FFM was obtained with FFM = -51.12+0.39*height+1.02*CC, with both variables being significant. The DTAMT thickness is excluded as a significant variable, and with an explanation of variability (R2=0.66). For women, the same variables are significant, obtaining the simplest model as follows: FFM = -35.45+0.29*height+0.82*CC, with an R2=0.79. This model can be validated in future studies.
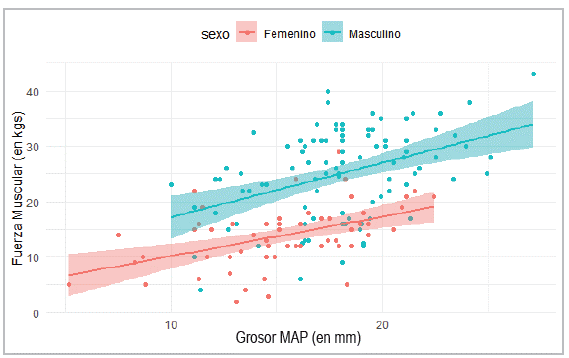
A significant positive correlation was found between DTAMT and MS (r = 0.53), with differences between men and women. After verifying that the variable of sex was statistically significant in the model, the two regression analyses were run: one for men and the other for women. Figure 8 shows the relationship between DTAMT and MS for men and women. The equation for the men's line is MS =7.38+0.98*DTAMT (R2=0.17), with both coefficients statistically different from zero, while the women's line is MS = 2.99+0.72*DTAMT (R2=0.23), with both coefficients also significant. The low R2 values in men and women, although higher than those obtained for FFM, show that DTAMT, while significant, is not a sufficient predictor of MS.
Discussion
Regarding the nutritional diagnosis, most of the people had excess weight, with increased waist c. and FM, and normal levels of v. fat and AMC. Sixty-nine percent of people were found to have weight loss and low MS, which could be secondary to hospitalization associated with asthenia, adynamia and hyporexia, among other factors. The results obtained coincide with sex and age-specific physiological aspects, finding greater height, AMC and MS in men, and lower FM and MS in those over the age of 60 18,19. Our study found a lower percentage of malnutrition and greater proportion of normality and excess weight compared with the results of the study by Bragagnolo et al. in 2009 20.
Bakkal et al.21 found that MS decreased significantly as age increased, which is also seen in our study's findings.
In 2009, Bragagnolo et al. found that the average DTAMT was 12.6±3.2 mm, and 12.2±2.9 mm in the nondominant hand. These values are lower than those found in our study; these authors determined that TAMT measurement was an easy, inexpensive and reliable method for nutritional assessment in surgical patients, which in clinical practice correlates well with other anthropometric, biochemical and clinical parameters 20.
Bragagnolo et al.'s cohort study in 2011 22 related TAMT and MS as predictors of postoperative complications. Their cut-off points for the ROC curves were: (for the dominant hand) 13.4 mm for women under 60 and 12.2 mm for women over 60. For men they were 14.5 mm in those under 60 and 14.4 mm in those over 60. In our cross-sectional study, the cut-off points were higher in men and lower in women over the age of 60. It should be emphasized that, according to the ROC curves, those who were malnourished had less FM, FFM and a lower TAMT.
The DTAMT values for men and women in our study are higher than those in the study by Lameu et al. (men, 12.5±2, mm, with an average of 12 mm; women, 10.5±2.3 mm, with an average of 10 mm), who were the first to provide anthropometric and measurement criteria for this parameter in a healthy Brazilian population 13. In the ROC curves, our study found a cut-off point of 13.4 mm for determining malnutrition (dominant hand), exactly the same value Bragagnolo et al. found in 2009 20.
Various studies have determined that TAMT measurement can be used in screening and in the nutritional assessment of individuals in different clinical situations. For a more precise nutritional diagnosis, TAMT measurement must be combined with other nutritional assessment methods and parameters 6,7,17,23,24.
De Oliveira et al. found that TAMT is an easily measured, economical, non-invasive anthropometric parameter which does not appear to be significantly affected by variations in hydration and correlates well with markers which reflect the condition of the muscle compartment, age, sex, body build, BMI, laboratory parameters and bioelectrical impedance. They determined that a TAMT less than 10.6 mm was associated with a higher risk of hospitalization 5. Cobero et al. were unable to determine a cut-off point for TAMT to use as a nutritional status indicator, due to the large proportion of overweight in the study population 25.
In patients with anorexia nervosa, an improved nutritional status was found to be accompanied by increased fat but not muscle in the hand adductors; therefore, TAM measurement is not a reliable tool for evaluating muscle mass gain in these patients 26.
Our results are similar to those of Cortez et al., who studied ambulatory HIV infected patients and found a DTAMT of 16.2±4.2 mm, and 14.8±4.3 mm in the nondominant hand. These values were lower than in healthy people; furthermore, the TAMT in both hands was positively correlated with weight and the male sex 27.
Pereira et al. and Fink et al. found that the TAMT in critically ill patients had poor precision for predicting malnutrition and was not a good predictor of mortality. However, lower values prolonged the hospital stay (more than three days) 28,29. Caporossi et al. found that TAMT is a valuable tool for predicting mortality in critically ill patients 30.
Likewise, Karts et al. found that a TAMT value less than 6.5 mm was associated with more infectious complications, highlighting its prognostic value 8. Furthermore, the study by Rosário et al. found that TAM was directly related to the octopolar impedance phase angle, a recognized prognostic marker in various clinical situations 31.
In the studies performed to evaluate the correlation between TAM and FFM, some confirmed this correlation, and, in others, the correlation was not strong enough to use TAM as a predictor of FFM. The latter studies report that it is better to use weight or TAM together with other variables like BMI.
The studies by Barbosa et al. and Marini et al. found positive correlations, affirming that TAM can be used as a predictive factor for muscle mass loss. Barbosa's study determined that, compared to weight, TAMT was less associated with muscle mass. Therefore, in individuals who are able to walk, weight is a better predictor of muscle mass than TAMT. However, in bedridden patients whose body weight is difficult to determine, TAMT could be used as a predictor of muscle mass, but the interpretation should be taken with caution. This study concluded that TAMT measurement is an objective, practical, inexpensive and minimally invasive method which complements nutritional status assessment and can be used as a predictive factor for muscle mass loss 32. Marini et al. also found that TAMT and serum albumin concentrations are associated with the loss of lean mass in elderly people 33.
In contrast, the studies which do not recommend TAM as a predictor for muscle mass include Bielemann et al.'s in Brazil, which found that TAMT was moderately correlated with lean mass. While they affirm that it cannot be promoted as a single predictor of lean mass, it does have a small predictive capacity to estimate lean mass when considered together with BMI 17. Our study found that DTAMT, while significant, is not a sufficient predictor of FFM, just as these authors concluded.
Furthermore, Schwanke et al. found that the results were insufficient to promote TAMT as a single indicator of lean mass 34. Dos Reis et al. found that, in patients with kidney transplants, TAMT was associated with muscle mass and showed a lower prediction of FFM, compared with body weight 35.
Likewise, a cross-sectional study of women who joined a physical exercise program in Brazil found that weight was more associated with FFM than with TAMT. The use of TAMT explained 12%, while weight explained 65% of the variations in FFM. These results suggest that a simple anthropometric measurement like weight could be a better predictor of FFM than TAMT 36.
Our study found that DTAMT had a significant positive association directly proportional to FFM, but was not predictive, as it had low R2 values for men and women, similar to those obtained by Bielemann 17. The low R2 values in both samples lead us to conclude that DTAMT thickness, although significant, is an insufficient predictor of FFM.
The cross-sectional study by Pagano et al. in cancer patients mentioned that low MS values appear to be related to loss of muscle mass, with greater disease severity, and could be related to fluid disturbances 37. This possible association was confirmed in our study with a directly proportional significant positive correlation in the total sample as well as in the correlations by subgroups, disaggregated by sex and age. However, despite these results, MS cannot be used as a predictor of FFM, due to the low R2 values.
Likewise, decreased MS has been correlated with a higher risk of developing malnutrition-related complications 11,12, with decreased pulmonary volume in critically ill patients 12, the detection of short-term functional disorders in older adults and hospitalized patients 4, and decreased b. mass in older adults 38. Furthermore, a direct correlation has been found with anthropometric variables like weight, AC and AMC, and with carbohydrate consumption 39,40. It has also been used as a tool for nutritional screening with a positive correlation with the Mini Nutritional Assessment 41, as an indicator of nutritional status 12, as well as being useful for evaluating functional capacity 11,12 and predicting the risk of infectious complications, hospital stay and postoperative mortality 22.
Forero et al. found a significant correlation between MS and anthropometric indicators like AMC in a group of hospitalized adult patients 40. Similarly, MS has proven to be significantly correlated with anthropometric measurements in older women 39, and is associated with muscle mass, the percentage of body fat and b. mass. Furthermore, it is related to the ability to walk in fragile hospitalized older adults 42. Torralvo et al. found that MS is directly associated with lean mass, which supports its usefulness in nutritional assessment 43.
Two recent studies in Brazil in cancer surgery patients and patients with chronic viral hepatitis determined that TAMT measurements and dynamometry were positively correlated with nutritional assessment using subjective global assessment, adjusting for variables like sex and age. They concluded that the simultaneous use of these simple, inexpensive and accurate tools provides a better picture of the actual nutritional status of patients hospitalized for different diseases 44,45.
Like TAMT measurement, dynamometry is an inexpensive, simple and quick tool for identifying individuals with malnutrition who would have a higher risk of morbidity and mortality 4,46-48. Although our study found that DTAMT was positively related to MS, it is safe to say that it is an insufficient predictor of MS.
Finally, TAMT measurement is an easy and inexpensive method which is correlated with other anthropometric and body composition measurements for assessing muscle mass and may be included in the nutritional assessment protocols as a complementary method, or for use when other measurements cannot be taken. While our study is a pioneer study in the country, it should be mentioned that it is cross-sectional, and further studies should be carried out to determine the predictive validity of TAMT for FFM and MS and for complications in surgical patients.
Conclusions
Most of the evaluated patients had excess weight, had lost weight regardless of the nutritional diagnosis, and had low MS, associated with illness and hospitalization. The TAMT was greater in the dominant hand and in men, decreased as age increased, and was an important predictor of malnutrition. Likewise, we found a directly proportional, but not predictive, significant positive correlation between MS and FFM. Although the TAMT was significantly associated with FFM and MS, it is not a useful parameter for predicting these variables.

