


Services on Demand
Journal
Article
 English (pdf)
 Article in xml format
 Article references
 Send this article by e-mail
Indicators
-
 Cited by SciELO
 -
 Access statistics
Related links
-
 Cited by Google
 -
 Similars in
SciELO
Similars in
SciELO -
 Similars in Google
Share

 Permalink
Lecturas de Economía
Print version ISSN 0120-2596
Lect. Econ. no.80 Medellín Jan./June 2014
ARTÍCULOS
The Relative Importance of the Service Sector in the Mexican Economy: A Time Series Analysis
La importancia relativa del sector servicios en la economía mexicana: un análisis de series de tiempo
L'importance relative du secteur des services dans l'économie mexicaine: une analyse à travers des séries temporelles
Ramón Castillo*, Carlos Flores** y María Rodríguez***
* California State University, Los Angeles and Universidad Autónoma de Baja California. Dirección postal: 5151 State University Drive, Los Angeles, CA 90032. Dirección electrónica: rcastil@calstatela.edu.
* Universidad Autónoma de Baja California. Dirección postal: Avenida Altabrisa 14004, Fraccionamiento Altabrisa, Baja California, México 22420. Dirección electrónica: cflores@uabc.edu.mx
*** Universidad Tecnológica de la Mixteca. Dirección postal: Carretera a Acatlima Km. 2.5, Huajuapan de León, Oaxaca, México 69000
–Introduction. –I. Data. –II. Empirical exercise. –Conclusions. –References
Primera versión recibida el 11 de mayo de 2013; versión final aceptada el 17 de junio de 2013
ABSTRACT
We conduct a study of the secondary and tertiary sectors with the goal of highlighting the relative importance of services in the Mexican economy. We consider a time series analysis approach designed to identify the stochastic nature of the series, as well as to define their long-run and-short run relationships with Gross Domestic Product (GDP). The results of cointegration tests suggest that, for the most part, activities in the secondary and tertiary sectors share a common trend with GDP. Interestingly, the long-run elasticities of GDP with respect to services are on average larger than those with respect to secondary activities. Common cycle tests results identify the existence of common cycles between GDP and the disaggregated sectors, as well as with manufacturing, commerce, real estate and transportation. In this case, the short-run elasticities of secondary activities are on average larger than those corresponding to services.
Key words: Service sector, Mexico, cointegration, common cycles.
JEL Classification: E01, E20, C22
RESUMEN
Se realiza un estudio de los sectores secundario y terciario para México. Se considera un análisis de series de tiempo que identifica la naturaleza estocástica de las series así como sus relaciones de largo y corto plazo con el Producto Interno Bruto (PIB). Los resultados de las pruebas de cointegración encuentran, en general, que las actividades en ambos sectores comparten una tendencia común con el PIB. Es de notar que las elasticidades de largo plazo del PIB con respecto a los servicios son mayores en relación a las del sector secundario. Las pruebas de ciclo común identifican la existencia de un ciclo común entre el PIB y los dos sectores considerados, así como con la manufactura, el comercio, los bienes raíces y el transporte. En este caso, las elasticidades de corto plazo del PIB con respecto a las actividades del sector secundario son, en promedio, mayores a las correspondientes a los servicios.
Palabras clave: Sector servicios, México, cointegración, ciclos comunes.
Clasificación JEL: E01, E20, C2.
RÉSUMÉ
Dans cet article nous étudions les secteurs secondaire et tertiaire au Mexique. Pour ce faire, nous présentons une analyse à travers des séries temporelles afin d'identifier la nature stochastique avec le PIB (produit intérieur brut) aussi bien à long qu'à court terme. Les résultats des tests de cointégration montrent que les activités économiques dans les secteurs partagent une tendance commune avec celle du PIB. Nous montrons, tout particulièrement, que les élasticités à long terme du PIB par rapport au secteur tertiaire sont plus élevées par rapport au secteur secondaire. Les tests de cycle commun montrent l'existence d'un cycle commun entre le PIB et les deux secteurs économiques considérés, ainsi qu'avec d'autres secteurs tels que la manufacture, le commerce, l'immobilier et le transport. Dans ce cas, les élasticités à court terme du PIB par rapport au secteur secondaire sont, en moyenne, plus élevés que celles du secteur tertiaire.
Mots-clés: secteur des services, Mexique, cointégration, cycles communs.
Classification JEL: E01, E20, C22.
Introduction
For decades, analysis of the Mexican economy has focused on the manufacturing sector. In just about every line of research manufacturing has been considered the main object of study. Documents on economic growth, labor markets, and regional development, among other areas, usually focus on the secondary sector.1 To some extent this is not surprising. After all, industry was the primary contributor to the gross domestic product (GDP) for decades; it was the engine of growth. As stated in Tybout and Westbrook (1996), manufacturing productivity rose significantly following the abandonment of the import industrialization model. Starting in the 1980s however, the contribution of manufacturing to the aggregate economy has experienced a steady decline, giving way to services as the main contributor to output. Nowadays services account for about 60 percent of GDP and the share of manufacturing stands at 30 percent.2
Clearly, understanding the behavior of the service sector has become essential when studying the Mexican economy. That is, given the sector's contribution to GDP, it is highly plausible that the source of many phenomena associated with the aggregate economy is found in the behavior of services. Take for instance the analysis of the synchronization of the Mexican and US business cycles. Typically, research focuses on showing that manufacturing production in Mexico and the US are highly correlated. From this fact, the inference is made that the interdependence of the manufacturing industries across both countries caused the synchronization of their business cycles. Chiquiar and Ramos-Francia (2003), for instance, provide a description of the pertinent literature and conduct an analysis of the importance of industrial linkages as determinants of synchronization. The question becomes, is manufacturing the only factor leading to synchronization? Or can we understand it as a phenomenon arising from the dynamics of the service sector? One can reasonably posit that the service sector, being the largest contributing sector to GDP both in Mexico and in the US, is at least to some extent responsible for the behavior of each country's business cycles, and hence a likely candidate as the source of synchronization. The recent global economic slow-down provides a nice illustration of this possibility. As it is widely known, the recession in the US was due to the collapse of financial services, which also affected other world economies including the Mexican economy. Thus, at least in the more recent past, the cycles of Mexico and the US have been influenced by the service sector, not manufacturing. Evidently, determining the precise transmission mechanisms of business cycles synchronization is beyond the scope of this paper. The purpose of providing this example is to highlight the importance of focusing more closely on studying the service sector.
It goes without saying that the present is neither the first nor the only paper evaluating services in Mexico. Various studies have contributed to understanding their behavior, and to some extent have brought to light their importance in the economy. Coll-Hurtado and Córdoba y Ordoñez (2006), for example, conduct a study of the service sector in the context of globalization. The authors argue that the transition of the Mexican economy to the tertiary sector has been a byproduct of migration and the globalization process. They note that in the 1950s a wave of migration from rural Mexico to urban centers led to the decay of the agricultural sector and the insertion of low-skilled workers in activities related to manufacturing and services. Starting in the 1980s, as the country opened to international trade services began to cater to the demands of world markets and a more skilled labor force became necessary. Today, although a movement toward more qualified employees is in progress, we still find that the majority of jobs in the service sector are found in low-productivity and low-wage activities, with commerce representing the largest employer.
The transition to highly skilled jobs in the service sector is also discussed in Ramírez (2004). The author suggests that liberalization of the Mexican economy has led to a significant increase in the demand for technologically savvy workers. This in turn has widened the gap between the wages of skilled and unskilled workers. The study also identifies services as the sector with the largest contribution to job growth. Aguayo and Álvarez (2007), on the other hand, perform an econometric exercise for different regions of the country and find that hospitality services are the most dynamic in terms of the growth rate of production. The same authors provide in their 2003 paper a thorough description of the evolution of private and public services at the regional level. They note the strong growth of services and their influence in closing the development gap across regions. Finally, it is worth mentioning that studies in the area of input-output models have also addressed the role of services. Among others, Davila (2002) and Fuentes (2005) analyze the relative importance of services within different regions in Mexico. They suggest that services represent an important job creating source.
Beyond the contribution of the previously cited documents to the understanding of the role of services in the Mexican economy, various studies have identified the relevance of this sector in emerging economies. For instance, Wolfl (2005) finds that services have become the largest sector, quantitatively, in OECD countries. Along the same line of research, Eichengreen and Gupta (2009) recognize a transition from manufacturing to services across developing nations, especially since the 1990s.
Given what is found in the literature, both at the national and international level, and the fact that services represent the largest share of production in GDP, we contend that devoting more attention to the role of services in the Mexican economy is warranted. As illustrated before, various phenomena at the aggregate level might be explained by understanding the behavior of this sector. To narrow the scope of our analysis, we center our attention on identifying the relative importance of services in the economy under a time series framework. This can be thought of as a novel exercise designed to determine how services influence the economy over time. As we have noted, a vast number of papers studying the relationship between the aggregate economy and manufacturing has been produced, many employing time series analysis. In general, it is accepted that these two variables share a common trend and present similar cycles. Several papers, including Mejía, Gutierrez and Farias (2006), have come to this conclusion. To be more specific, it has been shown that in the long run the permanent component of manufacturing production follows the trajectory of real GDP. In the short run, the contractions and expansions of the manufacturing industry are mirrored by the business cycle. For the case of services, however, little is known about their time dynamics with respect to GDP. Perhaps the closest in spirit to the present exercise is Castillo et al. (2010), who formally evaluate the permanent and cyclical behavior of services. In contrast to this exercise, in their analysis the authors focused on determining how the evolution of services in Mexico is related to its US counterpart, not the Mexican economy.3
Our analytical strategy follows this sequence: we first identify the stochastic nature of the time series corresponding to the different activities classified as services. Then, we determine whether each of these activities shares common characteristics with real GDP. In particular, we perform cointegration and common cycle tests to identify the degree of association among the series in the long run and in the short run, respectively. Finding cointegration would mean that movements in the trend of the services series, for example, are related to movements in the trend of real GDP. Similarly, identifying a common cycle would imply that transitory movements in one of the series are replicated by similar movements in the pairing series. The exercise also considers activities in the secondary sector. The motive for their inclusion is to compare the relative importance of the secondary and tertiary sectors. Since tertiary activities represent the largest share of GDP, we expect to find that their association with GDP is at least as strong as that exhibited by activities in the secondary sector. To be more precise, we posit that services share a common trend and a common cycle with GDP.
Although the exercise is interesting in and of itself, the empirical findings derived from it can be useful in various contexts. A clear example refers to the previously mentioned topic, fluctuations of the Mexican economy. If a thorough framework of analysis of the business cycle is to be developed, one would necessarily have to consider the behavior of the service sector since it accounts for the largest share of GDP. Another area of interest would be forecasting. Activity in the service sector could be considered a leading indicator of economic performance. Studies about the labor market and productivity can also benefit from understanding the dynamics of the service sector; given that services represent the largest employer in the economy.
The rest of the document is organized as follows: Section I describes the data. From the statistics presented in this section it will become evident that the tertiary sector is the most important in terms of its contribution to GDP. Also, the reader will notice that commerce and real estate services produce just about the same percentage contribution as manufacturing and construction do. This is particularly important to highlight given the fact that commerce and real estate have received virtually no interest in the analysis of the Mexican economy. In the case of commerce, the absence of thorough studies about it is certainly puzzling, since the sector represents one of the primary sources of employment in the country, as stated in Ramirez (2004). The econometric exercise is conducted in Section II. As we previously indicated, our intention is to establish long-run and short-run associations between GDP and each of the different sectors and activities we analyze. Thus, the exercise will consist of implementing unit root tests, cointegration tests, and common cycle tests. For every test we consider methodologies that allow for the presence of structural breaks, which are evident in all the series. The discussion of the results and implications for future research are also included in this section. Final comments are presented at the end of the document.
I. Data
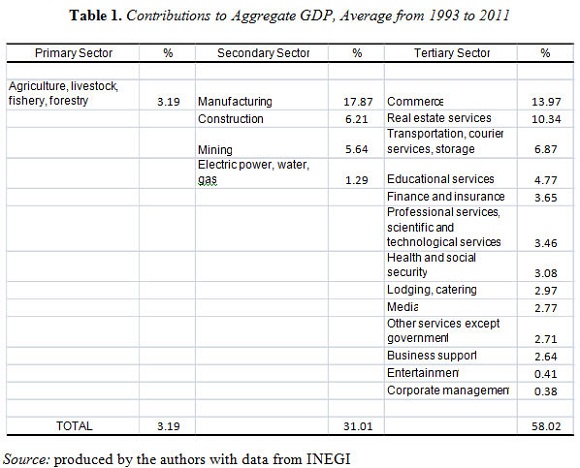
Data include time series for aggregate GDP, GDP for the three major economic sectors, namely primary, secondary and tertiary, and GDP for various economic activities within these sectors. In all cases data are expressed in real terms for the sample period covering from the first quarter of 1993 to the fourth quarter of 2011. The source of the data is the National Institute of Statistics and Geography (INEGI). Table 1 shows the average participation of each variable on aggregate GDP. Notice that primary activities account for only 3 percent of the total, which is not surprising once we recognize that Mexico has evolved from an agricultural economy to one that relies on manufacturing and services. Somewhat unexpectedly, given the lack of interest in the service sector, we see that tertiary activities represent about 60 percent of total GDP, while the secondary sector stands at 31 percent.
Another interesting fact emerges from the table: commerce and real estate services account for about 24% of total GDP, a percentage similar to the sum of manufacturing and construction. That is, these two activities are as important in terms of their contribution to GDP as secondary activities are. If we add transportation and educational services, the total contribution of these four activities would be 36%, more than the total contribution of all secondary activities.
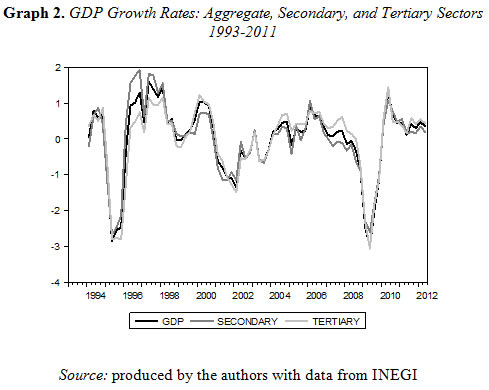
As a means to visualizing the behavior of the variables, Graph 1 illustrates the series in levels corresponding to the aggregate GDP and the GDPs for the secondary and tertiary sectors.4 It is evident that they follow a similar trend. It is also clear that the series present at least two structural breaks, one around 1995 and the other in 2009; these two years correspond to severe economic crises in Mexico. Thus, from this illustration it is evident that the econometric exercise must consider techniques that allow for such dynamics. Graph 2 shows the growth rates. The cycles of the series appear to be highly synchronized. With respect to the secondary sector this fact is not surprising. As it was stated before, a number of studies have identified high correlation of the growth series for manufacturing production and GDP. As for the services series, the illustration suggests that the cycles of the service sector and GDP are also synchronized. From this graph one can reasonably expect to find common short-run movements between GDP and production in the tertiary sector. The formal evidence is provided in the following section.

II. Empirical Exercise
As stated in the introductory portion of the paper, the framework of analysis is time series. The primary sector is excluded from the exercise; its contribution to the aggregate economy is minimal. We begin by determining the stochastic nature of the variables via the estimation of unit root tests. Then we proceed with the implementation of cointegration tests. Lastly, the short-run relationships are established. In the next few lines we present a concise description of the methodologies employed.
A. Methodology
For the unit root tests we consider the Kwiatkowski et al. (1992) methodology and Harvey, Leybourne and Taylor (2011) as an alternative that allows for structural breaks. Briefly, the Harvey et al. test considers a data generating process of the form:
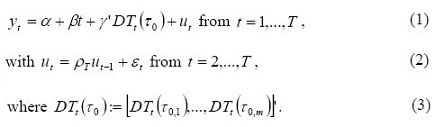
Using this specification it is possible to carry out a Dickey-Fuller type test under the null hypothesis of the existence of a unit root. The test produces two statistics, MDF1 and MDF2, each of which captures one possible break in the series.
For the cointegration tests we implement the commonly used Johansen methodology and the Hatemi-J (2008) test under the presence of structural breaks. Since the Johansen methodology is widely known, we spare the reader from a description. A summarized account of the Hatemi-J test follows. Consider an equation of the form:

where yt and xt are random variables, and D1tand D2tare binary variables defined as:
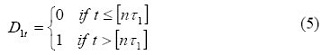
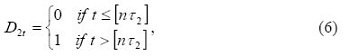
with  and
and  representing the breaks in the series. The null hypothesis is no cointegration and the tests produce the statistics ADF, Zt and Zα.
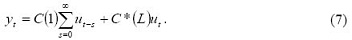
This expression corresponds to the basic Beveridge and Nelson (1981) decomposition of a time series, with the first term representing the permanent component and the second the transitory element. The s linearly independent vectors,  , stacked in an s x n matrix
  with
with  , refer to the number of common cycles in the system. The number s is computed by calculating the squared canonical correlations in the system, λ2, and then testing to determine if the smallest correlations are zero,
 . The test statistic is given by
  and it is distributed X2 with s2+snp+sr-sn degrees of freedom, where s refers to the number of common cycles, n is the number of variables, r is the number of cointegrating vectors, and p represents the optimal lag structure. The test we instrument is augmented by including a dummy variable that accounts for the structural breaks in the series.
B. Tests
1. Unit Root Tests
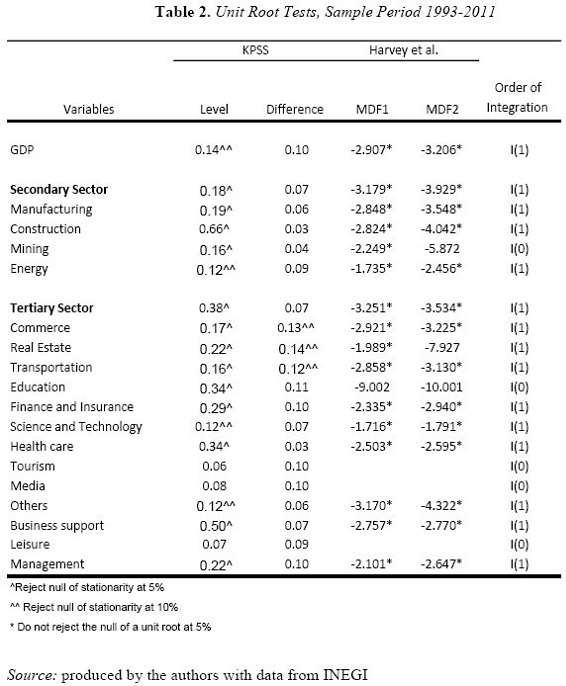
Table 2 presents the results of the KPSS and Harvey et al. (2011) unit root tests. With the exception of educational services, tourism, media, and leisure, all the series prove to be integrated of order 1. The KPSS results suggest that the series are non-stationary in levels and stationary in first differences at conventional levels. When taking into account the structural breaks, the Harvey et al. tests find that the series in levels are non-stationary as the null of stationarity is rejected. Although a graphical representation of the series is not included, visual inspection of the I(0) series confirmed that they are in fact stationary, as they fluctuate around a constant mean.
2. Cointegration Tests
The cointegration tests are performed considering bivariate systems containing GDP and each of the series identified as I(1) in the previous exercise. The lag structure is determined using standard information criteria. The results are reported in Table 3. The statistics under both tests suggest the presence of a common trend in 10 of 14 systems. Energy, science and technology, health care, and management appear not to share a common trend with GDP. The normalized cointegration vectors are also shown in the table. In all cases the coefficients are positive and significant at conventional levels.5
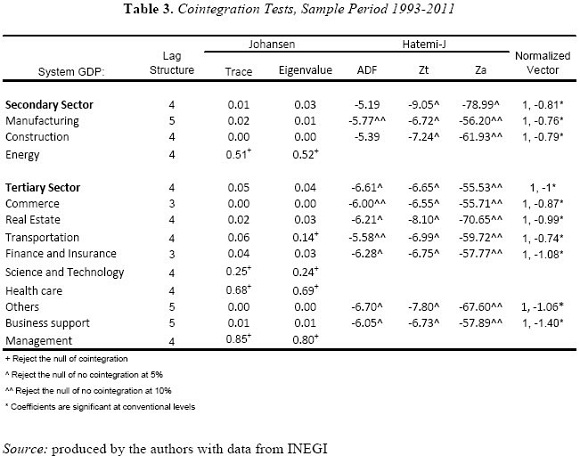
It is interesting to note that the long-run elasticities of the tertiary sector, and some activities related to this sector, are higher than the computed elasticities for the secondary sector. In particular, while the elasticity of GDP with respect to the secondary sector is 0.81, that corresponding to the tertiary sector is 1.00. Similarly, the average elasticity for the two largest activities in the secondary sector, manufacturing and construction, is 0.77; while the average for commerce and real estate is 0.93. These results suggest that movements in the trend of the service sector are more intensely reflected in the aggregate economy than movements in the secondary sector. This finding surely reflects the fact that services account for almost two thirds of GDP. Of course, these magnitudes may be debatable; one can argue that the difference might not be statistically significant, or that the results are influenced by the sample period. While these reservations are valid, we can at least agree on one fact, the importance of the dynamic behavior of the service sector is highly relevant for the Mexican economy.
3. Common Cycle Tests
We now conduct the common cycle tests for those systems for which cointegration was identified, the results are reported in Table 4. As indicated before, the tests considered a dummy variable to control for the structural breaks in the series. The variable assumes the value of 1 during 1994, 1995 and 2008 –periods that correspond to the two most significant crises in the country–.
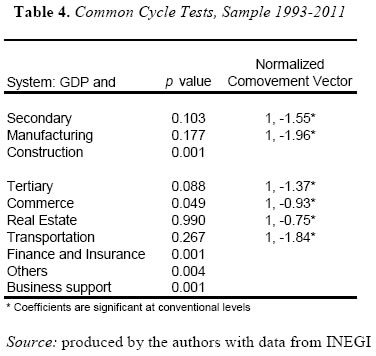
There is evidence of a common cycle between GDP and the secondary and tertiary sectors, as well as for GDP and manufacturing, construction, commerce, real estate, and transportation. That is, transitory movements in GDP are shared by transitory movements in the sectors and activities just mentioned. In all cases the relationship is positive and the coefficients for the short-run elasticities are significant. In terms of magnitude, manufacturing exhibits the largest and real estate services the smallest. The result for manufacturing is consistent with the widely held belief that there exists a strong association between this industry and the aggregate economy. We should note, however, that the result by no means suggests that manufacturing activity causes fluctuations in the business cycle; causality could very well run in the opposite direction. The coefficient simply indicates that a one percent change in manufacturing production is associated with an immediate change of 1.946 percent in GDP. Relatively large coefficients are also found for the secondary sector as a whole, the tertiary sector and transportation services. Overall, the results suggest that, even for short-term fluctuations, the behavior of services is strongly associated with the economy at large, just like the secondary sector is. No evidence of a common cycle is identified for construction, finance and insurance, business support or other services; these are the activities that contribute the least to aggregate GDP.
Conclusions
Mexico moved from an agricultural society to an industrialized economy throughout the twentieth century. Manufacturing took center stage by the mid 1960s; it served as the engine of growth for many decades. By the end of the 1990s and the beginning of the 2000s, however, the backbone of the economy had shifted to services. Nowadays this sector represents about two thirds of real GDP. Interestingly enough, the economics literature has not kept up with this transformation; most of the studies evaluating the Mexican economy still focus on the manufacturing industry. In this paper we conducted a time series analysis of the service sector. The goal was to identify the stochastic relationship between the aggregate economy and services. From cointegration and common cycle tests we established that services share common trends and common transitory movements with real GDP. Moreover, we showed that in the long run the responsiveness of GDP to services is stronger than the same with respect to manufacturing. Based on these findings, we posit that analysis of the performance of the Mexican economy should consider the manner in which services influence the aggregate economy; more attention should be paid to services.
Notes
* We thank Pablo Mejía-Reyes, Lizzette Arroyo and two anonymous referees for helpful comments. The usual disclaimer applies. Corresponding author: rcastil@calstatela.edu
1 Studies about the manufacturing sector are abundant, just to mention a few in the aforementioned areas: Blomstrom and Persson (1983) for development, Cragg and Epelbaum (1996) for the labor market, and Hanson (1996) for regional growth.
2 Castillo, Valera and Ocegueda (2010) show the evolution of the participation of the service sector in the Mexican economy since the 1980s. The authors identify the gains of services in their contribution to total GDP throughout time.
3 Aguayo and Alvarez (2007) explicitly recognize the contribution of the secondary sector to GDP. In contrast to our study, the authors consider panel data.
4 Scale is normalized to produce a visually friendly image.
5 Test statistics are not included for brevity.
Referencias
Aguayo Lorenzo, Eva and Álvarez Baeza, Lía (2007). ''Análisis Econométrico del Sector Servicios en las Regiones de México, 1993-2001'', Investigación Económica, Vol. 66, No. 261, pp. 35-60. [ Links ]
Álvarez Baeza, Eva and Aguayo Lorenzo, Lía (2003). ''El Sector Servicios Privados en las Regiones Mexicanas: Un Modelo Econométrico'', Estudios Económicos Regionales y Sectoriales, Vol. 3, pp. 35-60. [ Links ]
Beveridge, Stephen and Nelson, Charles (1981). ''A New Approach to Decomposition of Economic Time Series into Permanent and Transitory Components with Particular Attention to the Measurement of the Business Cycle'', Journal of Monetary Economics, Vol. 7, Issue 2, pp. 151-174. [ Links ]
Blomstrom, Magnus and Persson, Håkan (1983). ''Foreign Investment and Spillover Efficiency in an Underdeveloped Economy: Evidence from the Mexican Manufacturing Industry'', World Development, Vol. 11, Issue 6, pp. 493-501. [ Links ]
Castillo Ponce, Ramón A.; Varela Llamas Rogelio and Ocegueda Hernandez, Juan Manuel (2010). ''Synchronization of Economic Activity between Mexico and the US: What are the Causes?'', Economic Analysis Review, Vol. 25, No. 1, pp. 15-48. [ Links ]
Chiquiar, Daniel and Ramos-Francia, Manuel (2003). ''Trade and Business-Cycle Synchronization: evidence from Mexican and US Manufacturing Firms'', North American Journal of Economics and Finance, Vol. 16, Issue 2, pp. 187-216. [ Links ]
Coll-Hurtado, Atlántida and Córdoba y Ordoñez, Juan (2006). ''La Globalización y el Sector Servicios en México'', Investigaciones Geográficas, No. 61, pp. 114-131. [ Links ]
Cragg, Michael I. and Epelbaum, Mario (1996). ''Why has Wage Dispersion Grown in Mexico? Is it the Incidence of Reforms or the Growing Demand for Skills?'', Journal of Development Economics, Vol. 51, Issue 1, pp. 99-116. [ Links ]
Dávila Flores, Alejandro (2002). ''Matriz de Insumo-Producto de la Economía de Coahuila e Identificación de sus Flujos Intersectoriales más Importantes'', Economía Mexicana, Nueva Época, Vol. 11, No. 1, pp. 79-162. [ Links ]
Eichengreen, Barry and Gupta, Poonam (2009). ''The Two Waves of Service Sector Growth'', NBER Working Paper, 14968. National Bureau of Economic Research. [ Links ]
Fuentes, Noé A. (2005). ''Construcción de una Matriz Regional de Insumo-Producto'', Problemas del Desarrollo, Vol. 36, No. 140, pp 89-112. [ Links ]
Hanson, Gordon (1996). ''Economic Integration, Intraindustry Trade and Frontier Regions'', European Economic Review,Vol. 40, Issues 3-5, pp. 941-949. [ Links ]
Harvey, David ; Leybourne, Stephen and Taylor, Robert (2011). ''Testing for Unit Roots in the Possible Presence of Multiple Trend Breaks Using Minimum Dickey-Fuller Statistics'', Journal of Econometrics, Vol. 177, Issue 2, pp. 265-284. [ Links ]
Hatemi-J, Abdulnasser (2008). ''Test for Cointegration with Two Unknown Regime Shifts with an Application to Financial Market Integration'', Empirical Economics,Vol. 35, pp. 497-505. [ Links ]
Instituto nacional de estadística y geografía (inegi) Disponble en: http://www.inegi.org.mx/default.aspx [ Links ]
Issler, João V. and Vahid, Farshid (2001). ''Common Cycles and the Importance of Transitory Shocks to Macroeconomic Aggregates'', Journal of Monetary Economics, Vol. 47, Issue 3, pp. 449-475. [ Links ]
Kwiatkowski, Denis; Phillips, Peter; Schmidt, Peter and Shin, Yongcheol (1992). ''Testing the Null Hypothesis of Stationarity against the Alternative of a Unit Root'', Journal of Econometrics, Vol. 54, Issues 1-3, pp. 159–178. [ Links ]
Mejía Reyes, Pablo; Gutiérrez, Elías and Farías, Claudia (2006). ''La Sincronización de los Ciclos Económicos de México y Estados Unidos'', Investigación Económica, Vol. 65, No. 258, pp. 15-46. [ Links ]
Ramírez Cruz, María Delfina (2004). ''Desigualdad Salarial y Desplazamientos de la Demanda Calificada en México, 1993-1999'', Trimestre Económico, Vol. 71, No. 289, pp. 625-680. [ Links ]
Tybout, James R. and Westbrook, M. Daniel (1996). ''Trade Liberalization and the Dimensions of Efficiency Change in Mexican Manufacturing Industries'', Journal of International Economics, Vol. 39, Issue 1-2, pp. 53-78. [ Links ]
Vahid, F. and Engle, Robert (1993). ''Common Trends and Common Cycles'', Journal of Applied Econometrics, Vol. 8, Issue 4, pp. 341-360. [ Links ] [ Links ]
