Services on Demand
Journal
Article
 English (pdf)
 Article in xml format
 Article references
 Send this article by e-mail
Indicators
-
 Cited by SciELO
 -
 Access statistics
Related links
-
 Cited by Google
 -
 Similars in
SciELO
Similars in
SciELO -
 Similars in Google
Share

 Permalink
Lecturas de Economía
Print version ISSN 0120-2596
Lect. Econ. no.81 Medellín July/Dec. 2014
ARTICLES
Equality of opportunity with categorical data
Igualdad de oportunidades con datos categóricos
L'égalité des chances avec des données catégoriques
Carmen Herrero*; Antonio Villar**
* Professor of Economics, University of Alicante & Senior Researcher at the Ivie. Postal address: Departamento de Fundamentos del Análisis Económico, Universidad de Alicante, 03080 Alicante, Spain. E-mail: cherreroblanco@gmail.com.
** Professor of Economics, Pablo de Olavide University & Visiting Professor at the European University Institute (Florence, Italy). Postal address: Departamento de Economía, Universidad Pablo de Olavide, Carretera Utrera km. 1, 41013 Sevilla. E-mail: avillar@upo.es.
–Introduction. –I. The model. –II. An empirical illustration. –III. Final remarks. –References. –Appendix.
Primera versión recibida el 28 de junio de 2013; versión final aceptada el 15 de noviembre de 2013
ABSTRACT
This paper refers to some social evaluation problems when equity matters. We propose here a way of assessing the equality of opportunity that is applicable to categorical data. It consists of dividing society into groups with similar characteristics and to measure the dispersion of outcomes within those groups, from the distribution of the population in the different categories. An empirical illustration on the equality of opportunity in education is provided, using the PISA 2012 data on mathematical knowledge regarding the Spanish regions.
Key words: Social evaluation, equality of opportunity, categorical data, PISA.
JEL Classification: I21, D63.
RESUMEN
Este trabajo aborda el problema de la evaluación social cuando la equidad es un aspecto relevante. En él se propone una forma de valorar la igualdad de oportunidades aplicable en contextos donde los datos son categóricos. Este método consiste en dividir la sociedad en grupos de características similares y medir la dispersión de los resultados entre dichos grupos, a partir de la distribución de la población en diferentes categorías. El trabajo incluye una aplicación empírica sobre la igualdad de oportunidades educativas usando los datos del informe PISA 2012 sobre conocimientos matemáticos en las regiones españolas.
Palabras clave: evaluación social, igualdad de oportunidades, datos categóricos, PISA.
Clasificación JEL: I21, D63.
RÉSUMÉ
Cet article discute l'évaluation sociale du point de vue de l'équité. Pour ce faire, nous proposons une méthode pour valoriser l'égalité des chances avec des données catégoriques. Cette méthode consiste à diviser la société en groupes qui ont des caractéristiques similaires pour mesurer ensuite leur dispersion, à partir de la répartition de la population dans les différentes catégories. Cet article comprend également une application empirique concernant l'égalité des chances dans l'éducation en utilisant les données de PISA dans son rapport 2012, tout particulièrement sur les connaissances mathématiques dans les régions espagnoles.
Mots-clés: évaluation sociale, égalité des chances, données catégoriques, PISA.
Classification JEL: I21, D63.
INTRODUCTION
The need to introduce distributive considerations in the analysis of social outcomes is already well established. Income distribution, health, education, or human development are instances in which this concern has been systematically incorporated from different perspectives (e.g. Roemer, 1996; Bleichrodt & van Doorslaer, 2006; Fleurbaey, 2008; Stiglitz, Sen & Fitoussi, 2009; OECD, 2010; United Nations, 2010). Equality of opportunity is one of the most relevant approaches to address distributive justice. There is a wide spectrum of views with respect to what is required for equality of opportunity, from the non-discrimination viewpoint to the consideration that social provision should compensate for all forms of disadvantage. Common to those views is that individuals are accountable, to some extent, for the achievement of the advantage in question, whether this refers to health, education, income, utility or welfare. Indeed, the issue of responsibility has become prominent in some of the recent developments within the areas of political philosophy and welfare economics (see Arnesson, 1989; Cohen, 1989; Fleurbaey, 1995; Bossert, 1995; Bossert & Fleurbaey, 1996; Roemer, 1998; Fleurbaey, 2008; and the literature cited therein).
The bottom line behind the equality of opportunity principle is that people who are relatively disadvantaged due to external circumstances deserve some kind of compensation. And, complementarily, that we should not be concerned for those outcome differences that derive from other people's characteristics that could be deemed irrelevant for the problem under consideration.
We propose in this paper a way of applying the equality of opportunity approach to the evaluation of societies when individual outcomes are categorical (e.g. when the data that describe their achievements correspond to ordinal perceptions, positions in a ranking, or quality levels). To do so we start by grouping people according to their circumstances so that society is partitioned into a finite number of types, each of which gathers individuals with similar circumstances. In that way all people of the same type share the same opportunity and therefore, outcome differences within types will be deemed irrelevant from an ethical viewpoint. The differences in the distribution of individual achievements across types, on the contrary, can be regarded as differences in people's opportunities. This is the kind of inequality we are interested in.
The novelty of our contribution is that we provide a complete cardinal measure of equality of opportunity that is not based on decomposability principles (additive decomposability of inequality indices, as in Ruiz-Castillo, 2003; Villar, 2005; Lefranc, Pistolesi & Trannoy, 2008 and 2009 or Checchi & Peragine, 2010, or the decomposition of outcomes between characteristics and returns, as in Bourguignon, Ferreira & Menendez, 2007 or Calo-Blanco & García-Pérez, 2012).1 Moreover, it is applicable to categorical data, a case in which only ordinal incomplete rankings are found, mostly based on the application of Lorenz dominance criteria (e.g. Allison & Foster, 2004; Abul- Naga & Yalcin, 2008; Zheng, 2011).
The paper is structured as follows. Section 1 presents the reference model. Section 2 presents an empirical application out of the last PISA data on fifteen-year old students' performance regarding mathematics in the Spanish regions. A few final words in Section 3 close the paper.
I. The model
Consider the problem of providing an assessment of the equality of opportunity for a society with m agents, M = {1, 2, ..., m}, when individual outcomes are categorical. That is, there is a partition of all possible individual outcomes into a set C = {1, 2, ...,γ} of categories so that each individual outcome belongs to one of those categories. Such an assessment will be represented by an evaluation function, Iopp(.), a mapping from the set of individual realizations to the real numbers, which is to be interpreted as an index of inequality of opportunity.
Our approach is based on the idea that individual outcomes depend on two sets of variables that will be referred to as choice variables and environment variables. Choice variables are those that link outcomes with autonomous decisions and can be regarded as an expression of the agents' responsibility. They are also known in the literature as effort variables. Environment variables refer to the agents' external circumstances and may include aspects such as gender, inherited wealth, parental background, etc. They are also known as opportunity variables.
Note that the division between those types of variables involves compromises that affect the nature and the extent of the evaluation, as it implies deciding on those aspects for which inequality is relevant and those for which it is not. Two remarks are worth considering in this respect.
First. External circumstances, in the sense used here, will typically depend on the problem under consideration. Take the case of wealth, for instance. It may well be that wealth derives from people's effort in many cases. Yet, when evaluating education or health, one usually assumes that wealth is part of the external circumstances, in the sense that it is a variable that should not affect people's outcomes in those respects (or, put differently, that education or health differences due to wealth are socially unfair).
Second. When applying the equity of opportunity principle to specific cases one may find that not all variables that affect agents' outcomes can be classified either as decision variables or environment variables. That may happen with some natural causes (e.g. age) or structural traits (e.g. social conventions). When comparing societies with different patterns for those types of variables, one has to find a way of neutralizing those differences. Age is a case particularly relevant in the evaluation of income, education or health because the outcome distribution is sensitive with respect to the age profile.
Suppose that, in spite of all those difficulties, we have already solved the question of which variables are decision variables and which ones are environment variables. Let T = {1, 2, ..., τ} denote the resulting set of types in which the population is partitioned, according to the agents' external circumstances. That is, all agents within a type have similar circumstances. There is a finite set of relevant categories, C = {1, 2, ...,γ}, that summarize all possible individual outcomes.
A. The evaluation formula
We want to assess the equality of opportunity, regarding a given aspect, in a society made of m individuals of τ different types that may produce outcomes belonging to one of γ different categories. The main idea behind our approach is that observed differences in the distribution of individual outcomes across types reflect the different opportunities that people enjoy.
Let m(t,c) be the number of agents of type t with outcome c, m(c) = Στt=1m(t,c) the total number of agents with outcome c in society, and m(t) = Στc=1m(t,c) the total number of type-t agents. Call αtc the probability that an individual of type t = 1, 2, ...,τ will have outcome c = 1, 2, ..., γ. That is,  . Let π = (π1,π2,...,πτ)be the vector of population shares of the different types; that is,
  , with πt > 0, ∀t and Στt=1 = 1.
Consider now the following matrix:
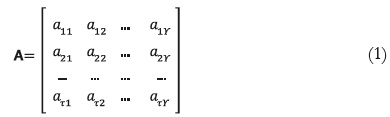
Row t of matrix A, denoted by α(t), represents the outcome distribution of type t and is to be interpreted as an expression of the differential effort of the agents of that type. Column c of matrix A, denoted by α(c), describes the distribution of the categorical outcome c across types. The differences in the probabilities within a column correspond in our framework to differences among types due to their differential circumstances.2
The product πA = b yields a row vector of γ terms, b = (b1, b2, ..., bγ), each of which describes the share of agents with outcome c in the population. That is,
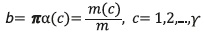
Our target here is to define a measure that captures the inequality of opportunity associated with a matrix A of relative frequencies of individual outcomes among a population consisting of τ different types. Ideally, the distribution of every outcome across types should be uniform. That is, in a fair society the differences in people's external circumstances should not affect their realizations. As a consequence, the observed differences in the distribution of realizations across types derive from characteristics that involve diverse opportunities for the members of this society.
The inequality that is relevant for our purposes is, therefore, that within the columns of matrix A, which describes the agents' chances of having a given categorical outcome depending upon their type. Clearly, there is no point in fostering an egalitarian distribution within a type, as those internal differences are, by construction, ethically irrelevant.
Given the distribution of outcome c across types, α(c) = (α1c, α2c, ..., ατc), we denote by i(c) the associated inequality measure, where i(.) is a relative inequality index applied to such a distribution. The inequality of opportunity associated with matrix A can be obtained as the weighted sum of the inequality across categories, with weights equal to the corresponding population shares. That is,

where i = [i(1), i(2), ..., i(γ)] is a vector of dispersion measures among the types by categorical outcomes. This inequality of opportunity index can also be interpreted as a summary measure of the differences between the rows of matrix A, which describe the distribution of outcomes across types.
Regarding the choice of the appropriate inequality index, we propose using the index of Atkinson (1970) for the value ε = 1, which can be expressed as:
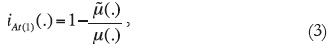
where μ(.) is the arithmetic mean and  the geometric mean. This index has several advantages: it is scale independent, has a range between 0 and 1, has a clear intuitive meaning and has been recently adopted by the United Nations as the standard to incorporate inequality concerns into the human development index (see United Nations, 2010 and Goerlich & Villar, 2009 for a discussion on inequality measures).
B. Overall social evaluation and inequality-adjusted values
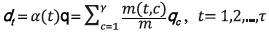
In some cases, it could be interesting to get an evaluation of the society's overall performance and not only of inequality of opportunity. This can be done by means of an evaluation function η(A, .), which associates real values to social outcomes. A particular case is that in which we have a vector q = (q1, q2, ..., qr) of cardinal values associated with the different categories of outcomes. Those values correspond to the weights attached to the different achievements in our evaluation. That is, each term qc can be interpreted as the unitary contribution of an agent with outcome c = 1, 2, ..., γ to the total.3 Then, column vector d, given by Aq = d, provides an evaluation of the average outcome of the different types, conditional on the cardinalization scheme q. That is,
The overall social evaluation of society, derived from a matrix A and an evaluation criterion q, will be given by
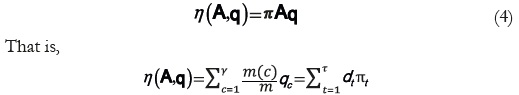
The last expression states that our evaluation criterion is embedded in an outcome evaluation function, a mapping  which associates real numbers to categories taking into account their distribution across the different types. That criterion consists of a weighted average of the values of the outcomes, with weights given by the corresponding population shares. Or, alternatively, it consists of the weighted sum of the evaluation of the types' average outcomes, with weights equal to the shares of the population types.
We can therefore identify  as the implicit evaluation of outcome c, and dtπt as the contribution of type t to aggregate value.
We can combine the evaluation of social outcomes and the assessment of the equality of opportunity in a single measure, H(.), that describes the inequality-adjusted evaluation function. This measure can be defined as follows:

That is, function H(.) applies a discount to the overall evaluation of social outcomes, η(.), equal to the weighted inequality across types (the inequality of opportunity index). The term describes the total amount of such a reduction.
From that expression, we can estimate the relative social loss due to the inequality of opportunity, RSLopp(A, i), as the ratio between the social loss, η(A, q)/opp(A, I), and the inequality-adjusted social evaluation, H (A, q, i); that is,

This expression gives us the share of the social value that is lost due to the inequality of opportunity. Interestingly enough, equation 6 turns out to be independent of the cardinalization assumed. That is, we can have a measure of the relative social loss without actually knowing the social evaluation function. Even though the information provided by equations 2 and 5 is equivalent, the figures in expression 5 are usually easier to interpret.
II. An empirical illustration: Inequality of opportunity in scholastic performance in the Spanish regions according to PISA 2012
To illustrate the workings of this evaluation method, we analyse the inequality of opportunity in scholastic performance of fifteen-year old Spanish students using the latest wave of the Programme for International Student Assessment (PISA), focussing on mathematical knowledge. PISA is a triennial worldwide test of 15-year-old schoolchildren's scholastic performance, the implementation of which is coordinated by the OECD. The survey provides information about the students' test scores and their personal background, learning habits, attitudes, engagement and motivation, and characteristics of their schools. It provides information on the students' ability in three different domains: reading comprehension, mathematics, and science. Every period of assessment specialises in one particular category, but it also tests the other two. The subject specialisation is rotated through each PISA wave. The 2012 report focuses on mathematics. See OECD (2013) for details.
Most of the Spanish regions have produced an enhanced sample of PISA so that they have statistically significant data at the regional level, which allows making comparisons among them.4 In order to get an estimate of the inequality of opportunity in the educational systems of the Spanish regions, we define the types and categories correspondent to the model above as follows. Types are given by the deciles of the distribution of the PISA Index of Economic, Social and Cultural Status (IESCS). This index combines information on parents' education and occupations and home possessions. Regarding categories, we take the distribution of the students' outcomes in the five levels of competence defined by PISA after aggregating levels 5 and 6 into a single one.5
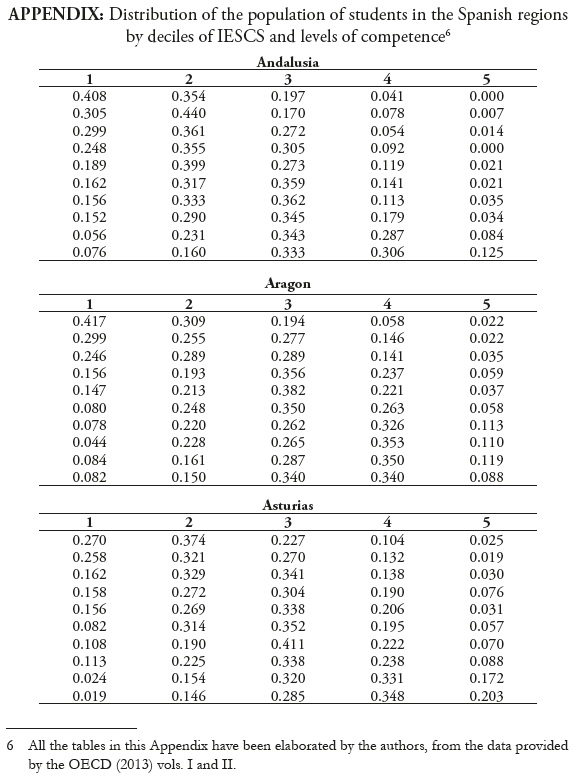
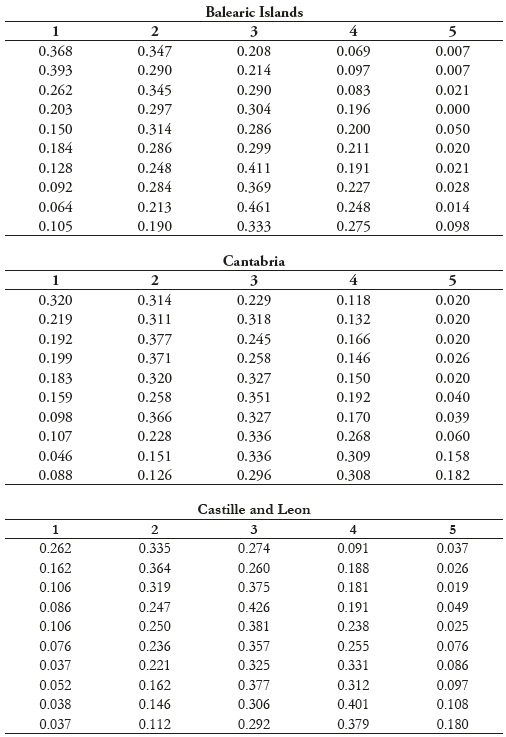
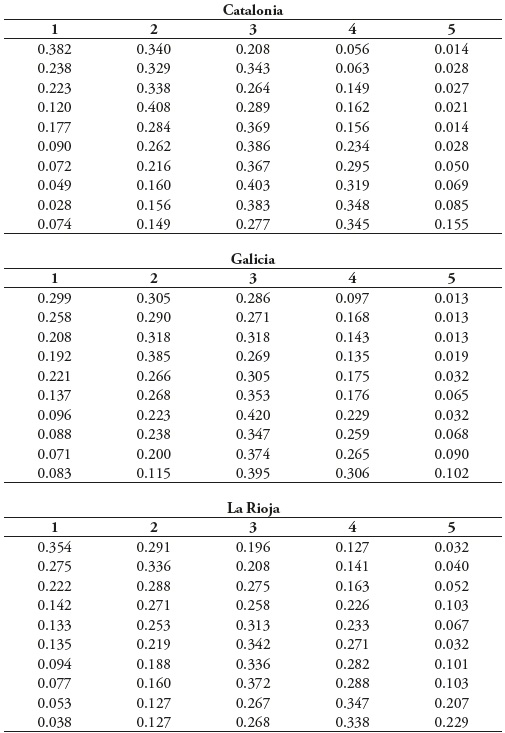
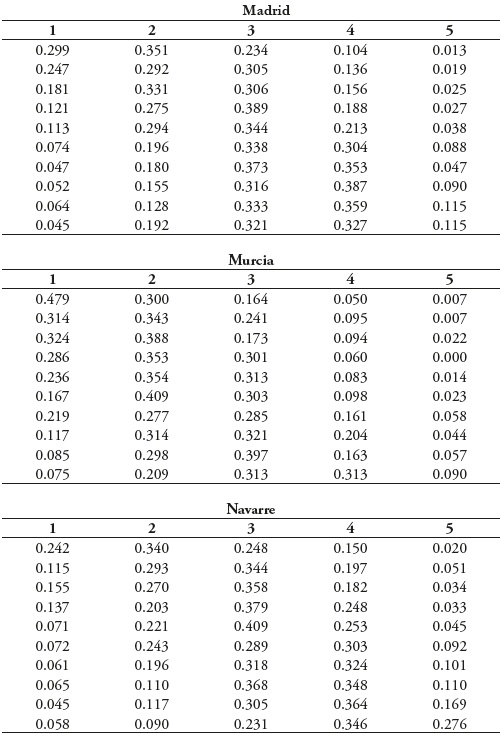
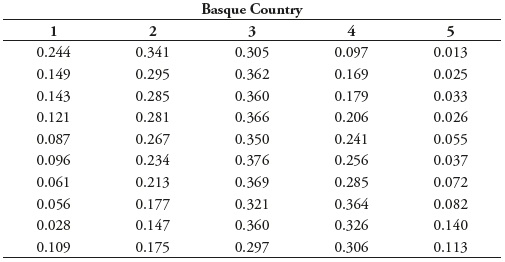
Our data are thus given by thirteen matrices, as there are thirteen Spanish regions with relevant data, each consisting of ten rows and five columns. Rows correspond to the deciles of the distribution of the IESCS and columns to the level of competence. That is, the term αitc corresponds to the share of agents in the decile t with competence level c in region i. Those data are incorporated into the Appendix.
Table 1 contains information regarding inequality of opportunity by levels of competence in the different regions. It is interesting to observe a common pattern between the regions: higher inequality of opportunity occurs at both the highest and the lowest level of competence. Yet the regions behave rather differently, as the coefficient of variation shows. The higher diversity also occurs at the highest level of competence, whereas the smaller one appears at the lowest level of competence. Andalusia, the Balearic Islands and Murcia show the highest inequality values for level 5 but rather low inequality at level 1. Navarre and the Basque Country exhibit very low inequality in both extremes. Catalonia and Madrid show mild inequality on both levels.
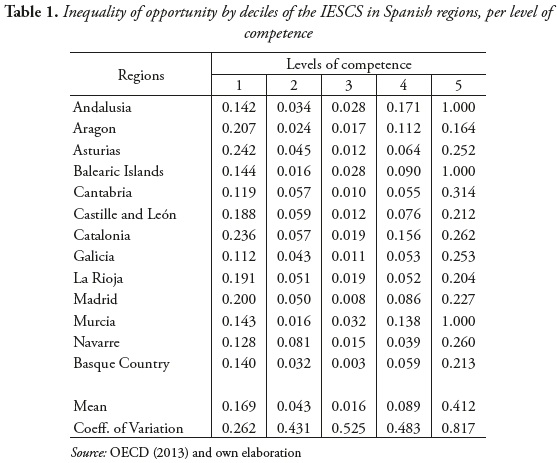
Table 2 provides the overall measure of Inequality of Opportunity proposed and relates it to some other variables. The first two columns of the table give information about the Inequality of Opportunity index (Iopp), both in absolute terms and relative to the mean. This second column permits one to both visualize easily the rapport with the mean and to compare the Iopp with another inequality index that appears in columns 3 and 4. This index is the coefficient of determination (the square of the linear coefficient of correlation) relating test scores and values of the IESCS. This is one of the inequality measures used by the OECD in order to assess the equity of educational systems. Even though the correlation between both measures is positive and relatively important (0.68), the data show that our Iopp measure discriminates more than the coefficient of determination and that there are some regions changing from above to below the corresponding average (Balearic Islands, La Rioja and Madrid).
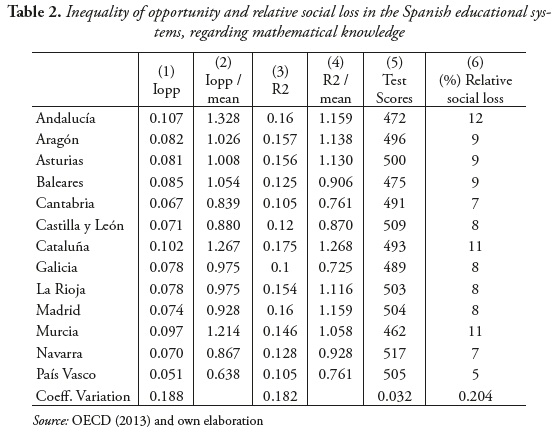
Column 5 provides the average test scores in order to compare performance and equity. The good news is that there is no trade-off between both aspects. Indeed, the coefficient of correlation between Inequality of Opportunity and test scores is -0.69 (even higher, in absolute terms, than the correlation between Iopp and R2). The correlation between test scores and the coefficient of determination is also negative, but much smaller (-0.13). It is worth noting that the coefficient of variation of the inequality of opportunity is almost six times higher than that of the test scores (see the values of the coefficient of variation in the last row).
The last column of the table provides the estimate of the relative social loss due to inequality of opportunity. Andalusia, Catalonia and Murcia, which are the regions with higher inequality of opportunity, show social losses above 10 %. In the other extreme we find Cantabria, Navarre and the Basque Country with values below 7 %.
III. Final remarks
Equality of opportunity is a powerful evaluation principle of the highest pertinence when dealing with such essential aspects of life as income, health or education. Applying this principle usually requires a number of compromises and case-specific adaptations that determine the extent and relevance of the analysis. Those difficulties increase when the original data are categorical.
We have presented in this paper a model for the evaluation of equality of opportunity applicable to the case in which outcomes can be categorical. The key idea is that of partitioning society in a finite set of types that collect agents with the same relevant circumstances and then compare the frequency distribution of the realizations across types.
When categories can be given a cardinal evaluation, we can also provide an overall evaluation of society's performance taking into account both average levels and inequality of opportunity. One may reasonably argue that such an evaluation becomes fully dependent on the weighting system of categories, which may derive from different sources or admit a number of alternatives. Yet it is worth noting that the analysis of equality of opportunity is independent on any cardinal valuation of the categories, which makes this analysis very robust.
In a complementary line of research, the authors have developed a model for the analysis of categorical data with an endogenous weighting system (see Herrero & Villar, 2013) permitting one to address this problem from a slightly different viewpoint (see Herrero, Méndez & Villar, 2014). The key difference is that the model presented here provides a summary measure of inequality of opportunity for the whole society, as an aggregate of inequality of opportunity in the different categories, whereas in those papers equality of opportunity only allows comparing the relative opportunity values of the different types. Both lines of research are, therefore, complementary.
NOTAS
1 See, however, Almas et al. 2011, for a different approach based in the notion of the Unfair Lorenz Curve.
2 Think, for the sake of illustration, of the case of two types, rich and poor, and two health states, good or bad. The rows of the corresponding matrix describe the distribution of health states for rich and poor people, respectively. The columns describe how good and bad health states are distributed between rich and poor. This type of difference is the one that we associate with the inequality of opportunity in society (here due to income factors).
3 In some cases, particularly when dealing with categorical data, those values correspond to a particular cardinalization introduced by the analyst out of some external source. When categories correspond to intervals, those weights may reflect a centrality measure of the interval (mean or median).
4 The only regions without statistically significant data in 2012 are Canarias, Castilla La Mancha and Comunidad Valenciana. Those of Extremadura were incorporated later in the report.
5 Those levels of competence are qualitative in nature, even though they are parameterized by some thresholds of the test scores.
Acknowledgements: Thanks are due to Juan D. Moreno-Ternero for helpful discussions on an earlier version of this work and to Ildefonso Méndez for his assistance with the data. Financial support from Ministerio de Educación y Ciencia e Innovación, Junta de Andalucía, and FEDER, under projects ECO2012-34928, PROMETEO2013-037, ECO2010-21706, and SEJ-6882, is gratefully acknowledged.
References
Abul-Naga, Ramses & Yalcin, Tarik (2008). ''Inequality measurement for ordered response health data'', Journal of Health Economics, Vol. 27, pp. 1614-1625. [ Links ]
Allison, R. Andrew & Foster, James (2004). ''Measuring Health Inequality Using Qualitative Data'', Journal of Health Economics, Vol. 23, Issue 3, pp. 505-524. [ Links ]
Arneson, Richard (1989). ''Equality and equal opportunity for welfare'', Philosophical Studies, Vol. 56, pp. 159–194. [ Links ]
Almas, Ingvild; Cappelen, Alexander; Lind, Jo Thori; Sorensen, Erik & Tungodden, Bertil (2011). ''Measuring unfair (in)equality'', Journal of Public Economics, Vol. 95, Issue 7-8, pp. 488-499. [ Links ]
Bleichrodt, Han & van Doorslaer, Eddy (2006). ''A welfare economics foundation for health inequality measurement'', Journal of Health Economics, Vol. 25, Issue 5, pp. 945-957. [ Links ]
Bossert, Walter (1995). ''Redistribution mechanisms based on individual characteristics'', Mathematical Social Sciences, Vol. 29, pp. 1–17. [ Links ]
Bossert, Walter & Fleurbaey, Marc (1996). ''Redistribution and compensation'', Social Choice and Welfare, Vol. 13, Issue 3, pp. 343–355. [ Links ]
Bourguignon, François; Ferreira, Francisco H. & Menendez, Marta (2007). ''Inequality of opportunity in Brazil'', Review of Income and Wealth, Vol. 53, Issue 4, pp. 585–618. [ Links ]
Calo-Blanco, Aitor & García-Pérez, J. Ignacio (2012). ''On the welfare loss caused by inequality of opportunity'', The Journal of Economic Inequality, DOI 10.1007/s10888-013-9247-6. [ Links ]
Checchi, Daniele; Peragine, Vito (2010). ''Inequality of opportunity in Italy'', Journal of Economic Inequality, Vol. 8, Issue 4, pp. 429-450. [ Links ]
Cohen, G.A. (1989). ''On the currency of egalitarian justice'', Ethics, Vol. 99, No. 4, pp. 906–944. [ Links ]
Fleurbaey, Marc (1995). ''Equality and responsibility'', European Economic Review, Vol. 39, Issue 3-4, pp. 683–689. [ Links ]
Fleurbaey, Marc (2008). Fairness, Responsibility, and Welfare. Oxford: Oxford University Press. [ Links ]
Goerlich, Francisco & Villar, Antonio (2009). Desigualdad y Bienestar Social: de la Teoría a la Práctica. España: Fundación BBVA. [ Links ]
Herrero, Carmen & Villar, Antonio (2013). ''On the Comparison of Group Performance with Categorical Data'', PLoS ONE, Vol. 8, No. 12. [ Links ]
Herrero, Carmen; Méndez, Ildefonso & Villar, Antonio (2014). ''Analysis of Group Performance with Categorical Data when Agents are Heterogeneous: The Evaluation of Scholastic Performance in the OECD through PISA'', Economics of Education Review, Vol. 40, pp. 140-151. [ Links ]
Lefranc, Arnaud; Pistolesi, Nicolas & Trannoy, Alain (2008). ''Inequality of opportunities vs. inequality of outcomes: Are western societies all alike?'', Review of Income and Wealth, Vol. 54, pp. 513-546. [ Links ]
Lefranc, Arnaud; Pistolesi, Nicolas & Trannoy, Alain (2009). ''Equality of opportunity and luck: definitions and testable conditions, with an application to income in France'', Journal of Public Economics, Vol. 93, Issue 11-12, pp. 1189-1207. [ Links ]
OECD (2010). PISA 2009 Results: Overcoming Social Background (vol. II). París: OECD Publishing. [ Links ]
OECD (2013). PISA 2012 Results: Excellence through Equity (vol. II). París: OECD Publishing. [ Links ]
OECD (2014). PISA 2012 Results: What Students Know and Can do: Student Performance in Mathematics, Reading and Science (vol. I). París: OECD Publishing. [ Links ]
Roemer, John. E. (1996). Theories of Distributive Justice. Cambridge, MA: Harvard University Press. [ Links ]
Roemer, John E. (1998). Equality of Opportunity. Cambridge, MA: Harvard University Press. [ Links ]
Ruiz-Castillo, Javiel. (2003). ''The Measurement of Inequality of Opportunities'', Research in Economic Inequality, Vol. 9, pp. 1-34. [ Links ]
Stiglitz, Joseph; Sen, Amartya & Fitoussi, Jean Paul (2009). ''Report by the Commission on the Measurement of Economic Performance and Social Progress''. Retrieved from: http://www.stiglitz-sen-fitoussi.fr/en/index.htm [ Links ]
United Nations (2010). Human Development Report. The Real Wealth of Nations: Pathways to Human Development. New York: United Nations Developtment Programme. [ Links ]
Villar, Antonio (2005). ''On the Welfare Evaluation of Income and Opportunity'', Contributions to Theoretical Economics, Vol. 5, Issue 1. [ Links ]
Zheng, Buhong (2011). ''A new approach to measure socioeconomic inequality in health'', Journal of Economic Inequality, Vol. 9, Issue 4, pp. 555- 577. [ Links ]
APPENDIX