Servicios Personalizados
Revista
Articulo
 Inglés (pdf)
 Articulo en XML
 Referencias del artículo
 Enviar articulo por email
Indicadores
-
 Citado por SciELO
 -
 Accesos
Links relacionados
-
 Citado por Google
 -
 Similares en
SciELO
Similares en
SciELO -
 Similares en Google
Compartir

 Permalink
Lecturas de Economía
versión impresa ISSN 0120-2596
Lect. Econ. no.83 Medellín jul./dic. 2015
https://doi.org/10.17533/udea.le.n83a04
ARTICLES
Assessing Educational Unfair Inequalities at a Regional Level in Colombia1
Una evaluación de la desigualdad de oportunidades educativas a nivel regional en Colombia
Une évaluation des inégalités des chances dans l'éducation au niveau régional en Colombie
Luis Gamboa*; Erika Londoño**
* Member of the Research Office at ICFES. Address: Carrera 7 No 32-12 piso 27. Email: lfgamboa@gmail.com.
** Student at the Master in Economics Universidad del Rosario. Email: erilorte89@gmail.com.
–Introduction. –I. The Equality of Opportunities Literature. –II. Methodology and Data. –III. Results. – Discussion. – Appendix. – References
Primera versión recibida el 16 de mayo de 2014; versión final aceptada el 22 de septiembre de 2014
ABSTRACT
This document aims to provide evidence regarding the existence of different patterns in equality of opportunities in academic achievement during the last fifteen years in Colombia. The outcomes selected for measuring inequality are the scores obtained on the national test Saber 11 in math as well as reading. It is found that inequality has increased during this period, and that this trend is common for all the metropolitan areas included in the analysis. Most of the increase found comes from factors related to the school market. It is found that inequality of opportunities is higher than 20% in almost all the studied areas.
Key words: inequality of opportunities, education, test Saber 11, Colombia.
JEL Classification: I24, O15, O54.
RESUMEN
El objetivo de este documento es proveer evidencia sobre la existencia de diferentes patrones de igualdad de oportunidades en el logro académico durante los últimos quince años en Colombia. Las variables seleccionadas para esta medición son los puntajes de matemáticas y lectura de la prueba nacional Saber 11. Se encuentra que la desigualdad ha crecido durante este lapso de tiempo y que esta tendencia es común para todas las áreas metropolitanas analizadas. Gran parte de este incremento se debe a factores relacionados con el mercado escolar. La desigualdad de oportunidades supera el 20% en la mayoría de áreas estudiadas.
Palabras clave: desigualdad de oportunidades, educación, prueba Saber 11, Colombia.
Clasificación JEL: I24, O15, O54.
RÉSUMÉ
Cet article fournit des éléments de preuve concernant l'existence de différentes explications dans l'égalité des chances dans la réussite scolaire au cours des quinze dernières années en Colombie. Les variables sélectionnées dans cette études ont été obtenues à partir des scores des élevés dans l'examen d'Etat Saber 11 (Le Bac) en mathématiques et lecture. Nous constatons que l'inégalité des chances a augmenté pendant cette période, et que cette tendance est commune pour toutes les régions métropolitaines de Colombie inclues dans notre étude. Cette augmentation provient de facteurs liés au marché de l'éducation. L'inégalité des chances est supérieure à 20% dans presque toutes les zones étudiées.
Mots-clés: inégalité des chances, éducation, examen d'Etat Saber 11, Colombie.
Classification JEL: I24, O15, O54
Introduction
Economists explicitly recognize that education has an important economic value (Schultz, 1963; Becker, 1964; Hanushek and Woessmann, 2007). Educational outcomes are important means for achieving a wide array of personal goals. Indeed, educational achievements on basic education can be good predictors not only of an individual's future earnings capacity, but also of the access to college and of the social position that the individual will hold in the future. There is evidence indicating that test scores and future productivity are correlated (Currie and Thomas, 2001). Furthermore, education is likely to be positively correlated to outcome variables or "advantages" valued by various theories of distributive justice, and not exclusively within the specific normative framework adopted by economists. In other words, being educated has an intrinsic value regardless of the effect that education might have on other contemporaneous or future goals. Moreover, from a macroeconomic viewpoint, education quality, as measured by test scores, seems to be a key determinant of economic growth (Hanushek and Woessmann, 2007). As a consequence, the existence of educational inequalities limits the achievement of development goals.
The unequal distribution of education matters for a number of reasons, which include limitations on economic growth, under-exploitation of potential positive externalities of education and the prospects of living a materially comfortable life. Inequalities due to choices made by individuals are acceptable because educational achievements depend on the own effort, but inequalities resulting from circumstances not controlled by the students are intolerable and unfair. The set of variables that are out of people's control is known as circumstances and those people who share any specific set of circumstances are part of one specific type. The analysis of inequalities caused by these circumstances is the main goal of the field of inequality of opportunities. The discussion about unfair inequalities in education has been extensively studied both from a theoretical and empirical perspective (Ferreira and Gignoux, 2011; Paes de Barros et al., 2009; Gamboa and Waltenberg, 2012; Wendelspiess and Soloaga, 2015; Roemer et al., 2003).
The purpose of this document is to measure unfair inequality levels in academic achievement in middle education among metropolitan areas in Colombia. We use the equality of opportunities approach in order to obtain a more comprehensive idea about the sources of inequality. The empirical strategy deals with metropolitan areas instead of regions because of the notorious differences between the urban and rural populations in big regions compared to low density regions. This difference is very important in terms of the resources available to students in each metropolitan area. The selected outcome variable is the test score obtained in the SABER 11 test, which is the mandatory standardized exit test for middle education in Colombia.
However, this approach is not free of critics. First, our results are based on the fraction of the population that finishes secondary education. Latin American countries have been characterized by considerable drop-out levels in basic and secondary education. Thus, this fraction of the population does not benefit from the added value of education. Second, available information about student's performance does not allow us to have a detailed view of any trend surrounding equality indicators. Additionally, for some years (2004-2007) there is no available information about parents' schooling, which is the most used circumstance in the literature. Last but not least, the choice of the set of circumstances is not always free of subjectivity. More detail in the circumstances implies more precision in the space of opportunities faced by the individual but less variability in the samples with respect to statistical significance and unbiasedness. As a consequence, we provide an estimation of the lower bound of inequality, but it is a lower bound equally defined for all the metropolitan areas.
The document is divided as follows. Section I briefly summarizes the equality of opportunities approach, the previous attempts to measure it and the state of the art on regional equality in education in Colombia. Section II describes the methodology and the database used for the empirical section of the paper. Section III presents the results regarding the measurement of equality of opportunities and their relationship with educational indicators such as gross inequality and quality (average performance). The last section discusses the results and their implications for future research.
I. The Equality of Opportunities Literature
Equaliy of Opportunity (EOp) is a liberal-egalitarian theory of justice widely discussed in recent years since the contribution of John Roemer. This author states that inequalities due to different circumstances are intolerable, but inequalities due to choices made by individuals are acceptable (Roemer, 1998). Different methodologies have been proposed to empirically decompose inequalities and accurately identify the concept of EOp (e.g., Checchi, Peragine and Serlenga, 2010; Dunnzlauf et al., 2010). Pignataro (2012) and Ramos and Van de Gaer (2012) document the vast literature produced over the last ten years.
The equality of opportunities approach has been studied from two perspectives: ex ante and ex post. The former promotes the equality of outcomes among those people who belong to the same type –the set of people who face the same set of circumstances, making their values as equal as possible. In this context, any policy oriented toward the reduction of inequality of opportunity has to be focused on reducing inequalities between individual opportunity sets. Some examples of the ex-ante approach are Bourguignon, Ferreira and Meléndez. (2007), Ferreira and Gignoux (2011) and Lefranc, Pistolesi and Trannoy (2008). The second perspective (ex post) seeks to compensate for the inequality generated by different initial circumstances. This requires identification of the effort levels of individuals, and then an emphasis on the inequalities within groups of individuals at the same effort levels. There is equality of opportunity if the same outcome is achieved for those who exert the same effort. This approach has been empirically used by Checchi et al. (2010), Pistolesi (2009), Lefranc, Pistolesi and Trannoy (2009), Gamboa and Waltenberg (2012) and De Carvalho, Gamboa and Waltenberg (2013).
The convenience of using each of the previous frameworks depends on the kind of public policy designed to fight inequality. The ex ante approach contains those policies that tend to reduce outcome inequalities among opportunity sets. In contrast, the ex post approach includes policies targeted at compensating individuals who exert the same effort. Roemer's approach calls for a fair method that does not generate adverse incentives. Following Pignataro's argument, "it is necessary to distribute goods to neutralize unequal initial conditions but efficiency-based goals must also be considered" (p. 803). This idea is crucial for the comprehension of this field by the theory of distributive justice because the goal should not be the "leveling down" of those individuals with marked advantages. Some advantages can be understood as circumstances, generating methodological problems for the equality of opportunities approach.
Since the distinction between what is a circumstance and what is not is at the core of the problem, it is necessary to discuss this distinction. Each individual is responsible for its own choices. The effort involved in seeking any specific goal is a function of her position in the type distribution. That is, when the population is divided into n types, those individuals located at the same percentile of each distribution are assumed to have similar effort levels. Therefore, the expected outcome should be very similar. There is equality of opportunities when there are no differences a priori between the outcomes reached by one or another type. Some authors, such as Pignataro (2012) and Ramos and Van de Gaer (2012), have summarized the implications of the set of circumstances chosen, but the discussion remains unsolved. That is, there is not a unique set of variables employed along the literature. For example, scores in math should be very similar between boys and girls with equal socioeconomic and genetic conditions.2 Then, gender might be an important circumstance to be included in applications of this approach to education. Following Pignataro (2012), a society "should split equally the means to reach a valuable outcome among its members; once the set of opportunities have been equalized, which particular opportunity, the individual chooses from those open to her, is outside the scope of justice" (p. 801). This approach calls for an initial intervention that eliminates or compensates ex ante inequalities.
Then, the crucial step on education is the definition of any threshold that splits the set of inequality sources between those that are controllable by the individual and those that are not. Gamboa and Waltenberg (2012) discuss the trade-off between its definition and its statistical significance. Some of the variables used to determine whether the individual has control or not are socially determined by institutional arrangements or previous conditions.
Previous attempts to measure regional inequalities in Colombia have been analyzed during the last decade (Galvis and Meisel, 2010; Bonilla, 2011; Bonilla and Galvis, 2012; Vélez et al., 2011). There are a few works focused on inequality of opportunities (IOp) in education for Colombia. For instance, Gamboa and Waltenberg (2011) estimate equality of opportunities in academic achievement (math, reading and sciences) using Checchi et al. (2010) inequality decomposition method. According to their study, the Colombian school education system is a little more egalitarian than the Argentinian or the Brazilian one. In PISA 2009, equality levels decreased slowly and some rank reversal emerged. This approach is also employed by Gamboa (2012) in his study of the recent trends in unfair inequalities (inequality of opportunities) in the case of the scores obtained by the students on the SABER 11 test. In this case, the set of circumstances chosen are parents' level of schooling, gender and type of school (public or private).
Vélez et al. (2010) employ the human opportunity index (HOI) to measure inequality of opportunities for several services among which access to education is considered. This index is constructed to measure inequality of opportunities for dichotomous variables. They find that HOI increased 17% for the Colombian Human Opportunities Index, which is composed by 12 opportunities. The comparison of the seven regional areas that are significant in the Living Standards Survey (ECV in Spanish) reveals some convergence. They use several circumstances in their study and find that parent's schooling and household location (urban-rural) are highly important in explaining inequality.
Recently, Ferreira and Meléndez (2012) performed a diagnosis of inequality in Colombia for adults between 25 and 35 years old, using the approach proposed by Ferreira and Gignoux (2011) using several Living Standards Surveys (Encuesta de Calidad de Vida 1997, 2003, 2008 and 2010). They found that inequality in absolute terms is very high along the country, particularly in small towns and in the Atlántica and Pacífica regions, and compared to the other Latin American countries. The most important circumstances, according to their contribution, to the explanation of inequality are parent's education and the place of birth.
II. Methodology and Data
There are several approaches designed to quantify the degree of inequality in specific cases such as wealth, income, land and other outcomes (Bourgignon, Ferreira and Walton, 2007; Dardanoni et al., 2006; Ferreira and Gignoux, 2011; Lefranc et al., 2009; Paes de Barros et al., 2009; Checchi et al., 2010). These approaches can be classified into three different branches: First, Regression-based measures, characterized by using functional forms in order to estimate some outcome as a function of a set of variables representing circumstances and other aspects; Second, Non-parametric approaches: the main purpose is to describe and characterize the entire picture of inequality and not to provide a specific value. An important tool used in this branch is stochastic dominance analysis (Lefranc et al. 2009); Third, a Index decomposition: although it can also be located within group ii, it is better to set this method apart because the methodology used decomposes gross inequality into its "components" using alternative methods. On the one hand, Checchi et al. (2010) decompose gross inequality using smooth artificial distributions. On the other hand, Oppedisano and Turati (2015) use regression analysis to estimate the concentration index. They also decompose it through an elasticity method.
The empirical approach followed in this paper belongs to the regressionbased group of literature. In this case, the measurement of inequality needs some index with specific conditions such as invariance and scale translation. Ferreira and Gignoux (2011) propose a regression-based approach in which the outcome is explained by a set of exogenous covariates. We adopt this approach. Let Yi be the score obtained by the pupil i in a standardized test. Assume that Y is a function of the set of circumstances, C, other variables under her control summarized as effort, E, and an error term, e. Thus,
Y = F(C, E,e) (1)
It is clear that the degree of effort is crucial for achieving some specific goal, but it is difficult to recognize effort levels on teenagers. If effort is defined as a function of some circumstances and other random effects, E =αC + v, we can write the gross inequality as the sum of the inequality due to circumstances and the inequality resulting form other aspects such as effort.3 In Ferreira and Gignoux's (2011) words, efforts E can be influenced by circumstances C, but the reverse cannot happen. This assumption suggests that variables can only be treated as circumstances if they are predetermined and entirely exogenous to the individual. Then,
Var(Y) = Var(C) +Var(αC + v) +Var(e) (2)
The use of any inequality measure has to deal with scale invariance and translation invariance. The former requires that the index be insensitive to any re-scaling of the y vector: I(y) = I(φ), where y is the vector of interest and φ is a positive scalar. The latter implies that the index be insensitive to a translation of the y vector: I(y) = I(y + a),= wheyre a is a non-zero constant vector of the same dimension as y.4 Taking into account this constraints, Ferreira and Gignoux (2011) opt for variance because of its properties. Thus,
Var(Y) = βVar(C) +Var(u) , (3)
where β = (1 + α2) and Var(u) = Var(v) +Var(e). β captures the effect of circumstances (direct and indirect). As a result, individual elements of the vector β suffer from omitted variable biases related to these; but, as it was mentioned in the approach of Ferreira and Gignoux, the estimation of equality of opportunities can be carried out by using a regression model of Y as a function of the set of circumstances such that
Y = βC + u. (4)
Under this method, the r-squared coefficient of a regression of Eq (4), that is, the score achieved by student i in the subject j on the set of circumstances can be read as the percentage of unfair inequality or inequality of opportunities. This index has at least two advantages in practical terms. First, the r-squared coefficient is very easy to interpret since it belongs to the interval 0 < R2 < 1. A coefficient R2 =1 is a signal of high inequality of opportunities because it implies that the variance is completely explained by circumstances, and the opposite case (R2 = 0) means total equality. Second, the measurement of inequality through this index is a lower-bound of the real inequalities, since the introduction of additional circumstances into the regression does not reduce the r-squared coefficient (the r-squared coefficient does not decrease as the number of circumstances included increases). But this is also a lower-bound as a consequence of the omitted variable problem mentioned before. This is an important starting point because most of the discussion is about the eligibility of any particular circumstance and the most accurate definition of types.
The database employed in this paper is the result from merging information from test scores (Saber 11), the form C-600 and the municipal demographic data from the National Statistical Office (DANE). SABER 11 includes information about all students in the last year of secondary education who must take the national test Saber 11. This test is intended to obtain information about students' academic competences (mathematics, natural and social sciences, reading comprehension and other optional areas) and has been traditionally used by universities (mainly private ones) as a measure of academic performance. This test is carried out twice per year in order to obtain information about the pupils from the schools that follow different academic calendars. Although there are three different calendars (A, B and F), calendar A is most frequently used by students especially in public schools. There have been some changes in its structure, scale of scores, number of questions and main objectives during the last decade. These are important constraints when we are dealing with time comparisons. We mention below how we proceeded with thes constraints.
This database includes information from 1997 to 2012. The strategy adopted here consists of comparing the first set of years (1997-2003) against the last set (2008-2012).5
The final database, after cleaning missing information and the exclusion of students out of the 15-20 year age range, is done for reducing the dispersion in the characteristics of the population.6 Further, the sample is restricted to schools that provide education on a full-day or morning schedule, since some schools in Colombia serve different socioeconomic populations at various schedules.
As it was mentioned before, changes over time in test structure are important for the test score. In order to have similar and comparable statistical distributions, scores are standardized using mean and standard deviation from each test during each year.7
Data comparability is also improved by means of the construction of a balanced panel (3376 schools per year). This strategy allows us to control for changes in the structure of the student population and to avoid biased estimations from re-localization, or from creation or modification of the schools included in the sample. Two subjective choices are adopted: the choice of the circumstances and the definition of metropolitan areas. The criterion adopted for selecting the circumstances set is the availability of information. The main variables selected as circumstances are parents' schooling, gender and type of school (private or public). Parents' schooling and gender are household-factors and the type of school can be classified as a school factor. Although type of school can be seen as a result of effort made by parents, in many cases there is not the chance of choosing between both modalities. Then, we assume that this is one aspect that can be treated as a circumstance.
The assessment of regional disparities is always done with a subjective component related to the definition of the geographical units. In this case, the definition of geographic areas is based on the similitude of the geographic conditions and the importance of a big city in the region. Traditionally, most development analysis in Colombia has been undertaken at the regional level, but the definition of economic region used by the National Statistical Office is very wide and includes cities and small towns with very different characteristics. In addition, these regions do not have a unique government that allows us to assess their performance. In this paper, we choose the use of a metropolitan area approach. The advantage of this approach lies in the similarity in the living conditions faced by the students in each area and the influence of a big city on the small cities located around it.
As a result, there are 6 main metropolitan areas considered in this study (Bogotá, Medellín, Cali, Barranquilla, Armenia and Bucaramanga). Each area is composed of a big capital city and a set of small towns surrounding it (Table 1). Although the definition of each area or the number of areas can be subjective, our strategy shows that the inclusion or exclusion of any small city does not produce an important change in the estimations.
Table 1 summarizes the geographic composition and its importance with respect to the total population. We only show a few years (initial and final) in order to provide a gross description of how the student population changed during this period over the sample of schools.
During this period, the two most populated areas (Bogotá and Medellín) increased their total population with respect to the other areas. However, the number of enrolled students was rather stable. This fact is the result of multiple factors. First, the demographic change exhibited during the 1980s and 1990s was more evident in the big cities, where the demand for children decreased as a result of the opportunity cost of having children for more educated families. Second, there was a considerable change in the supply of education provided by the private sector. Two important and frequent facts were the creation of new models of schools and the re-location out of the cities. The combination of these factors has implications for the evolution of the opportunities available for all the students and other unobserved factors. In order to reduce the bias coming from unobserved factors, we choose a balanced sample of schools. This strategy does not avoid all problems but it allows us to compare the same set of schools over time.
The study of quality changes is measured by average scores in Saber 11 in relative terms (Figure 1). That is, the main goal is to assess how far the scores are from each other during a short period. In 1997, Bucaramanga and Bogotá exhibited the highest performances while Armenia and Cali performed the worst. For that year, the rankings are similar in math, verbal and reading scores. Although it is common in the literature to work only with math and reading, science is also considered in this paper. At the end of the period, differences among areas have been reduced with rank reversals in some cases.
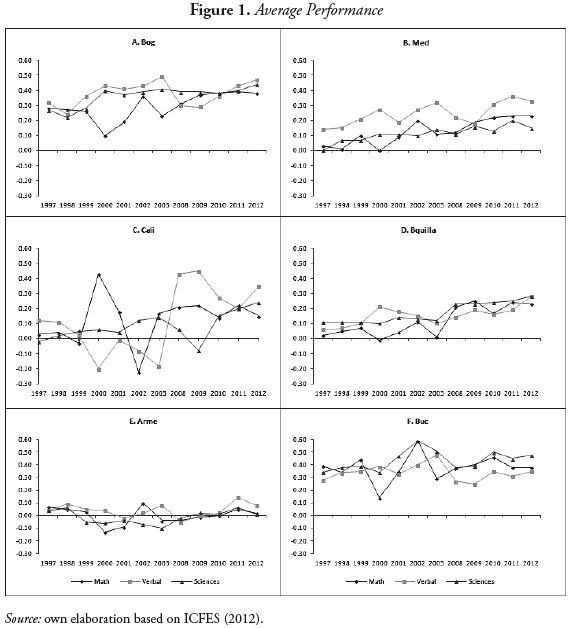
Bogotá obtained the highest average score in two of the three subjects and Cali improved its relative position. The set of municipalities belonging to the category "Other" underperformed compared to the national average and its performance is decreasing over time.
III. Results
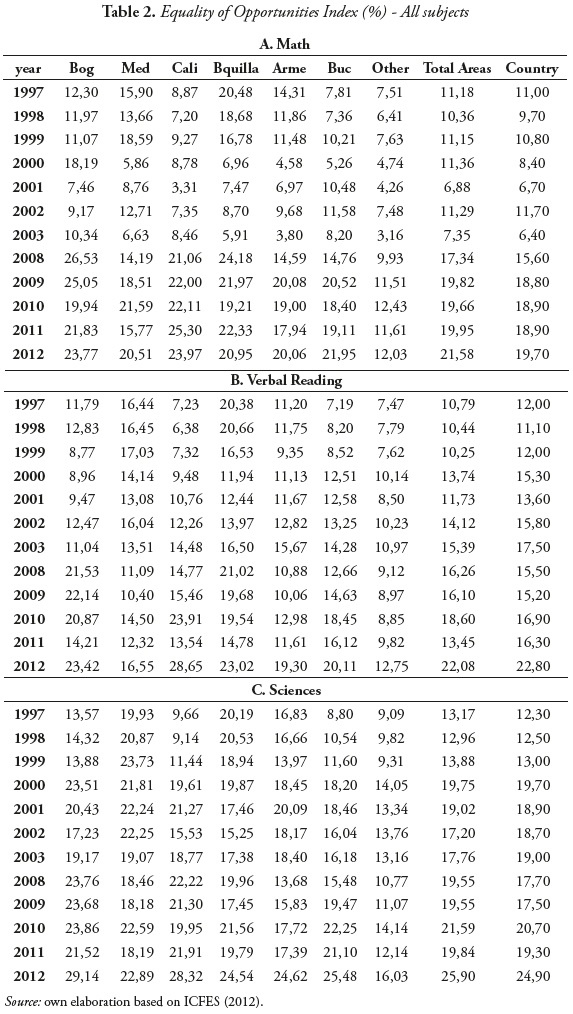
The estimation of inequality of opportunities is done by using Ferreira and Gignoux's approach (Table 2).8 This estimation employs gender, father's and mother's level of schooling, size of the city and type of school (calendar and management, private or public) as circumstances. These variables provide a good description about the opportunities faced by pupils. Although the type of school is questionable as a circumstance, its use comes from the fact that not all people can choose school even in the most developed cities. The set of circumstances can be divided into household and school factors. As a result, these findings are conditional on this set of variables.
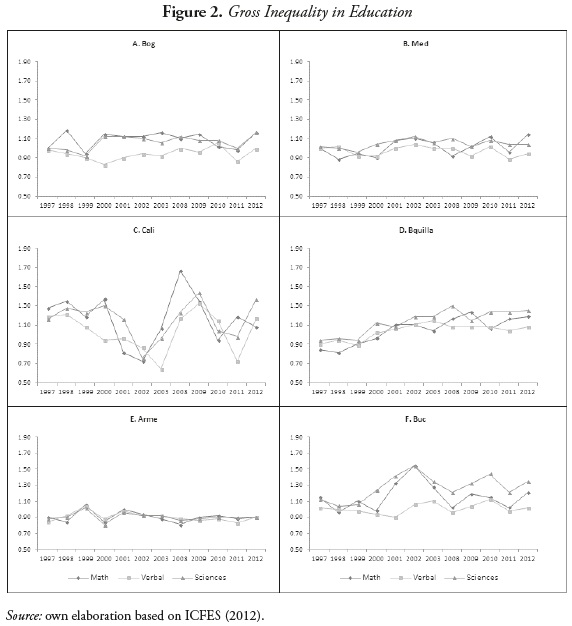
Ferreira and Gignoux (2011) starts from the fraction of gross inequality that is explained by the set of circumstances, which allows us to read the results in percentage terms. Gross inequality increased throughout the decade mainly in math and sciences and some regional disparities were evident in the three subjects during the last years of the last century (Figure 2).
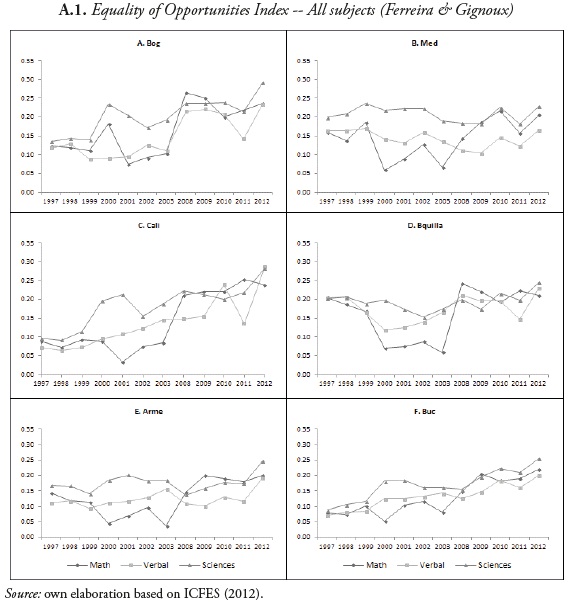
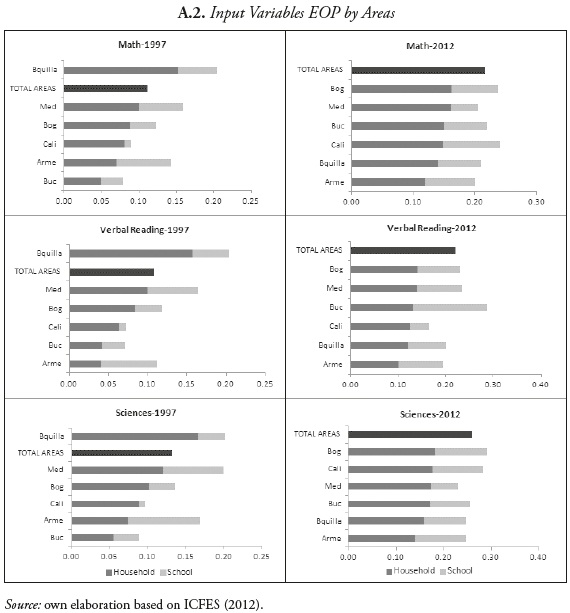
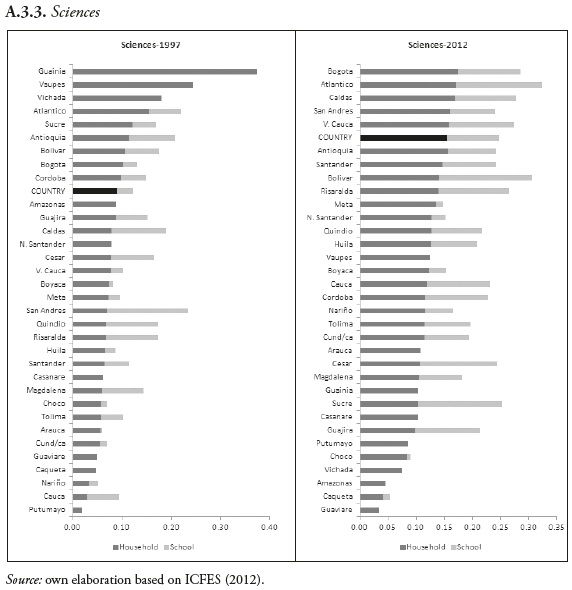
In terms of IOp, there is a common behavior for the three subjects used as outcomes (math, sciences and verbal): a decrease from 1997 to 2003 and a jump to a higher value in 2008 accompanied by a subsequent reduction (see Appendix A.1). The relative importance of inequality that comes from school factors rose during the period from 27% in 1997 to 40% in 2011 for math (38% to 48% in reading and 26% to 37% in sciences). This trend is very similar at both the metropolitan and state levels (see Appendix A.2. and A.3).9
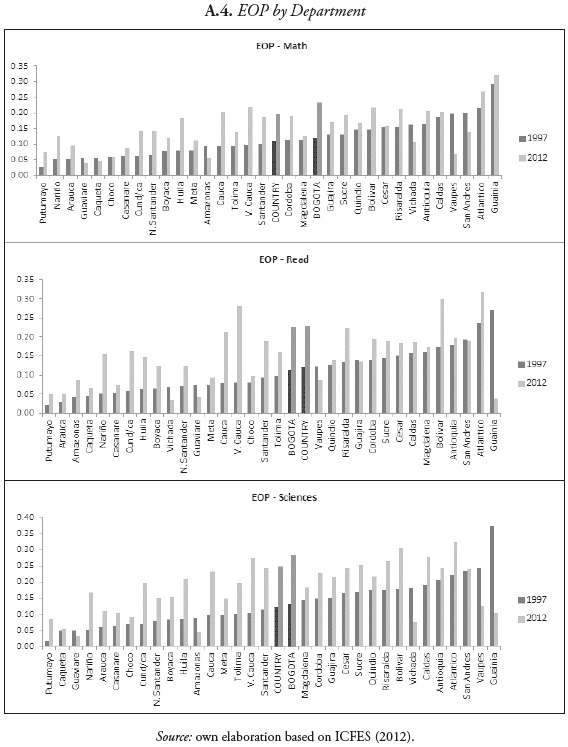
In general terms, equality of opportunities has deteriorated over the period with a notorious increase at the end. The size of the change is so evident that, while in 1997 about 11% of total inequality was explained by circumstances, this figure rose to 22% in math and reading (13% to 26% in sciences) at the national level in 2012 (see Appendix A.6). The evolution among metropolitan areas and subjects was diverse, and some show higher increases in equality than others.
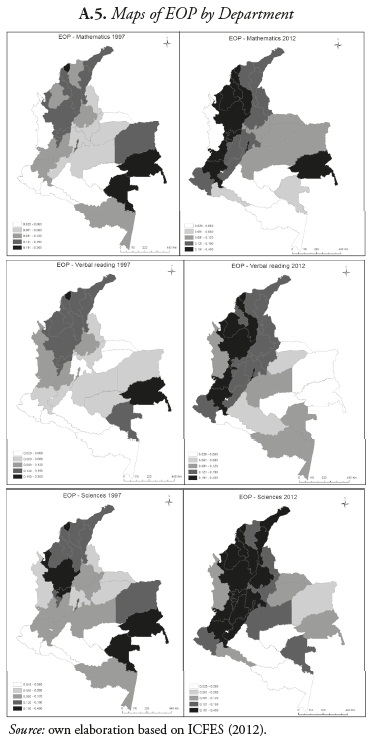
At the national level, unfair inequalities vary from 11% to 19.7% in math while sciences and reading vary from 12.3% and 12% in 1997 to 24.9% and 22.8% in 2012, respectively (Table 2). It is not clear what explains these differences, but it is important to mention some of them. During this period, Colombia faced two important facts that affected educational outcomes. First, policies intended to increase student retention (i.e. Familias en Acción) allowed low-income students to increase their chances of finishing middle education. Second, a new contract scheme was designed for teachers in the public sector to increase their quality. These changes might have influenced the composition of the student population and consequently inequality levels. The geographical evolution of IOp is plotted in Appendix A.5, in which the number of departments with high inequality increased regardless of the subject employed as outcome.
As a way to check the robustness of the results, a simple strategy consisting of adding or subtracting one municipality to each area is carried out. The results suggest that initial estimations are highly stable because there are no cases where the variation in inequality levels have been higher than 1% in these alternative area's definitions.10
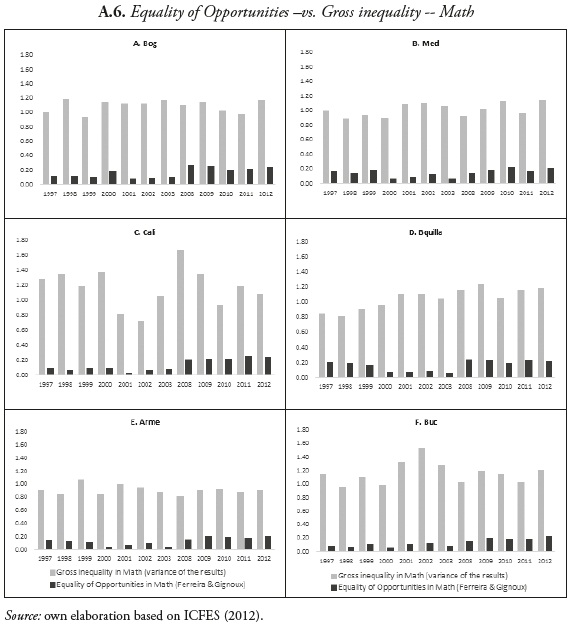
In what follows, a brief description of inequality evolution for each area is showed. Cali and Bucaramanga are characterized by considerable fluctuations, but at the end of the period gross inequality decreased. Cali faced the highest gross inequality during the first four years (Figure 2). Bucaramanga is located in second place in terms of gross inequality in 2002, with a rising trend toward the end of the period. In contrast, the area moved from the highest unfair inequality in 2001 to the lowest inequality. At the end of the period, Bogotá remains the most unequal area after Bucaramanga and Barranquilla. The latter is the most deteriorated region according to gross inequality on mathematics scores. However, its relative position changed from last place (most unequal) to second place. What is most important to note is the evolution of unfair inequalities over this decade. Additionally, Medellín was below or equal to the national average in terms of gross inequality in mathematics. This privileged position changed over time, as gross inequality increased during the first years of the simple period. At the end of the period, its inequality was similar to that of Bogotá.
In terms of inequality of opportunities, Cali is located as the most unequal area at the end of the period. Furthermore, there is not a notorious trend about academic performance of its students during the period (Figure 1). The level of inequality of opportunities grew during this period faster in Bogotá than in other regions, obtaining its highest value in 2008 (Table 2). This feature is accompanied by the fact that average performance is considerably high, although the structure of the population is very diverse. The evolution of inequality of opportunities is part of a rising trend, but as of 2009 it was changing more slowly than in other areas. One important aspect of this region is that lower inequality is accompanied by lower performance. This is the conjunction of two adverse factors that is not always desirable in educational policy. Medellín has improved its performance in other subjects as a result of multiple efforts to link several institutions, and now this gap with other regions has disappeared. In general terms, Bucaramanga and surroundings are characterized by outstanding performance in mathematics, even above other more developed regions such as Bogotá and Medellín.
The metropolitan area of Armenia is a small region in terms of economic activity, but it is the biggest in geographical size of the regions selected in this study. It is the only region that is located under the national average during the course of the decade in terms of gross inequality and showed small fluctuations with respect to the national average and the other metropolitan areas (Figure 2). However, the evolution of inequality of opportunities is similar to that exhibited in the other regions, and performance is lower with respect to other areas.
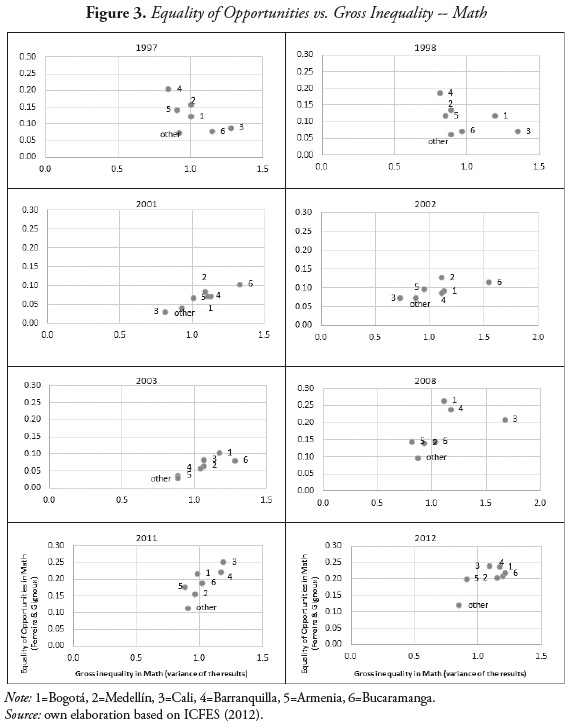
The correlation between gross and unfair inequality is depicted on Figure 3. This figure seems to suggest a positive association between them in 2001. Regions such as Bucaramanga (in 2001-2003) and Cali (2008) are located far from the group in the right-upper side of the figures.
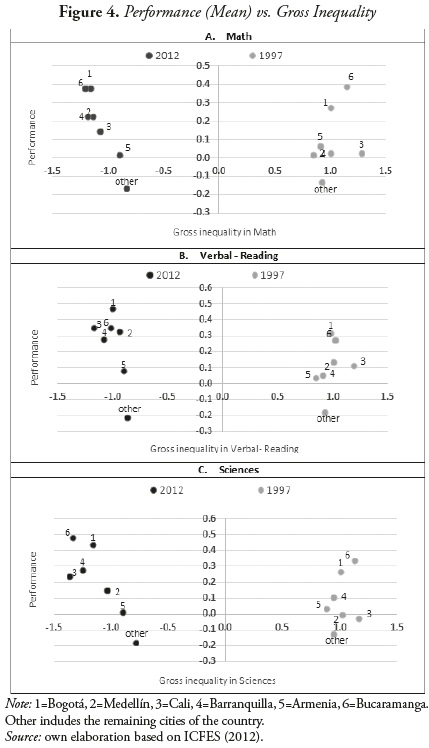
When two different indicators such as performance and equity are taken jointly, the relationship seems not to be unique (see Figure 4). This figure compares these two indicators for 1997 (right hand) and 2012 (left hand). Two interesting facts emerge. On the one hand, the average performance in math and sciences is very similar. There is less heterogeneity in verbal than in those subjects. On the other hand, with the exception of Cali, the remaining areas exhibit similar inequality levels and most of them are under the national average, which could be a consequence of the size of the control area (Other).
Additionally, IOp was decomposed between household and school factors following the procedure of Ferreira and Gignoux. At the beginning of the study period, home-related circumstances explain a larger fraction of unfair inequality than school-related circumstances in almost all the regions (see Appendix A.2.). In terms of home-related circumstances, Bogotá was the most unequal city in math with 16.2%, and Armenia was the least unequal (12%). Cali and Armenia had the highest inequality explained by school-related circumstances at the end of period in the same test subject (9.2% and 8.1%, respectively).
In the first years of our period, Barranquilla was stable but the most unequal region (20.5% to 21% in 15 years) in terms of IOp. On the contrary, Bogotá doubled its level by 2012, with a growth of 12 percentage points in mathematics (7.8% explained by household-related characteristics and 4.2% by school-related issues). However, there are many differences between the knowledge areas and it is not possible to assert which region is more or less unequal in all the subjects. For example, Cali has the greatest inequality in mathematics but in reading it has less inequality (24% and 17%, respectively).
Thus, the importance of school-related and household-related factors varied during the period. At the end of the period, household-factors explained inequality,11 while school-related factors had a major participation at the beginning of the period. Household-related factors played an equally important role within the level of unfair inequality in the three subjects.
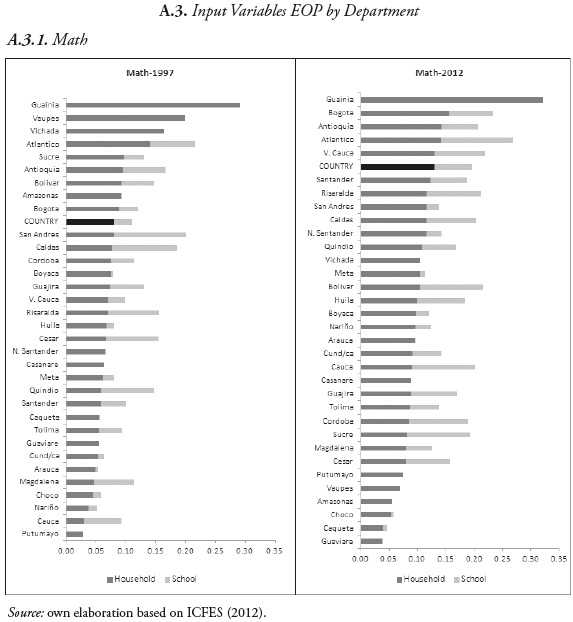
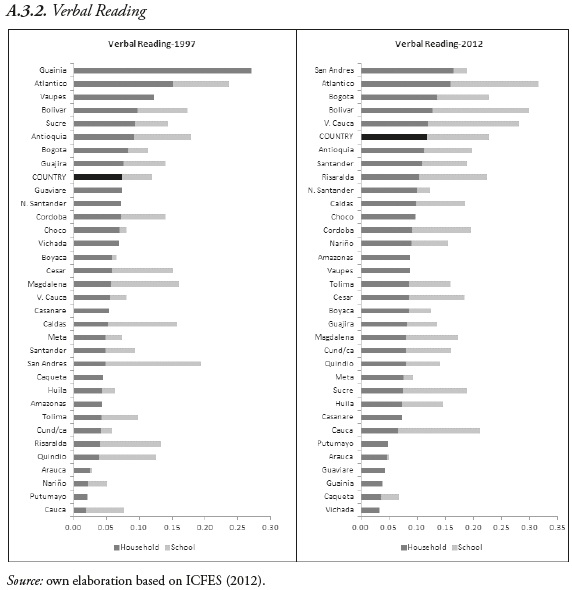
IOp was also estimated for "departments" (political entities) with some evident differences among them. There are departments where inequality is only explained by characteristics related to household factors (see Figure A.3). Most of these departments are part of the Orinoco and Amazon regions, which often have the lowest educational provision in the country. Guainía reaches a 32% level of inequality in mathematics test at the end of the period, while Guaviare displays the lowest inequality, 3.9%, for the same test. This indicates that there is significant heterogeneity in levels of parental education. In contrast, at the school level there are no differences, possibly due to low educational supply in these regions. In addition, we observe that there are large differences between knowledge tests during the study period. The most extreme case is still Guainía, whose math test is the most unequal in the whole period. It also turns out to be one of the regions with lower inequality in 2012 in reading and science. Those departments in which inequality is explained solely by parental education exhibit a reduction in gross inequality at end of the period.
These results allow us to highlight the dual structure of the provision of basic education because private schools do not offer middle education in some remote cities.
IV. Discussion
This document provides new evidence about the evolution of recent inequalities in academic achievements at a regional level in Colombia. Six metropolitan areas surrounding the highest and more developed cities are employed for the estimation of unfair inequality. The most important finding of this study is the rising level of inequality of educational achievement in all the metropolitan areas. In some cases, such as Bogotá and Cali, the increase in inequality was higher than 100% during this period. Although the choice of the set of circumstances is always questionable, it is clear that in this paper a lower bound of the inequality level has been obtained. The available set of explanations is wide and ranges from institutional to educational factors. From the institutional point of view, income inequalities have encouraged the segmentation of educational markets to such a level that the choice of school is used in some cases for locating socioeconomic segment. Private schools can be seen as "clubs" or means to strengthen "social networks". As a result, the incidence of students with highly educated parents in public schools decreased monotonically, generating higher differences in the quality of educational services between students from low-income households and those from middle- and high-income families.
On the educational side, an interesting question to solve for future research is to assess whether the ability of private schools to manage their inputs (teachers, laboratories, schedules, information and communication technologies) allows them to react faster to market changes than public schools.
Finally, these findings suggest that any policy designed to reduce unfair inequalities on basic and middle education should take into account parents' preferences and the structure of the supply of education.
NOTAS
1 The authors acknowledge the financial support provided by the "Fondo de Investigación Universidad del Rosario (DVG-061)" and the "Fundación para la Promoción de la Ciencia y la Tecnología of the Banco de la República" (No. 3227). They also acknowledge the access to data provided by ICFES and the research support provided by José Trujillo. We also acknowledge valuable comments provided by Leonardo Bonilla and Viviana García.
2 For more detail about this literature, see Peragine (1999), Peragine (2002), Peragine (2004a) and Peragine (2004b).
3 For our purpose it is not necessary to assess this last fraction of inequality.
4 See Zheng (1994) for details.
5 Data before 1997 and between 2004 and 2007 are not considered because, during these years, there is no information available about parents' schooling or even test scores (due to management problems at ICFES).
6 This is, however, an important fraction of the population who attend school, comprised mainly of students that are workers or already have a family.
7 This standardization process generates positive and negative scores depending on the relative performance against the population mean.
8 Inequality was also estimated by means of the decomposition of the concentration index suggested by Oppedisano and Turati (2012). The results are available upon request.
9 Although this measurement is not comparable at a state level, we also calculate EOP for all the states. Results are shown in Appendix A.4 and the maps in Appendix A.5.
10 These results are available in the working paper version of this study.
11 An exception is the case of Bucaramanga in the reading test.
References
Becker, Gary (1964). Human capital. New York: Columbia University Press. [ Links ]
Bonilla, Leonardo (2011). "Diferencias regionales en la distribución del ingreso", Revista Sociedad y Economía, No. 21, pp. 43-68. [ Links ]
Bonilla, Leonardo & Galvis, Luis Armando (2011). "Desigualdades regionales en el nivel educativo de los profesores en colombia", Revista de Economía Institucional, Vol. 14, No. 26, pp. 223-240. [ Links ]
Bourguignon, François; Ferreira, Francisco & Menéndez, Marta (2007). "Inequality of opportunities in brasil", Review of Income and Wealth, Series 53, No. 4, pp. 585-618. [ Links ]
Bourguignon, François; Ferreira, Francisco & Walton, Michael (2007). "Equity, efficiency and inequality traps: a research agenda", Journal of Economic Inequality, Vol. 5, Issue 2, pp. 235-256. [ Links ]
Checchi, Danielle; Peragine, Vito & Serlenga, Laura (2010). "Fair and unfair income inequalities in Europe". IZA Discussion Paper No. 5025. Institute for the Study of Labor (IZA). [ Links ]
Currie, Janet & Thomas, Duncan (2001). "Early test scores, socioeconomics status, school quality and future outcomes", Research in Labor Economics, Vol. 20, pp. 130-132. [ Links ]
Dardanoni, Valentino; Fields, Gary; Roemer, John & Sánchez, Maria Laura (2006). "How demanding should equality of opportunity be, and how much have we achieved?" In: Morgan, Stephen; Grusky, David & Fields, Gary (Eds.), Mobility and Inequality: Frontiers of research in Sociology and Economics (pp.59-82). Stanford: Stanford University Press. [ Links ]
De Carvalho, Márcia; Gamboa, Luis Fernando & Waltenberg, Fábio (2013). "Equality of educational opportunity employing PISA data: taking both achievement and acces into account". ECINEQ Working Paper N. 277. Society for the Study of Economic Inequality (ECINEQ). [ Links ]
Dunnzlauf, Lina; Neumann, Dirk; Niehues, Judith & Peichl, Andreas (2010). "Equality of opportunity and redistribution in Europe". IZA Discussion Paper No. 5375. Institute for the Study of Labor (IZA). [ Links ]
Ferreira, Francisco & Gignoux, Jeremie (2011). "The measurement of inequality of opportunity: Theory and an application to Latin America", Review of Income and Wealth, Vol. 57, Issue 4, pp. 622-657. [ Links ]
Ferreira, Francisco & Meléndez, Marcela (2012). "Desigualdad de resultados y oportunidades en colombia: 1997-2010". Serie Documentos Cede, 2012-40. Centro de Estudios sobre Desarrollo Económico (CEDE), Facultad de Economía, Universidad de los Andes. [ Links ]
Galvis, Luis Armando & Meisel, Adolfo (2010). "Persistencia de las desigualdades regionales en Colombia: un análisis espacial". Documentos de trabajo sobre Economía regional, No. 120. Banco de la República, Colombia. [ Links ]
Gamboa, Luis Fernando (2012). "Análisis de la evolución de la igualdad de oportunidades en educación media, en una perspectiva internacional. El caso de Colombia". En: ICFES, Estudios sobre la calidad de la Educación en Colombia (pp. 1-43). Bogotá: ICFES. [ Links ]
Gamboa, Luis Fernando & Waltenberg, Fábio (2012). "Inequality of opportunity for educational achievement in Latin America: Evidence from PISA 2006-2009", Economics of Education Review, Vol. 31, Issue 5, pp. 694-708. [ Links ]
Hanushek, Eric & Woessmann, Ludger (2007). "The role of education quality in economic growth", Policy Research Working Paper No. 41122. World Bank. [ Links ]
Icfes (2012). Estudios sobre la calidad de la Educación en Colombia. Bogotá: ICFES [ Links ]
Lefranc, Arnaud; Pistolesi, Nicolas & Trannoy, Alain (2008) "Inequality of opportunities vs. inequality of outcomes: are western societies all alike?", Review of Income and Wealth, Vol. 54, Issue 4, pp. 513-546. [ Links ]
Lefranc, Arnaud; Pistolesi, Nicolas & Trannoy, Alain (2009). "Equality of opportunity and luck: definitions and testable conditions, with an application to income in France", Journal of Public Economics, Vol. 93, Issue 11-12, pp. 1189-1207. [ Links ]
Oppedisano, Veruska and Turati, Gilberto (2015). "What are the causes of educational inequality and of its evolution over time in Europe? Evidence from PISA", Education Economics, Vol. 23, No. 1, pp. 3-24. [ Links ]
Paes de Barros, Ricardo; Ferreira, Francisco; Molinas, José & Saavedra, Jaime (2009). Measuring inequality of opportunity in Latin America and the caribbean. Washington D.C.: The World Bank. [ Links ]
Peragine, Vito (1999). "The distribution and redistribution of opportunity", Journal of Economic Surveys, Vol. 13, Issue 1, pp. 37-69. [ Links ]
Peragine, Vito (2002). "Opportunity egalitarianism and income inequality", Mathematical Social Sciences, Vol. 44, Issue 1, pp. 45-64. [ Links ]
Peragine, Vito (2004a). "Ranking income distribution according to equality of opportunity", Journal of Economic Inequality, Vol. 2, Issue 1, pp. 11- 30. [ Links ]
Peragine, Vito (2004b). "Measuring and implementing equality of opportunity for income", Social Choice and Welfare, Vol. 22, Issue 1, pp. 187-210. [ Links ]
Pignataro, Giuseppe (2012). "Equality of opportunity: policy and measurement paradigms", Journal of Economic Surveys, Vol. 26, Issue 5, pp. 800- 834. [ Links ]
Pistolesi, Nicolas (2009). "Inequality of opportunity in the land of opportunities, 1968-2001", Journal of Economic Inequality, Vol. 7, Issue 4, pp. 411-433. [ Links ]
Ramos, Xavier, and Van de Gaer, Dirk (2012). "Empirical approaches to inequality of opportunity: principles, measures and evidence". Working Papers 259. Society for the Study of Economic Inequality –ECINEQ– [ Links ].
Roemer, John (1998). Equality of opportunity. Cambridge, MA: Harvard University Press [ Links ]
Roemer, Jhon; Aaberge, Rolf; Colombino, Ugo; Fritzell, Johan; Jenkins, Stephen; Lefranc,... Zubiri, Ignacio (2003). "To what extent do fiscal regimes equalize opportunities for income acquisition among citizens?", Journal of Public Economics, Vol. 87, Issue 3-4, pp. 539-565. [ Links ]
Schultz, Théodore (1963). The economic value of education. New York, USA: Columbia University Press. [ Links ]
Vélez, Carlos; Azevedo, Joao & Posso, Christian (2011). Oportunidades para los niños colombianos: cuánto avanzamos en esta década. Colombia: Banco Mundial, Banco de la República de Colombia y Departamento Nacional de Planeación -DNP-. [ Links ]
Wendelspiess, Florian & Soloaga, Isidro (2015). "Scale vs. translation invariant measures of inequality of opportunity when the outcome is binary". Retrieved from: http://papers.ssrn.com/sol3/papers.cfm?abstract_id=2226822. [ Links ]
Zheng, Buhong (1994). "Can a poverty index be both relative and absolute?", Econometrica, Vol. 62, Issue 6, pp. 1453-1458. [ Links ]
Appendix