


 English (pdf)
 Article in xml format
 Article references
 Send this article by e-mail
 Cited by SciELO
  Cited by Google
  Similars in
SciELO
Similars in
SciELO  Similars in Google
 Permalink
Introduction
Based on the findings of Delbianco and Fioriti (2014; 2015) that Latin America had a bimodal normal distribution of breaks throughout the last 50 years, this paper attempts to further characterize the relationship between commodity prices and macroeconomic variables. In particular, our main hypothesis is that these series could be presenting some form of cointegration given the contemporaneity found in the mentioned studies.
For this purpose, and given the break approach, we test the difference between the said series. More specifically, we seek to test the stationarity of the differences in the growth rate of these series. The reasoning is the following: if these series are cointegrated, then when one experiences growth, then the other does too, so the difference between them should be stationary.
We use commodities price indexes as a means to understand the external sector of Latin American countries. We do not rely on prices reported by the countries for their exports because of several biases.1 Moreover, commodity price indexes need not be relevant for the current account if a country is diversified in its production. Thus, we test whether countries in the region had succeeded to escape from the sole production of commodities or not.
Our main hypothesis is that the economic performance of the external sector in the Latin American region is tied to the patterns followed by commodity prices. Moreover, we expect to find that some commodities are more relevant than others. We find evidence supporting our former hypothesis but not the latter. An important result is that breaks in macroeconomic variables and commodity prices follow a bimodal distribution over the last 60 years, with one mode around the 1970s and the other mode at the beginning of the twenty-first century.
Some facts about the world organization that took place during the period covered in this paper can be highlighted. New (strong) countries came into play, such as China (Gallagher & Porzecanski, 2010) and India, and other countries that were already important became more prominent, like Brazil and Russia. The emerging world became a fundamental actor in the new frame- work not only because of the crises suffered by developed countries (mainly after the fall of Lehman Brothers), but also due to the new trade links be- tween developing countries (south-south trade). In this new world setup, a new group called the MINTs-Mexico, Indonesia, Nigeria and Turkey-is gaining power after the BRICs-Brazil, Russia, India and China-(Akpan, Isihak & Asongu, 2014).
Regarding Latin America, we can observe the early 2000s very high economic growth in comparison to what had happened throughout the second half of the twentieth century, which is known in everyday language as “growing at Chinese rates”.
When it comes to forecast the future of these exceptional growing rates, it is crucial to understand the effects that a decrease in the world demand for commodities and raw materials would have. Some authors argue that Latin America has embarked in developmentalism processes for the last 50 years, but this paper supports those who believe that even today South America relies heavily on commodities to honor its contracts (Albrieu, 2012; Sachs & Warner, 2001; Frenkel & Rapetti, 2011). Although this paper focuses on the real effects of commodity price changes, there are several papers about the impact of such changes on inflation. Wei (2013) forecasts inflation with data on commodities. He finds out that commodity prices are generally considered to have more predictive power for inflation than manufactured goods prices do mainly because they are traded more frequently (Garner, 1989; Cody & Mills, 1991) and because of the like- lihood of short term contracts to be renegotiated after fluctuations (Bordo, 1980).2
Adding to this discussion, Bouoiyour and Selmi (2014) states that the relationship between price volatility and exports “depends closely to the degree to which the exports are diversified” (p. 230).
The paper is structured as follows: section I presents the methodology and datasets used. Section II shows the stylized facts obtained from the estimations. The last section concludes.
I. Methodology
Having in mind the presence of structural breaks in the series, we use a cointegration approach given the bimodal distribution of breaks found in Delbianco and Fioriti (2014, 2015). Our preliminary hypothesis is that the performance of the external sector of Latin American countries is heavily dependent on the trends of commodity markets. As a first approach, we look how close in time are the structural breaks of two of the main macroeconomic variables of the external sector for Latin American countries with the breaks experienced by commodity prices in the same period.
First, the years of each break follow a bimodal distribution as stated before. Moreover, there are almost no breaks in the 1950s, 1960s and 1990s. This is even more extreme for commodities: apart from a suggested break in 1988, there are no breaks outside the 1970s and the first decade of the twenty-first century.
In this paper, we look for breaks by testing the stationarity of the series individually. Unlike previous studies, we work only with the cyclical component of the series under research (macroeconomic variables and commodity price indexes). This is because we are interested in investigating the cyclical behavior and there is a strong trend component in the time series analyzed, which is even stronger when series cover many decades.
To isolate the cyclical component from the trend, we use the Hodrick- Prescott (HP) filter. Although there are several methods to obtain the cyclical behavior of a series, the HP filter is widely accepted and used in economics. Also, we have chosen this method for its simplicity and we still find that the cycle is not stationary.
We conduct the first attempt with the difference in levels, and then we continue with the difference in growth rates.3 There is a problem working with levels since the scale of the current account in US dollars is much larger than the scale of the price indexes, hence testing stationarity of the difference between these series results in testing stationarity of the current account with a small added noise. To circumvent this problem, we work with the difference in growth rates, so scales are the same.
We use three break tests because each of them accomplishes a different goal. First of all, the classic Augmented Dickey-Fuller test (ADF) looks for the existence of a stationary difference without any break. Secondly, the Zivot and Andrews test (ZA), in its different specifications, tests stationarity with one break. Finally, the test developed by Clemente, Montañés and Reyes (1998) searches for stationarity allowing for the presence of two breaks. Using two breaks is useful because it captures the bimodal distribution mentioned in Delbianco and Fioriti (2014).4 The tests and cointegration testing methods are described briefly in the following subsections.
A. Unit root tests and structural breaks
Our methodology is based on the idea of testing whether the difference between two series is stationary, which should indicate convergence between them. This study applies the ADF (Dickey & Fuller, 1979), the ZA (Zivot & Andrews, 1992) and the Clemente et al. (1998) tests. This allows a wider testing of unit roots.
The common unit root ADF test presents a limitation: it is biased not to reject the null hypothesis of a unit root in the presence of structural changes, and then to label the series as non-stationary. There are tests that help to identify a structural change, such as the Chow (1960) test; however, prior information about the existence of a potential turning point is needed. Alternatively, structural breaks can be detected by an iterative method.
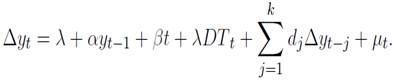
The ZA test offers an improvement with respect to previous tests: it determines endogenously the date of a structural break, as explained below. There are three possible specifications. Model I is specified to find a change of intercept, and the maximum lag of the series is chosen by the t test. Model II only allows changes in trend. Finally, model III evaluates the possibility of changes in both intercept and trend and uses the Akaike Information Criteria (AIC) to determine the maximum number of lags of the series. The significance level is 5% for the three possible breaks mentioned.
Model I: Model with intercept:
 (1)
(1)
Model II: Model with trend:
 (2)
(2)
Model III: Model with two specifications:
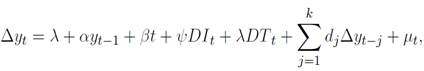 (3)
(3)
where γ is the intercept, βt is the trend,  are the lags and
µt
is the error term.
are the lags and
µt
is the error term.
As it can be seen, the specification is not far from the ADF test. The difference is that it adds the ψDIt and λDT t dummies to capture possible structural breaks, allowing for a change of the intercept or the trend, respectively, and it is detected endogenously.
The null hypothesis in the three models is that α = 0, i.e. there is no stationarity and there is no structural break, while under the alternative hypothesis there is stationarity and a structural break is proposed at some point in the time series.
We place our focus on the third model because this leaves open the possibility of the existence of breaks in both intercept and trend. The main idea is that either model I or model II is miss-specified, thus the test loses power. However, if model III is well specified and the true underlying model is I or II, the loss of power gets reduced (Sen, 2004; Liew, 2004).
Finally, to detect two structural breaks, Clemente et al. (1998) extends the Perron and Vogelsang (1992) test. Thus, the structure of this test is as follows:
The null hypothesis in this test is
 (4)
(4)
The alternative hypothesis has the following form:
 (5)
(5)
where DT Bi,t is a dummy variable that takes on value 1 if t = T Bi + 1 (i = 1, 2) and 0 otherwise, while DU i,t = 1 if t > T Bi (i = 1, 2) and 0 otherwise. Those periods in which the breaks occur are denoted by T B 1 and T B 2, where i indicates the two breaks.
Two different specifications of the test, with additive outliers (AO) and innovative outliers (IO), are introduced. In the latter case, the functional form of the unit root that is tested is
 (6)
(6)
The testing method minimizes the value of a pseudo t ratio.5
In the case of additive outliers, the model tested is similar but without the deterministic part:
 (7)
(7)
and the test of ρ is performed on
 (8)
(8)
The work of Clemente et al. contains finite properties and the critical values of the statistics used.
B. Cointegration Analysis6
The series used to test the unit root in this paper arise from the difference between the growth rates of the macro variables and the growth rates of the price indexes as follows:
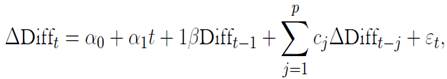 (9)
(9)
Where 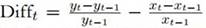 is the difference between the growth rate of y and the growth rate of x, y denotes the price indexes (soybeans, agriculture, metals, energy and non- fuel). The lags are denoted by p, which are included to prevent autocorrelation issues.
C. Data
The dataset published by the Economic Commission for Latin America and the Caribbean (CEPAL, for its initials in Spanish) (2009), provides data from 1950 to 2008. Also, we use several indexes of commodity prices obtained from the International Monetary Fund (IMF). The indexes correspond to the prices of soybeans, agriculture in general, energy, non-fuel and metals. Among those indexes, only soybeans represent a single good while the others represent a bundle of commodities. We choose data on current account and exports for the Latin American economies. The countries analyzed are Argentina, Bolivia, Brazil, Chile, Colombia, Costa Rica, Dominican Republic, Ecuador, El Salvador, Guatemala, Haiti, Honduras, Mexico, Nicaragua, Panama, Paraguay, Peru, Uruguay and Venezuela.
The data on current account and exports provided by CEPAL are split in two series: one runs from 1950 to 1984 with base year 1970, and the other one goes from 1980 to 2008 with base year 2000. In order to merge both series, we use the following formula7:
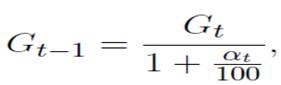 (10)
(10)
where Gt is the value in year t of the series to merge and αt is the growth rate of the variable from t − 1 to t expressed in terms of period t − 1.
II. Results
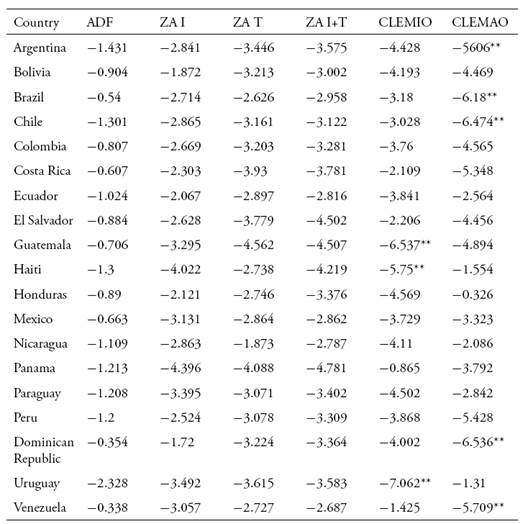
After performing the tasks presented in the methodology, we obtained several results that are presented in the Tables 1 to 10. Each table shows the test statistics of stationarity of the difference between the growth rates of each macroeconomic variable and each price index, the title of each table specifying which difference is concerned. The results of each test performed are displayed in the columns as follows: Augmented Dickey-Fuller test (ADF), Zivot-Andrews break test with intercept (ZA I), Zivot-Andrews break test with trend (ZA T), Zivot-Andrews break test with intercept and trend (ZA I+T), Clemente et al. innovative outliers break test (CLEMIO), and Clemente et al. additive outliers break test (CLEMAO).
Table 1 Soybeans Index and Current Account (Tests statistics)

Note: *,** and ***: significance at 10, 5 and 1% level.
Source: authors’ elaboration
Table 2 Agriculture Index and Current Account (Tests statistics)

Note: *,** and ***: significance at 10, 5 and 1% level.
Source: authors’ elaboration.

Table 4 Metals Index and Current Account (Tests statistics)

Note: *,** and ***: significance at 10, 5 and 1% level.
Source: authors’ elaboration
Table 5 Non-Fuel Index and Current Account (Tests statistics)

Note: *,** and ***: significance at 10, 5 and 1% level.
Source: authors’ elaboration.
Table 6 Soybeans Index and Exports (Tests statistics)

Note: *,** and ***: significance at 10, 5 and 1% level.
Source: authors’ elaboration.
Table 7 Agriculture Index and Exports (Tests statistics)
Note: *,** and ***: significance at 10, 5 and 1% level.
Source: authors’ elaboration.

We do not include the tables referred to the estimation performed in levels because stationarity was rarely observed in the corresponding series due to the scale problem mentioned in the introduction.8 Given this fact, we discuss the difference of the series and the difference of the growth rates of the series indistinctively.
Several stylized facts are worth being noted: first, there exists a stationary relation regarding the difference between the cycle of the current account and the commodity price indexes used for Latin American countries. Second, there is no clear evidence of cointegration between the commodity price indexes and exports. Third, the significance of the Clemente et.al. test suggests that a bimodal distribution is present.
Regarding the first stylized fact, there are some issues that require further explanation. First, the cointegration pattern of the current account and the price indexes takes place in Latin America but not in the Caribbean. This seems plausible given the strong dependence of the region on commodities, while the Caribbean relies more on tourism and other economic activities. In terms of robustness, the fact that the cycles are cointegrated irrespective of the number of breaks considered is striking.
Since cointegration does not take place between exports and the commodity price indexes, neither in levels nor in growth rates, it seems that the exports cycle follows a random walk even if we include several breaks. This pattern is common in all the countries considered.
The difference between the growth rates of the current account and the price indexes is cointegrated when using two breaks, as is the case of the Clemente et al. test, suggesting that two breaks may have taken place throughout the last 60 years in the region. This result goes in line with the findings of Delbianco and Fioriti (2014) that Latin American countries had a bimodal distribution of breaks, with the first mode in the late 1970s and the second one at the beginning of the twenty-first century.
Conclusions
In this paper, we find evidence of strong cointegration between the cur- rent account and commodity prices since their difference is stationary when expressed in terms of growth rates. In line with the ideas developmentalism, we show that Latin America still depends heavily on commodities and any effort to predict future growth should take this issue into account.
Since the results are significant for Latin America but not for the Caribbean, an important area of future research deals with which prices are relevant to explain the current account in the Caribbean. It looks like tourism might be important; but, since it is not traded in international markets, it is difficult to find a proper index of tourism prices.
Also, another methodology that could be used is the Engle-Granger cointegration analysis, specifying a functional form to model dependence of the current account on commodity prices. The most promising research agenda has to do with finding more evidence about the stationarity of the current account cycles and the random walk nature of the exports cycles. Intuition points to the former being attributable to the opposite effects on the current account of exports and imports, while the latter may be due to poor institutions.
Finally, some further research should be conducted to explain why the last 50 years of Latin American history can be summarized in a bimodal distribution of breaks related to two big sudden stops suffered by the region.

