


 Inglês (pdf)
 Artigo em XML
 Referências do artigo
 Enviar este artigo por email
 Citado por SciELO
  Citado por Google
  Similares em
SciELO
Similares em
SciELO  Similares em Google
 Permalink
I. Introduction
The export-led model states that exports are the basis for growth in a region’s production levels, and therefore, promoting the export sector should be an economic policy priority to improve economic indicators such as gross domestic product (GDP), thereby improving employment levels and economic stability. Moreover, the Andean Community (Comunidad Andina de Naciones-CAN) countries have experienced an average per capita GDP growth (in current dollars) of 7% annually from 1970-2010 (Comunidad Andina de Naciones, 2010, p. 1), which reveals growth in production in these countries. This makes it possible to ask whether the export-led model’s economic growth hypothesis has been realized in the economies of the CAN countries. To respond affirmatively to this question implies that the economic policies of Bolivia, Colombia, Ecuador, and Peru (the current CAN members) should revolve around “the expansion of markets for local production and the attraction of new investment for the basic industry sector through instruments such as promotion and information programs, and direct and indirect subsidies for investors” (Gaviria Ríos, 2010, p. 1).
A study titled “How stable is the export-led growth hypothesis? Evidence from Asia’s Four Little Dragons” focuses on the economies of Hong Kong, South Korea, Singapore, and Taiwan. In general, the study proposes two econometric models to establish the veracity of the export-led model. The first model relates the natural logarithm of GDP with the natural logarithm of exports, while the second model includes the natural logarithm of the real exchange rate as the second independent variable. The study applies the modified Wald causality test (MWald) and the rolling regression technique to establish whether there is causality between EXP and GDP. The results obtained are not constant throughout the period studied, nor are they constant among the four economies analysed. Therefore, we cannot conclude with certainty that the export-led hypothesis is valid. This aligns with the main recommendation made by Tang et al. (2015):
“for the four economies to re-assess their growth strategies which are overly dependent on exports to developed countries. However, these four economies cannot completely discard their export-oriented policies given that their domestic markets are relatively small. New policy strategies aimed at diversifying export markets through regional integration should be implemented immediately” (p. 235).
Another study1 on this subject is “The Export-Led Growth: A Case Study of Costa Rica,” in which Johansen cointegration and Granger tests are conducted to establish long-term causality between EXP and GDP. The results obtained for the period 1980-2013 reveal that “exports and real GDP of Costa Rica have a long-run relationship and there is a unidirectional causal relationship from economic growth to export” (Gokmenoglu et al., 2015, p. 476); therefore, the level of exports is not a variable that can explain economic growth. Yet another example is “The role of export composition in export-led growth in Australia and its regions.” In this study, the exportled growth hypothesis is tested through a sectoral (agriculture, mining, fuels, manufacturing, and others) study of exports and their relationship with GDP at the national and regional levels. The authors, Shafiullah et al. (2017), conclude that “ELG (Export Led Growth) is validated in Australia in the long-run. In addition to being ‘Mining and Fuels’-led, ELG is seen to be led nationally by Agriculture, Manufacturing, and Other exports in Australia. Among the regions, the growth path is found to be unique for each region based on the causality tests and long-run equation estimations” (p. 71). The contradictory conclusions of these studies do not allow us to settle on the notion that the growth hypothesis proposed by the export-led model is entirely valid.
At their 1989 Galapagos meeting, the CAN countries developed a strategic design and work plan to create a new model that would replace the import substitution model, and “with this model, the Andean countries eliminated tariffs among themselves and formed a free trade zone in 1993 in which goods could flow freely” (Comunidad Andina de Naciones, 2018). This article is grounded on a hypothesis that is based on accepting the fact that the increase in trade among the CAN countries has generated higher EXP growth for Bolivia, Colombia, Ecuador, and Peru. However, the behaviour of the EXP variable is not believed to explain the behaviour of the GDP variable during the post-1990 period. Namely, this study seeks to prove that the export-led model is not valid for the CAN, so its main objective is to empirically test the applicability of the export-led model in the economies of the countries belonging to the Andean Community. Acceptance of the proposed hypothesis implies questioning the application of economic policies based on export promotion as a driving force for economic growth.
II. Materials and Methods
The methodology applied in this study is based on the work of Tang et al. (2015) and can be summarised as follows:
Creation of a regression model that represents the causality relation between EXP and GDP, as established in the export-led model.
Cointegration test between EXP and GDP.
Block Exogeneity Wald test.
These steps are described in detail in the following section.
A. Export-Led Model
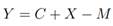
The export-led model is a Keynesian approach that is a variant of the Hoyt model, which was developed in the 1950s by Charles Tiebout and Douglas North: “They replace the physical variables of Hoyt’s model with aggregate macroeconomic variables - income, demand internal and external to the region - to determine the economic growth of areas rather than their physical development” (Gaviria Ríos, 2010, p. 1). The model is based on the Keynesian demand equation and assumes that public expenditure (G) and taxes (T) are zero (G and T = 0), giving:
 (1)
(1)
Where:

with
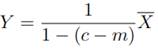
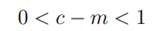
 as an exogenous variable, so that 0 < c < 1 y 0 < m < 1. Substituting this in Equation (1) renders:
 (2)
(2)
With
“where
 is the traditional Keynesian multiplier and (c − m) is the marginal propensity to consume goods produced within the economy” (Gaviria Ríos, 2010, p. 14). Equation (2) clearly shows that income is a multiple of exports.
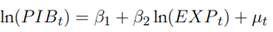
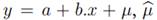
Therefore, in alignment with the theory presented above, the following model is proposed.
 (3)
(3)
It is assumed that the model’s residuals are distributed normally and are white noise. All the data for the model were obtained from the CEPALSTAT integrated database of the Economic Commission for Latin America and the Caribbean (ECLAC), except for the data for the real export variable obtained from the World Integrated Trade Solution (WITS) system of the World Bank (WB).
For the GDP variable, annual real GDP data were used (base = 2010), and quarterly data were estimated according to the quarterly percentage calculated using the database for the quarterly gross domestic product, by the class of economic activity at current prices. The EXP variable was obtained as annual data of real EXP (base = 2010), and quarterly data were also estimated according to the quarterly percentage calculated from the quarterly balance of payments database. The data for the two variables (stated in millions of U.S. dollars) are expressed in natural logarithm form.
Per the availability of information and the estimates made, the data for each country were 1. Bolivia - quarterly data from the first quarter of 1993 to the last quarter of 2016; 2. Colombia - quarterly data from the first quarter of 2000 to the last quarter of 2016; 3. Ecuador - quarterly data from the first quarter of 1993 to the last quarter of 2016; and 4. Peru - quarterly data from the first quarter of 1994 to the last quarter of 2016.
B. Cointegration Test
Cointegration is “the property in which two or more time-series share a common stochastic trend” (Sant’Anna, Filomena & Caldeira, 2017, p. 149). Cointegration makes it possible to solve the typical time series problem of creating a relationship model between variables (for example, a simple regression) that turn out to be spurious. For cointegration to exist, the following must be true. First, the variables must be stationary I(1). Second, the residuals of a linear combination must be of order 0 (I(0)). Engle and Granger (1987) argue that:
“in a regression of the type
 is stationary I(0) so
 is not only consistent but is super-consistent (that is, the estimate converges to its real value in inverse proportion to the number of observations, instead of to the quadratic root of the number of observations, as is the case for stationary variables)“ (Montero, 2013, p. 6).
This implies that to test cointegration, it is necessary to perform stationarity tests. As such, this study conducted the augmented DickeyFuller (ADF) and the Kwiatkowski-Phillips-Schmidt-Shin (KPSS) tests. This is based on the validation conducted by Schlitzer (1995) using Monte Carlo methods, which stated, “The results show that, although at the cost of producing a large number of inconclusive answers, the combined procedure allows us to consistently reduce the number of incorrect conclusions” (p. 142).
The cointegration test conducted was the Johansen test since “Johansen’s procedure performs better than single-equation methods and multivariate ones, even when the errors are not normally distributed or when the dynamics are unknown and we over-parameterize by including additional lags in the Error -Correction Model (ECM)”
(Gonzalo, 1994, p. 225). As such, the ECM vector is estimated using the Enders (2003) equation:
 (4)
(4)
with
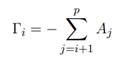
where ∆Z t represents the first differences of endogenous variables vectors ln(PIB t ) and ln(EXP t ); ΦD t represents the matrix of parameters of the deterministic vector, Π represents the information matrix on the long-term relationship between the variables of vector Z t ; and A i represents the matrix of fixed coefficients. The test used the trace statistic and the statistic of the largest proper value; the null hypotheses established refer to the number of cointegration vectors (r).
C. Block Exogeneity Wald Test
According to Enders (2003), this test detects whether the lags of one variable can Granger-cause another variable; the statistical test is thus defined:
 (5)
(5)
This equation is explained by (Nguyen, 2011), who states:
“T is the number of observations; Σ un are variance/covariance matrices of the unrestricted VAR system; Σ re are variance/covariance matrices of the restricted system when the lag of a variable is excluded from the VAR system, and p is the number of lags of the variable that is excluded from the VAR system” (p. 6).
The null hypothesis of this test states that a dependent variable is not the Granger cause of an independent variable. According to Granger (1969), the concept of Granger causality can be summarised as follows: a dependent variable Y is caused by an independent X if the lags in the latter contribute to the estimation of the current values of Y (Granger, 1969).
In the proposed model, the cointegration tests of the ln(GD) and ln(EXP) variables were performed for all the countries studied. The Block Exogeneity Wald test was performed for the countries in which stationarity was found; these results are presented in the following section.
III. Results
Table 1 presents the results of the estimation of the model proposed in Equation (3). For all countries, the model displays the following:
at 5%, individual significance for the slope and the intercept (t statistic)
at 5%, global significance (F statistic)
a high value for the coefficient of determination R 2
Table 1 Results of the simple linear regression model estimation
| Country | Intercept | t statistic | Slope | t statistic | F statistic | R2 |
|---|---|---|---|---|---|---|
| Bolivia | 3.54 | 19.01 | 0.65 | 25.6 | 655.36 | 0.87 |
| Colombia | 3.43 | 8.59 | 0.82 | 19.2 | 367.48 | 0.84 |
| Ecuador | 2.65 | 8.71 | 0.83 | 22.8 | 521.01 | 0.84 |
| Peru | 3.77 | 12.6 | 0.73 | 21.6 | 468.32 | 0.84 |
Source: Own elaboration.
As discussed in the previous section, the results presented in Table 1 can be spurious, so Tables 2 and 3 establish the existence of cointegration between the ln(GDP) and ln(EXP) variables.
Table 2 Results of the ADF and KPSS stationarity tests
| ADF | ADF | KPSS | KPSS | ADF | ADF | KPSS | KPSS | |
|---|---|---|---|---|---|---|---|---|
| Country | lnGDP | InEXP | 2.46(3)*** | 2.42(3) *** | 2.42(3) *** | -3.23(4)*** | 0.32 (3) | 0.19 (3) |
| Bolivia | 0.92 (5) | 0.83 (8) | 1.78(3)*** | 1.68(3) *** | 1.68(3) *** | -3.21(10)*** | 0.14 (3) | 0.03 (3) |
| Colombia | -0.04 (0) | -0.12 (3) | 2.45(3)*** | 2.35 (3) *** | 2.35 (3) *** | -8.06 (0)*** | 0.11 (3) | 0.02 (3) |
| Ecuador | 0.03 (1) | -1.08 (6) | 2.37(3)*** | 2.31 (3) *** | 2.31 (3) *** | -1.28 (11) | 0.17 (3) | 0.11 (3) |
| Peru | 0.02 (10) | -2.12 (6) | 2.46(3)*** | 2.42(3) *** | 2.42(3) *** | -3.23(4)*** | 0.32 (3) | 0.19 (3) |
Note: The asterisks indicate the rejection of the null hypothesis of the respective test (at 5%). The numbers in parentheses indicate the lag order in each test. Source: Own elaboration.
According to Gabriel (2010), the null hypotheses of the ADF and KPSS stationarity tests refer to:
1. ADF test: The series has a unit root, which is the same as saying that it is not stationary; and
2. KPSS test: The series is stationary.
The ADF test was estimated with a constant due to the possibility that the series mean did not assume a value of zero, “although the null hypothesis is one with a unit root, but without drift - Case 2 of Hamilton” (Regúlez, 2006, p. 2).
Table 2 shows that for Bolivia, Colombia and Ecuador, the variables studied are stationary I(1). For Peru, it is not possible to be certain of the rejection of the presence of the unit root because the ADF test for the first differences in the ln(GDP) variable did not allow rejection of the null hypothesis.
In Table 3, the value of the lag order of VAR (p) was determined by the minimum values of the (Schwartz) Bayesian information criterion (BIC) and the Hannan-Quinn information criterion (HQC). The estimate was made with an unrestricted constant. The results of the trace and largest proper value statistics show that for Bolivia, Colombia, and Ecuador, the null hypothesis for no cointegration is rejected, and the null hypothesis for cointegration range 1 is not rejected.
Table 3 Results of the Johansen Cointegration Tests
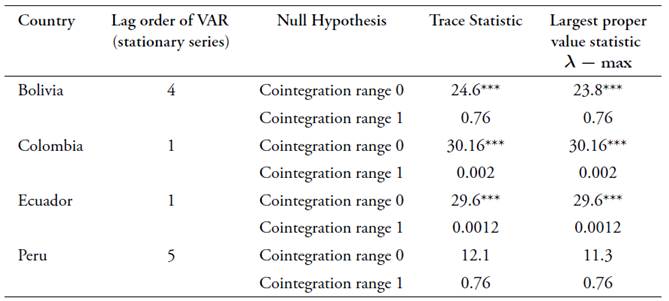
Note: The asterisks indicate the rejection of the null hypothesis of the respective test (at 5%) and per the critical values (15.41 and 3.76) presented by Osterwald-Lenum (1992). Source: Own elaboration.
In the case of Peru, the null hypothesis for no cointegration cannot be rejected. Added to the ADF test result for the first differences of ln(GDP), this does not guarantee (for Peru) the presence of cointegration for the established variables. Therefore, the causality test for this country was not conducted. One must remember that the stationarity and cointegration test results are needed before the causality assessment is conducted (Jaunky, 2013).
Table 4 Results of the Block Exogeneity Wald test
| Country | Lag order of VAR (stationary series) | Null Hypothesis | Statistic for VAR Granger Causality /Block Exogeneity Wald tests |
|---|---|---|---|
| Bolivia | 4 | Exports do not ‘Granger-cause’ GDP | 13.2*** |
| GDP does not ‘Granger-cause’ exports | 16.8*** | ||
| Colombia | 1 | Exports do not ‘Granger-cause’ GDP | 0.32 |
| GDP does not ‘Granger-cause’ exports | 23.6*** | ||
| Ecuador | 1 | Exports do not ‘Granger-cause’ GDP | 2.4 |
| GDP does not ‘Granger-cause’ exports | 16.7*** |
Note: The asterisks indicate the rejection of the null hypothesis of the respective test (at 5%). The value of the VAR(p) lag order was estimated in the same way as in Table 3. Source: Own elaboration.
Table 4 presents the results of the Block Exogeneity Wald tests; the results for each country indicate the following:
Bolivia: Bidirectional causality exists; as such, the ln(EXP) variable Granger causes the ln(GDP) variable, and the ln(GDP) variable Granger causes the ln(EXP) variable.
Colombia: Unidirectional causality exists; the ln(GDP) variable Granger causes the ln(EXP) variable.
Ecuador: Unidirectional causality exists; the ln(GDP) variable Granger causes the ln(EXP) variable.
IV. Discussion
Considering the results obtained, it can be concluded that within the CAN framework, the growth hypothesis offered by the export-led model is only fulfilled in Bolivia and it is not unidirectional. Therefore, the CAN countries should not focus on economic policies that seek to boost the export sector as a foundational and priority sector of the economy. However, it cannot be ignored that the presence of cointegration in the economies of Bolivia, Colombia, and Ecuador indicates that the export and GDP variables behave in a coordinated manner over the long term.
This result aligns with the conclusions reached by Tang et al. (2015), in which they argue that the economies of Hong Kong, South Korea, Singapore, and Taiwan should not focus their growth policies exclusively on the promotion of the export sector.
Furthermore, this study shows that in Colombia and Ecuador, the behaviour of the GDP variable has causality on the behaviour of the export variable. A similar result was obtained by Gokmenoglu et al. (2015) for Costa Rica from 1980-2013. Their study produced a recommendation for Costa Rica to pursue an economic policy that promotes GDP growth and to move away from export promotion policies - a recommendation that applies to all the CAN countries.
According to these findings, it is clear that interventionist policies seeking to boost the export sector as a driver of economic growth are misguided. Even the study by Shafiullah et al. (2015), which did not reject the ELG hypothesis, recommended that Australian economic growth should not rely on exports because this model has caused regional concentrations of economic growth.
The economic policies of the CAN countries must consider the recommendations offered by Thomas (2011), discard the idea of collective growth based on export promotion, and instead think of an alternative “whereby export-led growth is replaced by a new paradigm: domestic demand-led growth” (Thomas, 2011. p. 10).
The suggestions presented in this study should not be ruled out by Peru, even though it was not possible to establish causality or ascertain the longterm relationship between the GDP and EXP variables for this country. The behaviour of these two variables should not be thought of as being “very far” from the behaviour demonstrated by the other CAN countries.

