


 English (pdf)
 Article in xml format
 Article references
 Send this article by e-mail
 Cited by SciELO
  Cited by Google
  Similars in
SciELO
Similars in
SciELO  Similars in Google
 Permalink
Introduction
Uncertainty is a complex situation and includes not only diverse dimensions influencing the behavior of consumers, managers, and policymakers, but it also impacts macroeconomic issues (economic growth and development, outcome, industrial production, etc.). In addition, it impacts individual/microeconomic phenomena like firm performance and growth, asset allocation and risk management decisions, along with some non-economic topics like trade agreements, war and global warming effects.
Since uncertainty is closely related to economic activity and tends to increase during recession periods and diminish during economic booms (Bloom, 2014), there has been an important effort to develop a proxy to measure this concept. One of the most important and popular uncertainty proxy is the economic policy uncertainty (EPU) proxies is the Baker et al. (2016) Index. This index is based on coverage of newspaper headlines and has been extensively employed to analyze the effect of this variable on economic and financial factors.
This paper analyzes how the Mexican and American EPU impact economic activity, industrial production, and stock and exchange markets in Mexico over the January 1996 to September 2019 period employing monthly data. To achieve this purpose, we proposed a Dynamic Conditional Correlation (DCC) generalized autoregressive conditional heteroscedasticity (GARCH) model, which allows us to know the similar/different behavior of the variables with respect to each other over time. The main contribution of this research is to analyze the impact of local and U.S. EPU on Mexican economic and financial variables employing an innovative approach.
It is important to mention that the impact of EPU on Mexican variables literature is almost nil, as in the case of other emerging markets. The closest research is that by Busch and López-Noria (2019), but they only address EPU effects on Mexican exchange rate volatility. Empirical evidence obtained in this research is important for economic authorities, policymakers, risk managers, and investors.
Economic and financial linkages are usually time-variant and sign- changing. The DCC-GARCH model is a parsimonious approach which provides efficient estimates exhibiting time-variant correlational structures between variables. The DCC model consists of a heteroscedastic process of a covariance matrix such that conditional correlations are time-dependent and governed by a small number of parameters (Kurazawa, 2016). The DCC-GARCH developed by Engle (2002) has been widely applied to analyze economic and financial relations due to its advantages and the fact that it is a good fit.
Another major advantage of the proposed measure consists of its ability to detect changes in the conditional correlation over time. Moreover, it can distinguish negative correlations due to episodes in single years, synchronous behavior during stable years and asynchronous behavior in turbulent years. The DCC-GARCH model offers a better fit of estimations because the window size is arbitrarily set in the rolling regressions approach, producing an effect known in the econometric literature as the ghost effect” characterized by the disappearance of some important effects in the relations under analysis (Antonakakis et al., 2017).
The country selection first considers that Mexico is the 12th largest global economy and the world’s 15th largest exporter. Additionally, it is one of the countries with more trade agreements, and the Mexican peso is one of the most traded emerging currencies (World Bank, n.d.). Second, directly related to our research, its economic interrelationships with the United States have increased sharply following the enforcement of the North American Free Trade Agreement in 19941. Its trade has been oriented to the United States up to 80 percent of its total exports. Mexico has become the US’ second- largest export market and the third-largest source of imports.
All these facts have impacted the long-term performance of the Mexican economy. During the Great Recession, for instance, Mexico’s GNP decreased 6.7%. Similarly, despite all its natural resources and productive capacities, the Mexican economy has presented a modest growth rate of around 2% since 2013. Global uncertainty and local problems have impacted its economic and financial performance by making it very sensitive to economic policy uncertainties.
Consequently, government policymakers, investors, and corporate executives of both the U.S and Mexico monitor U.S. economic macroeconomic and financial variables to maintain and potentially expand their business operations in and with Mexico. Mexican economic agents also look up closely to their own economic performance to expand their local and international business activities. Economic uncertainty inferred from all indicators mentioned impacts growth of various sectors of the Mexican economy (Alam & Istiak, 2020; Bush & López-Noria, 2019).
Based on the previously mentioned analysis, this study is crucial to unveil and expand the understanding of the nature and impact of foreign and local uncertainty shocks and to propose hedging measures and actions in response to local and foreign EPU to promote Mexico’s stability and economic growth.
The paper is structured in five sections in addition to this introduction, Section I presents the literature review, Section II describes data and methodology, Section III presents the empirical evidence and analyzes the results, and the last section concludes the research.
I. Literature Review
Economic policymaking is designed to offer a country economic stability and growth. Currently, there is a growing interest to identify its effectiveness and impact as global economic and financial phenomena have given rise to an increasingly integrated world economy whose changing trends and volatilities affect policy making perdurance globally with differentiated degrees of impacts among regions and countries. Furthermore, locally policy-making decisions may be affected due to conflicts and shock of interests among national groups. These trends have fostered a new strand of studies and applications regarding Economic Policy Uncertainty (EPU) and its effects on economic variables. Our work belongs to this new stream of research.
In this context, Jirasavetakul & Spilimbergo (2018) develop an EPU Index for the Turkish economy and study the impact of that Index on Turkish firms. The methodology employed is the difference-in-differences approach. Results suggest that sectors with a large irreversible investment are more exposed to policy uncertainty.
Chen et al. (2019) measure and investigate the relationship among the global economic policy uncertainty (GEPU) index, oil price shocks, and China’s industrial economic growth during the period from 2000 to 2017. They employed a Granger causality test and a Vector Auto Regressive (VAR) model, determining that the oil prices have a positive effect on industrial economic growth and that GEPU has a negative impact.
In terms of financial research, recent literature has dealt with the relationship between the EPU and variables such as stock prices (Jin et al., 2019), investor information asymmetry and management disclosures (Nagar et al., 2019), bitcoin returns (Demir et al., 2018; Wang et al., 2019), financial stress (Sun et al., 2017), stock returns (Demir & Ersan, 2018; Li et al., 2016), and exchange rates (Bush and López-Noria, 2019; Zheng-Zheng, et al., 2019) to mention a few.
Nonetheless, the amount of finance and economic studies scrutinizing EPU with both economic and financial effects is scarce. Baker et al. (2016) develop an EPU Index and find that this index is associated with high stock volatility and reduced investment in policy sensitive sectors (among them defense, health care, infrastructure). They also find that policy uncertainty inhibits investment, output, and employment in the U.S. They use a panel Vector Auto-Regressive approach to develop the study.
Antonakakis & Floros (2016) explore the dynamic inter dependencies among the housing market, stock market, policy uncertainty, and macroeconomics in the United Kingdom from 1997 to 2015. They find large spillovers of shocks from the housing market, stock market, and economic policy un- certainty to inflation, economic growth, and monetary policy stance.
Nilavongse et al. (2020) analyze the impact of EPU shocks on economic activity and exchange rate adjustments by employing a Structural Vector Autoregressive (SVAR) approach. Their results suggest that the domestic industrial production is only influenced by the Global EPU while local EPU impacts exchange rate.
Among the empirical literature, closely related to this research is the study developed by Guo (2019), who analyzes the EPU impact on stock markets of China, Hong Kong, and the U.S., employing Box-Jenkins methodology and the Dynamic Conditional Correlation (DCC) model.
Similarly, Fang et al. (2018) study the impact of EPU on the long-run correlation between crude oil and the U.S. stock markets based on the DCC- MIDAS model. Findings suggest a positive and significant influence of the EPU on the relationship between oil prices and the stock market as well as a structural break during the 2008 financial crisis.
Finally, Xiong et al. (2018) examine the time-varying correlation between policy uncertainty and Chinese stock returns using a DCC-GARCH model from 1995 to 2016. Empirical evidence shows important fluctuations in the correlation between policy uncertainty and Chinese stock returns and a greater effect of policy uncertainty on the Shanghai stock market than in Shenzhen.
Recent studies which examine the impact of EPU on financial factors in emerging countries such as exchange rate volatility (Abid & Rault, 2020; Chen et al., 2020), financial conditions (Li & Zhong, 2020; Phan et al., 2020), co-dependencies (Çekin et al., 2020) and research about EPU, and economic and financial variables (Caggiano et al., 2020; Liu et al., 2020; Canh et al., 2020; Nguyen et al., 2020) contribute to evidence how important and relevant EPU is and why research about its impact on economic and financial variables is crucial to understand the nature of domestic and foreign uncertainty shocks. It is of utmost importance to extend and deepen studies about this topic, above all in emerging countries, especially for Mexico and Latin America where research on this topic is scarce.
Although research about the effect of EPU in Mexico is scarce, there are three papers about the EPU influence on financial markets. The first one was developed by Sum (2012), who analyzes the impact of Economic Policy Uncertainty in the United States on the stock market performance in Canada and Mexico; time-varying OLS regression is analyzed. Findings suggest that the increased changes in EPU in the US negatively affect stock market performance in Canada and Mexico.
The second is a study by Bush and López-Noria (2019) which examines the effect of domestic and global uncertainty on the volatility of Mexico’s Peso/US dollar exchange rate. Results indicate that VIX and domestic and global uncertainty are the main drivers of the exchange rate volatility.
Lastly, Alam and Istiak (2020) examine the extent and nature of the impact of the U.S. EPU on Mexican economic performance. Like our study, they use the EPU index recently developed by Baker et al. (2016). Their methodology includes linear and non-linear structural vector autoregression (SVAR) models applied to US and Mexican macroeconomic aggregates. Results show that an increase in US policy uncertainty leads to a fall in Mexican industrial production, price level, and policy interest rate. Furthermore, the shock to the Mexican output and interest rate derived from U.S. EPU is larger than that of those caused by local uncertainty shocks. The findings are robust to various identifications of the SVAR model. Additionally, a symmetric impulse response test reveals that the responses of Mexican aggregates are symmetric to positive and negative US uncertainty shocks.
In this respect, our paper extends previous studies by examining the impact of the US and domestic EPU on Mexico’s economic and financial variables. The analysis employs an economic activity index and variables included in previous research, such as industrial production (examined by Alam and Istiak, 2020), the stock market (studied by Sum, 2012), and exchange rate markets (investigated by Bush and López-Noria, 2019). The period of study from January 1996 to September 2019 covers the free-floating exchange rate regime period of the Mexican Peso and includes both calm and crisis periods.
This study is relevant because it contributes to a further understanding of how financial markets and economic activity respond to domestic and US economic policy uncertainty. The findings are relevant to the literature about economic and financial transmission and spillovers. Results are applicable to design investment strategies and risk management approaches in the exchange rate and stock markets.
II. Data and Methodology
A. Sample Description
We apply the Economic Policy Uncertainty Index estimated and published by Baker et al. (2016). They analyze newspaper archives and count the articles that contain one or more terms of three sets: E (economics/economy), P (regulations, Central Bank, army, war, Federal Reserve, and all the concepts related to political figures and institutions), and U (uncertain/ uncertainty). They utilize a regression method. In their paper, EPU for Mexico and the U.S. indexes are employed.
Figure 1 shows EPU index evolution from January 1996 to September 2019. Overall, the Mexican index presented higher levels than the American index. The Mexican index presented higher levels during the period 1997- 2004 and, after that, remained stable around eighty points, presenting very low values during the period 2011-2016. The Mexican index reached its highest levels on dates associated with some key events: 1998 (Russian crisis), 2001 (dot com crisis), 2003 (Iraq invasion/Gulf War II), 2008 (Global Financial Crisis), and 2017 (important earthquake in Mexico City).
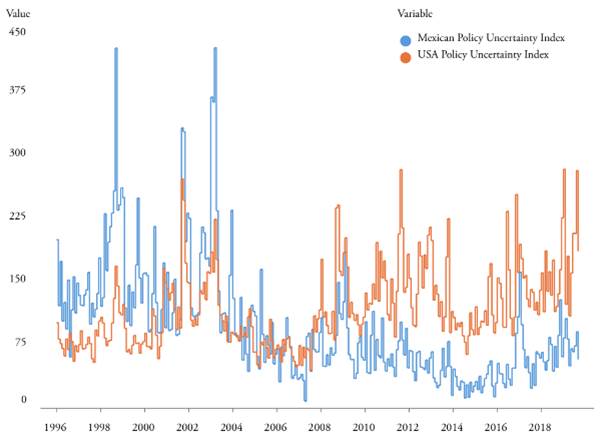
Opposite to the Mexican index, the US index presented lower levels during the period before the Global Financial Crisis (an average of 97 points) in contrast with the post-crisis period (142 points approximately). The highest EPU levels are related to the 2001 terrorist attacks, the Gulf War II in 2003, the Global Financial Crisis of 2008, the Sovereign Debt Crisis during 2010- 2012, Brexit in 2015, presidential elections of 2016, rising interest rates in 2018, and the commercial war with China 2019.
We have stressed that EPU is a key variable which affects economic and financial decisions. Concretely, this paper aims to analyze the impact of Mexican and American EPU indexes on Mexico’s economic activity, employing the General Economic Activity Index (IGAE) and Industrial Production and on financial activity in the stock market, and changes in the currency market using the stock market index (IPC) data and the FIX exchange rate MXN/USD; series were downloaded from the Mexican Central Bank (BANXICO) web page, except for the Stock Market Prices Index which was obtained from Yahoo Finance webpage. All series are monthly and were used in log-returns.
Variable selection is based on their relevance economic activity is essential to promote the wellbeing of a country (Chiripanhura, 2010), industrial production is frequently used as a proxy for economic activity (Nilavongse et al., 2020), above all, in manufacturing countries such as Mexico. In the case of financial variables, the exchange rate is a key variable in terms of export competitiveness, foreign investment, and inflation (Maitah et al., 2016; Musyoka & Ocharo, 2018); and stock markets are an important funding source, a major economic actor for boosting economic growth (Nguyen & Bui, 2019).
On the other hand, variable selection is in concordance with other studies such as stock returns (Demir & Ersan, 2018; Li et al., 2016), exchange rates (Zheng-Zheng, et al., 2019; Bush & López-Noria 2019), economic activity (Wang & Sun, 2017), industrial production, price level, and policy interest rate (Alam & Istiak, 2020), and economic activity and exchange rate (Nilavongse et al., 2020). A variable previously not considered in EPU impact in research on Mexico, but included in our work is stock market activity.
Figure 2 presents the economic and financial variables under study. All series fell sharply in 2008 because of the global financial crisis effects. Then the series exhibits a positive trend, and from 2017 onward the series growth flattens. In Figure 2, it is evident that economic variables present lower volatility than financial variables.
Source: own elaboration with data from the Mexican Central Bank and Yahoo Finance (n.d.).
Figure 2 Stock market index, exchange rate, and economic variables behavior
B. Methodology
This study considers a vector of six variables as follows: yt = [y1t, y2t, y3t], where y1t and y2t are the EPU indexes that measure economic policy uncertainty in the United States and Mexico, and y3t, y4t, y5t, y6t are the General Economic Activity Index, Industrial Production Index, Stock Market Index, and the Exchange Rate MXN/USD. The model has the following form:


where µt is a vector of unconditional means, Σt = [σij,t] is the time-variant covariance matrix of et, and
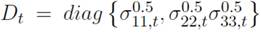 is the diagonal matrix of the variances, and ρt is the conditional correlation matrix. et is assumed to follow the multivariate Student’s t -distribution with ν degrees of freedom, given the information available at time t 1 or Ωt 1.2 The student’s t -distribution is used to handle possible fat tails in the economic and financial variables.
Engle (2002) proposes the DCC model that formulates the evolution of ρt as


where ηt = [η1t, η2t, η3t]′ is a vector of the marginally standardized errors
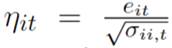 , Q is the unconditional covariance matrix of ηt, and
 is the diagonal matrix of Qt, θ1, and θ2 are fixed coefficients (Kurazawa, 2016).
III. Empirical Results
A. Descriptive Statistics
Table 1 presents the descriptive statistics for all the series, where apparently, the Mexican EPU Index exhibits the highest changes (standard deviation), followed by the U.S. EPU Index, Stock Index (IPC), and Exchange Rate (XR). As expected, economic variables show a lower level of variation. Mexico’s EPU, the U.S. EPU, and exchange rate series show negative skew, and the rest of the variables are positive skew.
Table 1 Descriptive Statistics and Jarque-Bera, ADF and ARCH-LM Tests
| EPU | EPUSA | IPC | XR | IGAE | PI | |
| Mean | -0.004367 | 0.002142 | 0.009336 | 0.003444 | 0.001956 | 0.001211 |
| Median | -0.001982 | -0.023382 | 0.010883 | -0.0000229 | 0.002101 | 0.001219 |
| Maximum | 2.304079 | 1.076532 | 0.176613 | 0.146383 | 0.026139 | 0.028629 |
| Minimum | -1.352867 | -0.918892 | -0.349814 | -0.069766 | -0.033149 | -0.041774 |
| Std. Dev. | 0.457126 | 0.26976 | 0.061384 | 0.029281 | 0.006658 | 0.009125 |
| Skewness | 0.402222 | 0.524798 | -0.859791 | 0.987232 | -0.539259 | -0.319039 |
| Kurtosis | 4.747314 | 4.790715 | 6.994291 | 5.8638 | 5.853401 | 4.787577 |
| Jarque-Bera | 43.78614 | 50.98172 | 223.784 | 143.1817 | 110.1103 | 42.63047 |
| ADF | -18.83359* | -12.79266* | -17.28301* | -16.36768* | -18.35646* | -19.4987* |
| ARCH-LM | 4.967724** | 12.47534* | 10.20344* | 13.44588* | 7.019426* | 6.929957* |
Note: * and ** denote statistical significance at 1% and 5% level, respectively. In the ARCH-LM, test results represent F-statistic values.
Source: own elaboration.
Table 1 also presents normality, heteroscedasticity, and unit root tests. ADF test values reject the null hypothesis that series have a unit root. Thus, series are stationary. ARCH-LM test indicates that the series presents heteroscedasticity, rejecting the null hypothesis of homoscedastic behavior. The Jarque-Bera test also rejects the null hypothesis of normality in the series.
Table 2 presents the covariance matrix; the Mexican EPU index exhibits the highest levels of covariance with the rest of the series. The correlation matrix is presented in Table 3; the Mexican EPU index maintains a high level of correlation with the US EPU index (0.31) and with the exchange rate (0.21). Other important relations are between the stock market and the exchange market (-0.44) and between General Economic Activity Index and Industrial Production.
Table 2 Covariance Matrix
| EPU | EPUSA | IPC | XR | IGAE | PI | |
| EPU | 0.20822839 | |||||
| EPUSA | 0.03890781 | 0.0725 | ||||
| IPC | -0.0041121 | -0.00264 | 0.00375 | |||
| XR | 0.00288834 | 0.00114 | -0.0008013 | 0.000854 | ||
| IGAE | 0.00017085 | 0.00008 | -0.00000916 | -0.00000377 | 0.0000442 | |
| PI | 0.00024871 | -0.0001112 | -0.0000298 | 0.00000874 | 0.0000399 | 0.000083 |
Source: own elaboration.
B. GARCH (1,1) Results
Using the residual series eˆt = yt µ, univariate GARCH models are estimated. GARCH (1,1) is primarily specified for simplicity and secondly because it fulfills the following key conditions: parameters are positive and statistically significant and β1 is higher than α1. The GARCH (1,1) models have the following form:

for i = 1, 2, and 3. Table 4 presents the results.
Table 4 GARCH (1,1) results
| Parameter | Mex EPU | U.S. EPU | IPC | PI | IGAE | XR |
|---|---|---|---|---|---|---|
| α0 | -0.001437 | 0.001322* | 0.0000609 | 0.0000167* | 0.0000098*** | 0.00015* |
| (0.008053) | (0.00000353) | (0.0000509) | (2.612557) | (0.00000572) | (0.0000456) | |
| α1 | 0.023569** | 0.043538* | 0.14584** | 0.230581* | 0.156534* | 0.175377* |
| x | (0.011682) | (0.00758) | (0.055418) | (3.644569) | (0.049344) | (0.035087) |
| β1 | 0.976431* | 1.026241* | 0.844309* | 0.585198* | 0.617798* | 0.668298* |
| (0.011682) | (0.00861) | (0.053508) | (5.96142) | (0.15956) | (0.065159) | |
| α1+β1 | 1.00000 | 1.069779 | 0.99015 | 0.81578 | 0.77433 | 0.84368 |
Note: *, **, and *** mean statistical significance at 1, 5, and 10%, respectively.
Source: own elaboration.
Here, regarding the GARCH (1,1) model results, for all the series, α1 and β1 are positive and statistically significant. α1 + β1 is, with the exception of U.S. EPU, lower and close to the unit, implying volatility persistence. β1 coefficients denote long-term memory in the series under analysis.
Following closely to Kurasawa (2016; 2019), from the GARCH models estimated above,
 is computed and used to fit the DCC models.
Table 5 presents the DCC- GARCH (1,1) model results obtained through maximum likelihood estimation.
Table 5 DCC-GARCH (1,1)
| IPC | PI | IGAE | XR | |||
|---|---|---|---|---|---|---|
| MEX EPU | θ1 | coef | 0.316577* | 0.238812* | 0.276947 | 0.302797** |
| std error | 0.069771 | 0.07088 | 0.078655 | 0.067131 | ||
| t-value | 4.537 | 3.369 | 3.521 | 4.511 | ||
| θ2 | coef | 0.198304** | 0.138311 | 0.139569* | 0.337942* | |
| std error | 0.078645 | 0.16382 | 0.10975 | 0.099228 | ||
| t-value | 2.522 | 0.8443 | 1.272 | 3.406 | ||
| d.f | coef | 21.61469 | 49.138401 | 35.306539 | 22.55801 | |
| std error | 14.99 | 83.237 | 38.591 | 14.356 | ||
| t-value | 1.442 | 0.5903 | 0.9149 | 1.571 | ||
| U. S. EPU | θ1 | coef | 0.340691* | 0.269391* | 0.223026 | 0.126241* |
| std error | 0.080642 | 0.076501 | 0.07457 | 0.076043 | ||
| t-value | 4.225 | 3.521 | 2.991 | 1.66 | ||
| θ2 | coef | 0.09685 | 0 | 0.029479 | 0 | |
| std error | 0.097442 | 0.13254 | 0.18353 | 0.18029 | ||
| t-valueg | 0.9939 | 0 | 0.1606 | 0 | ||
| d.f | coef | 11.516897* | 24.131827 | 341.248637 | 12.989892** | |
| std error | 4.1338 | 16.934 | 0 | 5.2569 | ||
| t-value | 2.786 | 1.425 | n.a. | 2.471 |
Note: * and ** means statistical significance at 1 and 5 % respectively.
Source: own elaboration.
Table 5 reports the estimated coefficients θ1 and θ2 from the maximum likelihood estimation. The 0 < θ1 and θ2 < 1 condition is satisfied, which is evidence of the stability of the DCC process. For the Mexican EPU Index, regarding the financial variables stock market and exchange rate market, the θ1 and θ2 coefficients are both significant. For the rest of the models, only one of the two coefficients is significant. The degrees of freedom for the multivariate Student’s t -distribution indicates the presence of heavy tails.
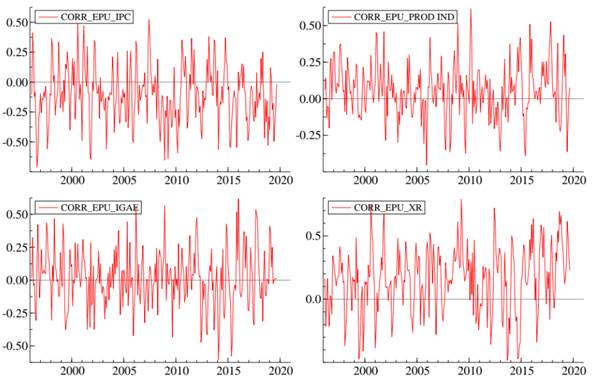
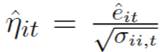
Figure 3 displays the dynamic conditional correlation between the Mexican EPU index and economic and financial variables. The IPC (Mexican stock market index) is negatively correlated with the economic policy uncertainty; this sign could be attributed to higher uncertainty, which promotes capital outflows, diminishing capital market investment. The General Activity Index (IGAE) and industrial production (PRODIND) are negatively correlated with the EPU, above all, after the subprime crisis began.
Source: own elaboration.
Figure 3 Dynamic Conditional Correlation between EPU Mexican Index and Mexican Economic and Financial Variables
Uncertainty not only affects financial investment, but also productive ones; this fact could explain the negative correlation between economics and EPU index. As expected, the exchange rate is positively correlated with the EPU, and higher uncertainty generates capital outflows and currency depreciation, increasing the MXN/USD relation. The exchange rate market reached higher degrees of correlation compared to the rest of the variables (0.8).
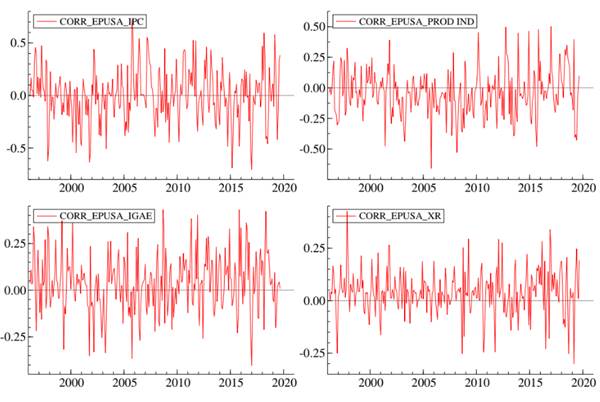
Figure 4 exhibits the dynamic conditional correlation between the U.S. EPU Index and Mexican financial and economic variables. Mexico’s Capital market is negatively correlated with the U.S. EPU Index from 1996 to 2001; from 2002 to 2015 there is a positive correlation, and after 2015, the correlation is negative again. The positive correlation could be explained by a market substitution effect: when uncertainty is higher in the U.S., Mexican stock market inflows increase during stress periods the substitution effect vanishes.
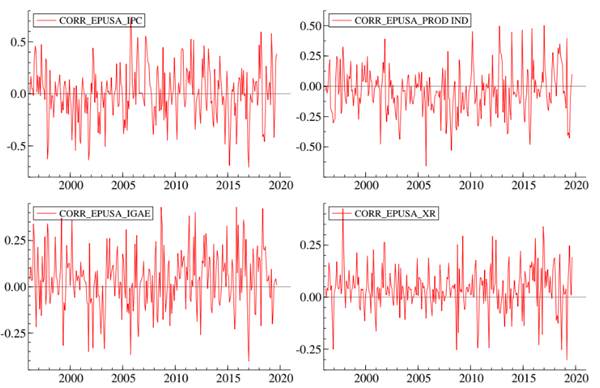
Source: own elaboration.
Figure 4 Dynamic Conditional Correlation between the U.S. EPU Index and Mexican Economic and Financial Variables
Economic variables present a positive correlation with the U.S. EPU, above all, after the subprime crisis. This result could be also explained by the market substitution effect, like in capital markets (i.e, when uncertainty increases in the U.S., one part of U.S. investors chooses the Mexican market to carry out productive activities). The exchange rate is also positively correlated to the U.S. EPU, but at a lower level than with Mexican EPU. This finding implies that the U.S. uncertainty also affects the exchange rate due to economic and financial U.S. power, as well as to the large contribution of U.S. uncertainty to global uncertainty. Following the subprime crisis, the correlation between the exchange rate and the U.S. EPU presented negative levels, showing an increasing response to U.S. uncertainty, depreciating the Mexican Peso.
Conclusion
This paper analyzes the U.S. and Mexican EPU indexes’ impact on economic and financial variables in Mexico. Results indicate a statistically significant impact from the Mexican EPU on stock and exchange rate markets but not in economic activity. This finding could be explained by the characteristics of financial markets such as high liquidity, fast absorption of news, which causes continuous and fast changes, and high sensitivity to diverse markets and variables.
On the contrary, economic activity index and industrial production do not have a significant relationship with local and U.S. EPU. This could be explained by the fact that the production of goods requires technology, capital, and physical spaces. It can also be explained by the fact that its adjustments are materialized in the long run. In other words, the response of economic variables is much slower than in the case of financial variables.
These results are consistent with other research which finds a significant relationship between EPU and stock markets (He et al., 2019; Liu & Zhang, 2015; Tsai, 2017) and between EPU and exchange rate markets (Bush & López-Noria, 2019; Chen, Du et al., 2019; Nilavongse et al., 2020).
Empirical evidence obtained through graphic analysis (DCC-GARCH results) reveals a market substitution effect between U.S. and Mexico stock markets and the high vulnerability of the Mexican Peso to domestic and foreign uncertainty shocks. Time-varying correlation shows changes in the dynamics of the variables during calm and distress periods.
Findings are important to reveal and understand the relationship between the economic policy uncertainty and economic and financial variables. This information is relevant to risk managers, economic authorities, and investors. This research, based on EPU indexes, contributes new information to design strategies for risk diversification, asset allocation, the design of new hedging instruments, and the formulation of economic policies, as well as the choice of policy instruments to respond to economic uncertainties (Liu & Zhang, 2020; Müllner, 2016).
An important recommendation to policy makers concerns the importance of distinguishing between local and foreign uncertainty shocks. This is essen- tial to correctly identify when intervention is necessary through interest rate adjustments, influencing the stock market, and the exchange rate, and when offering hedging instruments (such as swaps) is needed to soften the impact of EPU on exchange rate variations and, at the same time, diminish the impact of Mexican currency movements on direct and indirect foreign investment.
Future research agenda could extend the present study including other Latin American markets and comparing the impact of local and Global EPU on each stock market and exchange rate. Empirically, other methodologies could be employed, among them asymmetric DCC, VAR-DCC, and panel models.

