Services on Demand
Journal
Article
 English (pdf)
 Article in xml format
 Article references
 Send this article by e-mail
Indicators
-
 Cited by SciELO
 -
 Access statistics
Related links
-
 Cited by Google
 -
 Similars in
SciELO
Similars in
SciELO -
 Similars in Google
Share

 Permalink
Revista Colombiana de Química
Print version ISSN 0120-2804On-line version ISSN 2357-3791
Rev.Colomb.Quim. vol.39 no.3 Bogotá Sept./Dec. 2010
YOUNG-LAPLACE EQUATION IN CONVENIENT POLAR COORDINATES AND ITS IMPLEMENTATION IN MATLAB®
ECUACIÓN DE YOUNG-LAPLACE EN COORDENADAS POLARES CONVENIENTES Y SU IMPLEMENTACIÓN EN MATLAB®
EQUAÇÃO DE YOUNG-LAPLACE EM COORDENADAS POLARES ADEQUADAS E SUA PROGRAMAÇÃO EM MATLAB®
Alberto R. Alois1,2, Adriana F. Rincón1
1 Facultad de Ingeniería, Universidad del Atlántico, Km. 7 antigua vía a Puerto Colombia, Barranquilla, Colombia.
2 albertoalbis@mail.uiatlantico.edu.co
Recibido: 18/06/10 - Aceptado: 12/11/10
ABSTRACT
A new form of expression for the Young-Laplace equation is proposed. The Young-Laplace equation is developed in a convenient polar coordinate system and programmed in MatLab®. The profile generated showed to be in agreement with those reported in literature. An algorithm that avoids profile interpolation was developed and tested for the measurement of surface tension from profiles of pendant drops.
Key words: drop profile, polar coordinates, Young-Laplace equation, MatLab®.
RESUMEN
Se propone una nueva forma para expresar la ecuación de Young-Laplace. Se desarrolló laecuaciónde Young-Laplaceen un sistema de coordenadas tipo polar conveniente, y su solución se programó en el software MatLab®. Los perfiles que se generaron mostraron una excelente coincidencia con los reportados en la literatura. Se desarrolló un algoritmo que evita la interpolación en los perfiles, el cual se evaluó para la determinación de la tensión superficial a partir de perfiles de gotas pendientes.
Palabras clave: perfil de gota, coordenadas polares, ecuación de Young-Laplace, MatLab.
RESUMO
Propõe-se uma nova forma para expressar a equação de Young-Laplace. Desenvolveu-se a equação de Young-Laplace em um sistema de coordenadas tipo polar adequado e sua solução programou-se no software MatLab®. Os perfis gerados mostraram uma excelente coincidência com os reportados na literatura. Desenvolveu-se um algoritmo que evita a interpolação nos perfis, o qual foi avaliado para a determinação da tensão superficial a partir de perfis de gotas pingentes.
Palavras-chaves: perfil de gota, coordenadas polares, equação de Young-Laplace, MatLab.
INTRODUCTION
Surface and interfacial tension are very important properties in science and engineering due to the role they play in several processes such as emulsification and foaming. Besides, this property is very sensitive to the presence of contaminants and gives insight about the behavior ofintermolecular forces at interfaces. Reliable values for this property are often required and trustfully techniques are needed to measure it.
Many techniques have been developed to measure surface tension (1). Among the commonly used methods, drop shape methods based on the analysis of the shape and size of a pendant drop has several advantages: They are absolute methods and do not depend on the contact angle between the liquid and the solid surface. Besides, the amount of sample is small; they have excellent precision, are applicable to both air-liquid and liquid-liquid interfaces, and are versatile, simple and appropriated in several situations, including extreme temperature and pressure. They have also been used to determinate the adsorption properties of biological systems, including protein adsorption at interfaces (2, 3).
The method is based on the Young-Laplace equation for capillarity. It compares the generated profile obtained by using a set of initial parameters that include the surface tension, with the experimental profile. The procedure is repeated for several values of surface tension until a good agreement between theoretically calculated and experimental profile is found (4-6).
Several changes on the original method have been introduced after its appearance in the 90's (5, 6). The modifications include improvements in the hardware (7), lens, CCD camera, light source, etc., changes in the algorithms to included new numerical methods (8-10), edge detection algorithms (11), and the application of the method to turbid samples (7, 12).
One of the disadvantages of using the Cartesian form of the Young-Laplace equation is that-for the process of profile comparison-is necessary to interpolate the generated profile (13). In this work, the Young-Laplace equation-describing the profile of pendant drops-is expressed in a convenient polar-like coordinate system to avoid interpolation. The resulting equations are solved in MatLab® software (2009, The MathWorks), and the obtained profiles are compared with data reported in the literature and with results obtained solving the Cartesian form of the equation using MatLab®.
METHODS
The Young-Laplace equation for capillarity was expressed in a convenient coordinate system, as suggested by Zholob et al. (13), and further developed by us. The dimensionless form of the equation was obtained dividing the radii length by the radii of curvature at the apex. The resulting differential equation was numerically solved using MatLab® software for different Bond numbers, and the results are compared with literature data. An algorithm was also written to obtain the Bond number from experimental profiles. The software was tested using experimental-like profiles. The experimental-like profiles were generated solving numerically the Young-Laplace equation and adding random noise to simulate real experimental profiles.
RESULTS AND DISCUSSION Drop profile equation
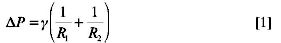
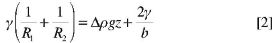
The Young-Laplace equation [1] was developed to describe the profile of a meniscus inside a capillary, but the subjacent phenomena is the same that gives drops their characteristic shapes, therefore it can be used to described the profile of pendant and sessile drops (1). In this equation, the pressure difference, AP,is described by the two radii of curvature, R1 and R2 and the surface tension, y. The pressure difference can be given in terms of the height, z, and the density difference, Ap, and b is the radii of curvature at the drop apex as shown in equation [2].
For symmetric shapes, the radii of curvature R1 and R2 can be expressed as a function of the arc length and the angle formed between the x-axis and the tangent line to the point considered, as presented in equation [3]:
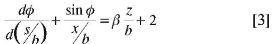
where β is the Bond number defined by equation [4]:
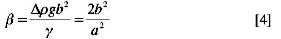
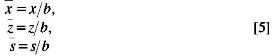
The Bond number is positive for oblate revolution figures, i.e., bubbles below a surface and meniscus in a capillary, and negative for prolate revolution figures as pendant drops and pendant bubbles (5, 14). The dimensionless lengths are defined as shown in the following equations:
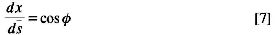
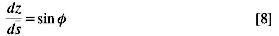
Taking into account geometric considerations, the following set ofequations is obtained:
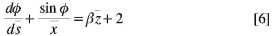
The initial conditions are described by equation [9]:

Equations [6], [7] and [8] have to be solved simultaneously to obtain the calculated profile. No analytical solution has been discovered; therefore, the equations have to be solved numerically. The algorithm to solve this equation was programmed in MatLab® using buildup functions as ODE45. It is noteworthy that the integration variable in this case is the dimensionless arc length, whereas in experimental profiles the coordinates are x and z. This situation force the necessity of interpolating values in the calculated profile when we try to compare it with experimental ones, increasing the computation time and decreasing the precision of the adjustment (13).
These difficulties can be avoided by using a polar-like coordinate system as proposed by Zholob et al. (13), as shown in Figure 1.
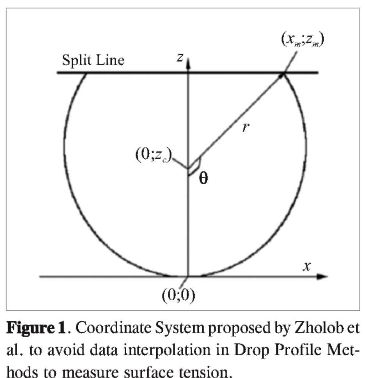
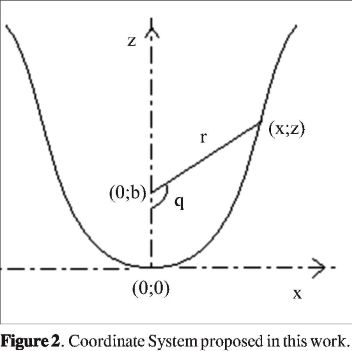
The experimental coordinates are easily converted to this coordinate system and the Young-Laplace equation is transformed by using d as the integration variable, making the comparison between experimental and calculated profiles straightforward. However, some difficulties arise when implementing this coordinate system: The position of the drop center depends on the assignment of the split line; when trying to define dimensionless magnitudes the zc unavoidably appears in the equations; and when zc is used to define dimensionless magnitudes, the length of the profile is immediately determined by choosing the magnitude of zc. These difficulties make this coordinate system very awkward to be implemented. In this work, a more natural polar-like system is proposed, as shown in Figure 2.
If dimensionless variables defined by equation [10] are used, the curvature and the second derivate of radii can be related by equation [11] (15):

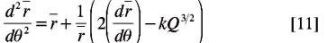
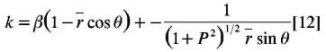
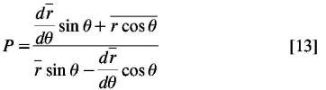
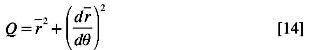
Where k is the curvature given by the Young-Laplace equation and can be expressed in the previously defined coordinate system by equations [11-14]:
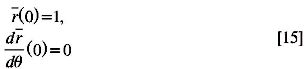
With initial conditions:
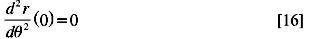
Where the boundary condition for the apex symmetry, must be satisfied:
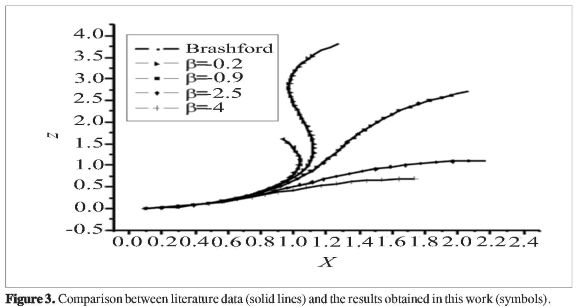
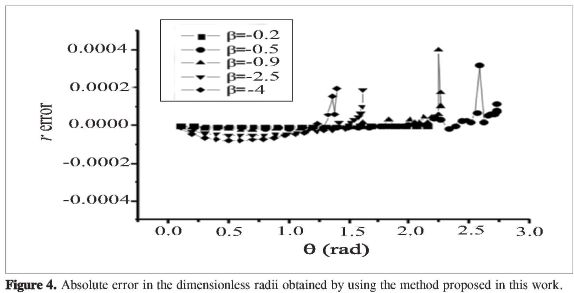
The solution of equation [11] to equation [16] was implemented in MatLab® and the comparison of the results with the data reported by Bashforth and Adams (14) is shown in Figure 3. Experimental and calculated profiles are superimposed. This can be seen more explicitly in Figure 4, where the differences between the radii for the Bashforth and Adams data and the results of obtained by using the equations proposed in this work are plotted. As it can be seen, the error is in the experimental uncertainty for most of the devices employed for these determinations (micrometer level).
Experimental-like profiles
Experimental-like profiles were simulated by generating theoretical profiles with the Young-Laplace equation expressed in the Cartesian system and introducing random noise to the generated profile, as equation [17]:
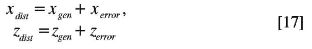
Where the subscripts exp and gen refer to the distorted and generated profile, respectively, and xerror and zemr correspond to the random distortion added to the generated profile. The magnitude of the introduced error was selected to be approximately equivalent to one pixel in a 600x400 picture and it can be positive, negative or zero for each generated point (xgen,zgen). The apex position was also randomly translated from the (0, 0) position, and a random inclination of the profile was introduced as well (15):
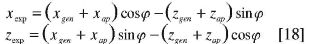
Where the subscript exp refers to the coordinates of the experimental-like profile, and (xap,zap) are the new coordinates of the apex and the inclination angle of the camera is p.
Algorithm to calculate the surface tension, and testing
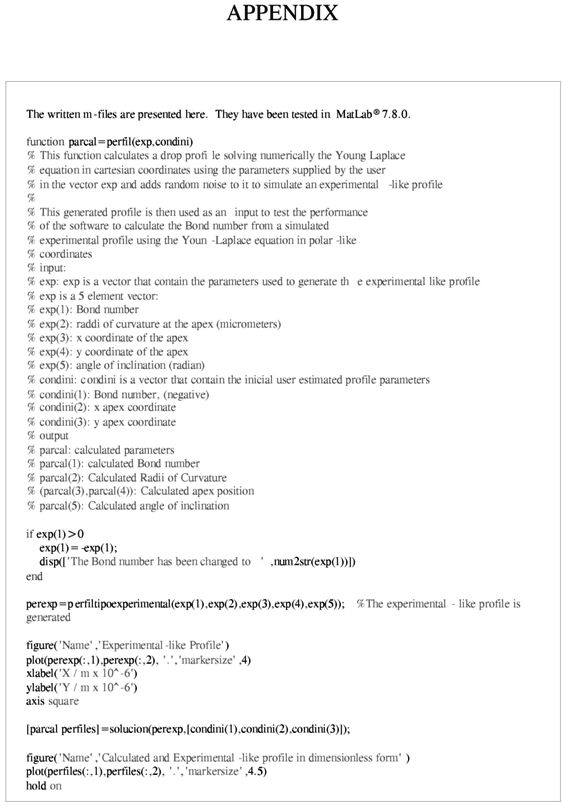
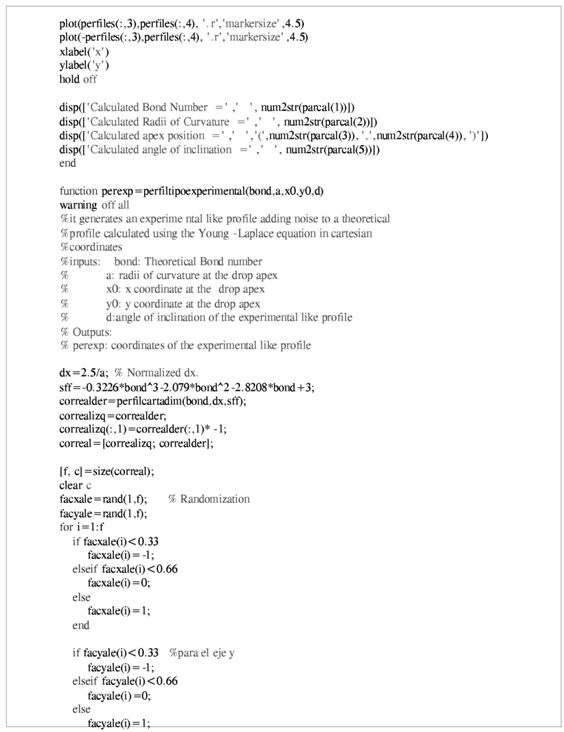
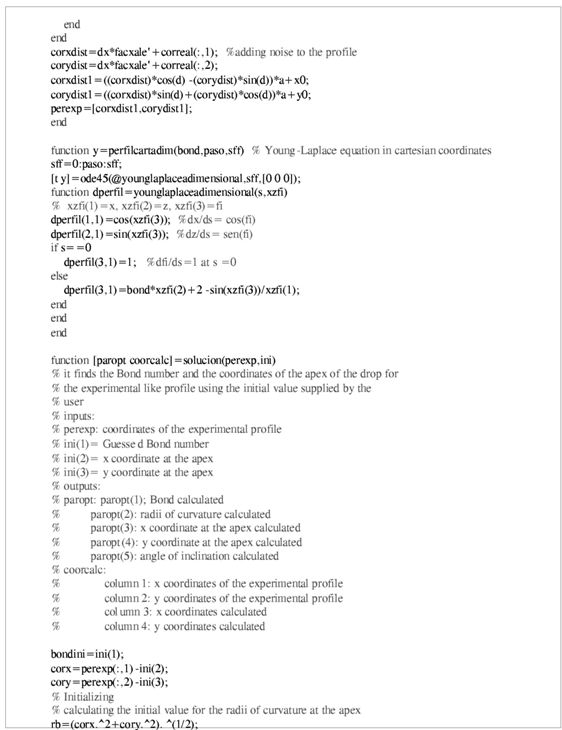
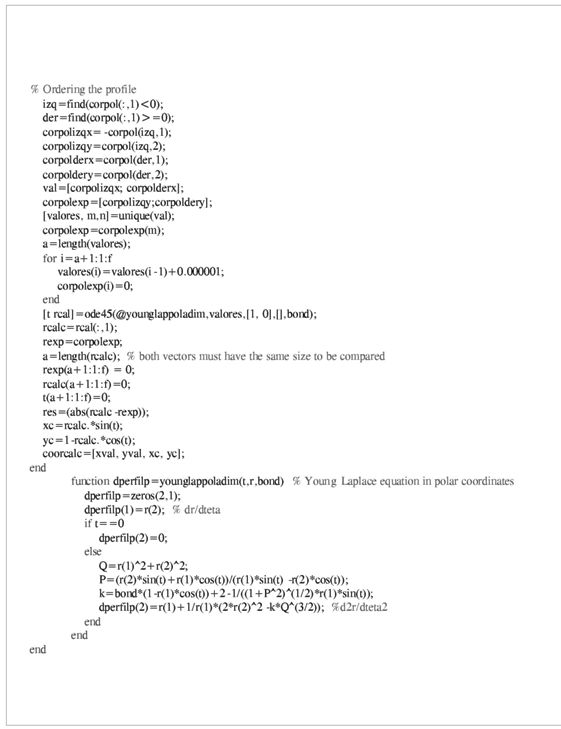
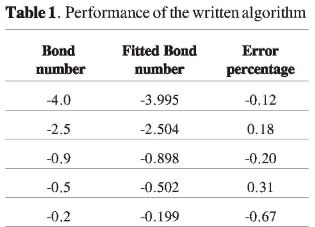
An algorithm was written to evaluate the surface tension by using the method described previously. Experimental-like profiles were generated and the performance of the algorithm was then tested: a rough approximation of the apex coordinates and Bond number, β, must be supplied by the user. Using the adequate form of equation [18] the coordinates are corrected respect the apex position and camera inclination (the supposed initial value for φ is 0), and the experimental values for θ and r are calculated. The algorithm initializes the radii of curvature at the apex by adjusting several points around the apex to a circle. With these values for apex position, camera angle inclination and the parameters b and β the built in MatLab® Levenberg-Mardquardt method is initialized using as minimization function de difference between the calculated and experimental r, for each value of the experimental θ. No interpolation is necessary in this method because the calculated r can be obtained at the experimental θ values. The performance of the algorithm-by using the generated experimental-like profiles-is showed in Table 1. An excellent agreement is found between theoretical values and the values found by the algorithm written in this work. The written algorithm is presented as an m-file in Appendix.
Another algorithm is being written to evaluate the surface tension of solutions from taken pictures or video of pendant drops. These algorithms have been widely described, but our algorithm uses the form of the Young-Laplace equation proposed here.
CONCLUSIONS
A new form of the Young-Laplace equation in polar-like coordinates was proposed. By using this method, interpolation is avoided in the calculation of the surface tension from experimental drop profiles. The implementation of the algorithm in MatLab® showed an excellent agreement between the results obtained and the results reported in the literature. Moreover, the test of the algorithm showed that the implementation in MatLab® can be used to calculate the surface tension of solutions from drop profiles.
REFERENCES
1. Adamson, A. W. and Gast, A. P. Physical Chemistry of Surfaces. New York: John Wiley & Sons, Inc. 1996. pp. 784. [ Links ]
2. Chen, P.; Policova, Z.; Pace-Asciak, C. R. and Neumann, A. W. Study of molecular interactions between lipids and proteins using dynamic surface tension measurements: a review. Coll. Surf. B. 1999. 15: 313-324. [ Links ]
3. Makievski, A. V.; R.Wãstneck, R.; Grigoriev, D. O.; Krãgel, J. and Trukhin, D. V. Protein adsorption isotherms studied by axisymmetric drop shape analysis. Coll. Surf. A. 1998. 143: 461-6. [ Links ]
4. Song, B.; Springer, J. Determination of interfacial tension from the profile of a pendant drop using computer-aided image processing: 2. experimental. J. Coll. Interface Sci. 1996. 184: 77-91. [ Links ]
5. Río, O. I. d.; Neumann, A. W. axisymmetric drop shape analysis: computational methods for the measurement of interfacial properties from the shape and dimensions of pendant and sessile drops. J. Coll. Intefac. Sci. 1997. 196: 136-47. [ Links ]
6. Song, B.; Springer, J. Determination of interfacial tension from the profile of a pendant drop using computer-aided image processing: 1. theoretical. J. Coll. Interface Sci. 1996. 184: 64-76. [ Links ]
7. Hoorfar, M.; Neumann, A. W. Recent progress in axisymmetric drop shape analysis (ADSA). Adv. Coll. Interfac. Sci. 2006. 121: 25-49. [ Links ]
8. Dingle, N. M.; Tjiptowidjojo, K.; Basaran, O. A.; Harris, M. T. A finite element based algorithm for determining interfacial tension (ã) from pendant drop profiles. J. Coll. Interface Sci. 2005. 286: 647-60. [ Links ]
9. Álvarez, N. J.; Walker, L. M.; Anna, S. L. A non-gradient based algorithm for the determination of surface tension from a pendant drop: application to low Bond number drop shapes. J. Coll. Interfac. Sci. 2009. 333: 557-62. [ Links ]
10. Thiessen, D. B.; Chione, D. J.; McCreary, C. B.; Krantz, W. B. Robust digital image analysis ofpendant drop shapes. J. Coll. Interface Sci. 1996. 177: 658-65. [ Links ]
11. Holgado-Terriza, J. A.; Gómez-Lopera, J. F.; Luque-Escamilla, P. L.; Atae-Allah, C.; Cabrerizo-Vílchez, M. A. Measurement of ultralow interfacial tension with ADSA using an entropic edge-detector. Coll. Surf. A. 1999. 156: 579-86. [ Links ]
12. Zuo, Y. Y.; Ding, M.; Li, D. and Neumann, A. W. Further development of axisymmetric drop shape analysis-captive bubble for pulmonary surfactant related studies. Biochem. Biophys. Acta. 2004. 1675: 12-20. [ Links ]
13. Zholob, S. A.; Makievski, A. V.; Miller, R.; Fainerman, V. B. Optimisation of calculation methods for determination of surface tensions by drop profile analysis tensiometry. Adv. Coll. Interface Sci. 2007. 134-135: 322-9. [ Links ]
14. Bashforth, F.; Adams, J. C. An attempt to test the theories of capillary act by comparing the theoretical and measured form of drops of fluid. Cambridge, Cambridge University Press. 1883. pp. 140. [ Links ]
15. Polyanin, A. D.; Manzhirov, A. V. Handbook of mathematics for engineers and scientists. Boca Ratón, Chapman and Hall/CRC. 2007. pp. 1509. [ Links ]