


Services on Demand
Journal
Article
 English (pdf)
 Article in xml format
 Article references
 Send this article by e-mail
Indicators
-
 Cited by SciELO
 -
 Access statistics
Related links
-
 Cited by Google
 -
 Similars in
SciELO
Similars in
SciELO -
 Similars in Google
Share

 Permalink
Revista Colombiana de Química
Print version ISSN 0120-2804
Rev.Colomb.Quim. vol.41 no.1 Bogotá Jan./Apr. 2012
THERMOKINETIC STUDY OF THE ZERO, FIRST AND SECOND ORDER REACTIONS IN A PSEUDO-ADIABATIC CALORIMETER: Numerical approach and experimental data
ESTUDIO TERMOCINÉTICO DE LAS REACCIONES DE ORDEN CERO, UNO Y DOS EN UN CALORÍMETRO PSEUDO-ADIABÁTICO: Aproximación numérica y datos experimentales
ESTUDO TERMOCINÉTICO DAS REAÇÕES DE ORDEM ZERO, UM E DOIS NUM CALORÍMETRO PSEUDOADIABÁTICO: aproximação numérica e dados experimentais
Johanna Mendoza1, Oscar Rodríguez1, Jesús A. Ágreda1,2
1 Universidad Nacional de Colombia, sede Bogotá, Facultad de Ciencias, Departamento de Química, Grupo de Calorimetría y termodinámica de procesos irreversibles. Av Cra 30 45-03- Bogotá D.C., Código Postal 111321 - Colombia.
Recibido: 11/11/11 – Aceptado: 20/03/12
ABSTRACT
The signal produced by a pseudo-adiaba-tic calorimeter is simulated by numerical solution of the differential equations that model the chemical kinetics [1], the ther-mal properties of the calorimetric cell [2], and the response of the thermistor used as a thermometric sensor [3].
These equations show that the calorimetric signal is related with concentration in a complex way. Therefore, a compa-rison between the signáis of the three basic kinetics reactions (zero, first and second order) was made, as a first step to obtain a standard procedure to follow chemical kinetics using a calorimeter. In order to help understanding this relation-ship, the initial rate method was applied to the simulated data to assess the rela-tionship between the order and the kine-tic constants calculated with those used for the simulations. As it was expected, the initial rate method for the calorime-tric data, do not give a slope directly re-lated with the order of the reaction, as it would be produced, for example, in data from a spectrophotometer. However, a linear relationship was found between what we call the "calorimetric order" and the kinetic order. Finally, the deve-loped procedure was applied to the stu-dy of the H2O2 decomposition catalyzed with Fe3+ in homogeneous phase and with activated carbon in heterogeneous phase, fnding the order and the kinetics constants of the global processes, which were in close agreement with those in the literature.
Key words: Thermokinetics, pseudo-adiabatic calorimeter, zero, first and second order kinetics, simulations, H2O2 decomposition.
RESUMEN
La señal producida por un calorímetro pseudo-adiabático se simuló mediante la solución numérica de las ecuaciones diferenciales que modelan la cinética química [1], las propiedades térmicas de la celda calorimétrica [2] y la respuesta del termistor que se usó como sensor termométrico [3].
Los resultados obtenidos de las simulaciones se usaron para hacer una comparación entre las señales de las tres cinéticas básicas (orden cero, uno y dos). Esto sirvió para establecer un protocolo de estudio de la cinética de una reacción a partir de medidas calorimétricas, lo cual resulta fundamental, ya que, como se ve en las ecuaciones anteriores, la relación entre el orden de reacción y la señal calorimétrica no es sencilla. Para esclarecer este punto, se realizó el estudio de las señales calorimétricas simuladas, empleando el método de las velocidades iniciales, y se compararon los resultados así obtenidos (orden de reacción y constante cinética) con los valores usados para las simulaciones. Como era de esperarse, los "órdenes de reacción calorimétricos" no coincidieron con los órdenes cinéticos usados en las simulaciones, como sí sucede, por ejemplo, en el caso de datos espectrofotométricos. Sin embargo, se pudo establecer una relación lineal entre el "orden calorimétrico" y el orden cinético que permite obtener el orden de reacción de un proceso que se estudia con un calorímetro. Finalmente, el procedimiento desarrollado se aplicó a los resultados calorimétricos experimentales de la descomposición del H2O2 catalizada en fase homogénea con Fe3+ y en fase heterogénea con carbón activado, encontrando los órdenes de reacción y las constantes cinéticas respectivas de cada proceso global, los cuales presentaron buena coincidencia con los valores reportados en la literatura.
Palabras clave: termocinética, calorímetro pseudo-adiabático, cinéticas de orden cero, uno y dos, simulaciones, descomposición de H2O2.
RESUMO
O sinal produzido por um calorímetro pseudoadiabático foi simulado mediante a solução numérica das equações dife-renciais que modelam a cinética química [1], as propriedades térmicas da célula calorimétrica [2] e da resposta do termis-tor que foi usado como sensor termométrico [3].
Os resultados obtidos das simulações foram usados para realizar urna compa-ração entre os sinais das três cinéticas básicas (ordem zero, um e dois). Isso serviu para estabelecer um protocolo de estudo da cinética de uma reação a partir de medidas calorimétricas, o qual resulta fundamental, já que como se vê nas equações anteriores, a relação entre a ordem de reação e o sinal calorimétrico não é simples. Para esclarecer este ponto, foi realizado o estudo dos sinais calorimétricos simulados usando o método das velocidades iniciais e compa-raram-se os resultados assim obtidos (ordem de reação e constante cinética) com os valores usados para as simulações. Como era de esperar, as ordens de reação "calorimétricas" não coincidiram com as ordens cinéticas usadas nas simulações, como sucede no caso de dados espectrofotométricos. No entanto, foi possível estabelecer uma relac" o linear entre a ordem "calorimétrica e a ordem cinética que permite obter a ordem de reação de um processo que se estuda com um calorímetro. Finalmente, o procedimento desenvolvido foi aplicado aos resultados calorimétricos experimentais da decomposição de H2O2 catalisada em fase homogênea com Fe3+ e em fase heterogênea com carvão ativado, encontrando as ordens de reação e as constantes cinéticas respectivas de cada processo global, os quais apresentaram boa coincidência com os valores reportados na literatura.
Palavras-chave: termocinética, calorímetro pseudoadiabático, cinéticas de ordem zero, um e dois, simulações, de-composição de H2O2.
INTRODUCTION
Solution calorimetry is used to obtain thermodynamic information about che-mical processes (1, 2, 3). It is clear, that the kinetic information is inside the ca-lorimetric data, but it is not so easy (or at least not so common), to obtain that information (4, 5). This paper presents an approach to obtain kinetic information from the calorimetric data. In a previous work (6), a home-made pseudo-adiabatic calorimeter was characterized, and the parameters valúes obtained from that study were used, in this paper, to produce simulated signáis of the three basic kinetics processes: zero, first and second order. The simulated data were treated using the well know kinetic method of initial rates to achieve the order and the kinetic constants of the processes (7). In this way, we were able to compare the exact valúes of the kinetics constants used for simulations, with those obtained after the application of the initial rate method. After the comparison, it was possible to construct a linear relationship between the kinetic order of the reaction and what we cali the "calorimetric order" of the reaction found by the initial rate method apply directly to the calorimetric data. This procedure was used with calorimetric experimental data obtained during the decomposition of the H202 ca-talyzed with Fe3+ in homogeneous phase and with activated carbón in heteroge-neous phase. A satisfactory agreement was found between the valúes obtained using the procedure developed in this work and valúes in the literature (8, 9, 10). Additionally, the study of the neu-tralization of the NaOH with HC1, used as a patrón, is presented to examine the whole process and establish a limit to the protocol, especially when the kinetics are extremely fast, as it is the case for the neutralization reaction (11).
MATERIALS AND METHODS
The calorimeter
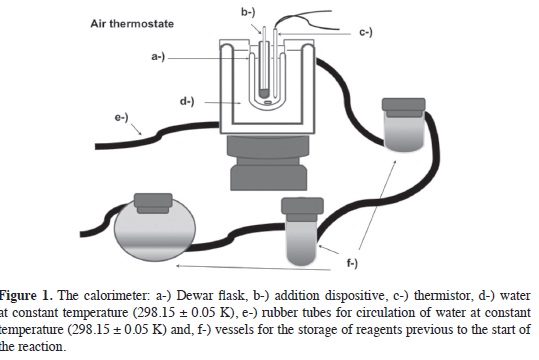
A Dewar fask was used as a calorimetric cell, and it was submerged in a water thermostat. The whole system was inside an air thermostat. The solutions used for the experiments where inside the air thermostat contained in vessels, as it is showed in Figure 1. Additional details of the calorimeter can be seen in reference (6).
Reagents and calorimetric experiments
All reagents used were of analytical grade. NaOH was Mol Labs; H202 30 % was Panreac; activated carbón was JT. Baker, HC1 36 % and Fe(N03)3.9H20 were Merck. Adequate dilutions were used to obtain the required concentrations. Two solutions were mixed to start the reaction using the dispositive show in the center of Figure 1, numeral b.
Simulations
The simulations were made by solving, numerically, a system of three coupled differential equations. The first one comes from the general chemical reaction:

This can be expréssed as:
Where [A] is the concentration of the reagent A, t is time, and ki. is the kinetic constant with i = 0, 1 or 2, depending of the kinetic order n of the reaction. The second equation represents the calorimetric cell behavior:
Where Kcal is the heat capacity of the calorimetric cell, Cps is the heat capacity of the solvent, T is temperature, ΔH is the enthalpy of the reaction, V is the volume of the reaction mixture, Kt is the overall heat transfer constant of the calorimetric cell, Tamb , is the constant temperature of the thermostat, wp is a term added to take account of the unspecific sources or sinks of heat (12), i is the current that flow through the thermistor and R0 is the resistance of the thermistor at 298,15 K. The third equation represents the behavior of the thermistor used as a sensor:
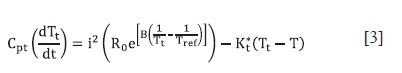
This can be approximated as:
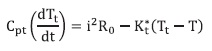
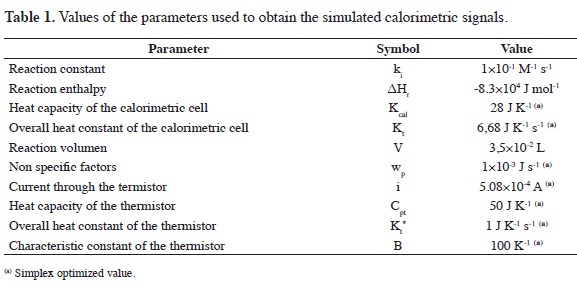
If the temperature of the thermistor Tt is "close" to the reference temperature Tref of the thermistor, in this case 298,15 K, ("close" means no more than 3 K de-grees of difference between them); Cpt and Kt* are, respectively, the heat capa-city and the overall heat transfer constant of the thermistor and B is a characteristic constant of the thermistor. Table 1 pre-sents the numerical values of the parameters used for simulations. These values were found by a simplex optimization process where a calibration reaction, the neutralization of NaOH with HCl, was simulated, and the results were adjusted changing the parameters of table 1, until the agreement between the experimental data and the simulated ones was trust-worthy (6).
RESULTS AND DISCUSION
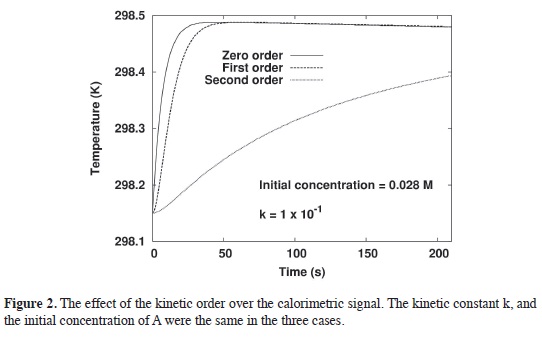
The simulations show the clear effect of the kinetic order of the reaction over the calorimetric signal when the kinetic rate parameter k and the initial concentration A0 are constant, Figure 2.
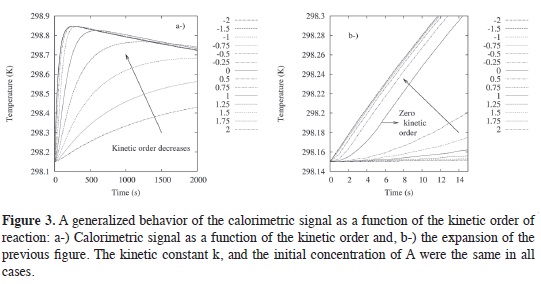
In Figure 3a, the kinetic order of the reaction is generalized to any number possible between 2 and -2. A nice sequence, from 2 to almost 0.5 order, was found and, after that, the differences in order, particularly for the negative ones, it is not clear because the differences are small. Figure 3b try to describe this issue in a most tangible way. Figure 3b is an expansion of Figure 3a.
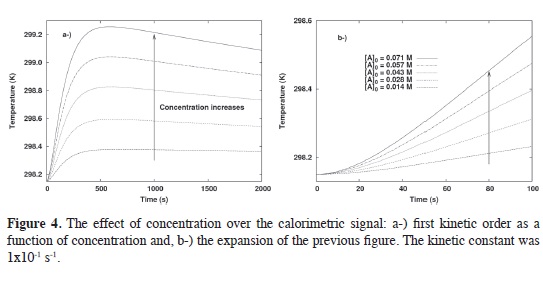
The initial rate method. The initial rate method was used to determine the kinetic order of the reaction from calorimetric data. Simulated data for 8 kinetics orders between 0.25 and 2 every 0.25 units were tested. At each order, five different initial concentrations were used (0.014, 0.028, 0.0049, 0.057 and 0.071 M). Figure 4a shows an example for the case of first order, and Figure 4b, shows an enlargement of these simulated results. These fgures describe the set of data that we used to obtain the kinetic information from the calorimetric measurements.
The initial rate method was applied to the simulated calorimetric data, and then, we were able to obtain a relationship bet-ween the kinetic order of the reaction, and that we call "the calorimetric order", Figure 5.
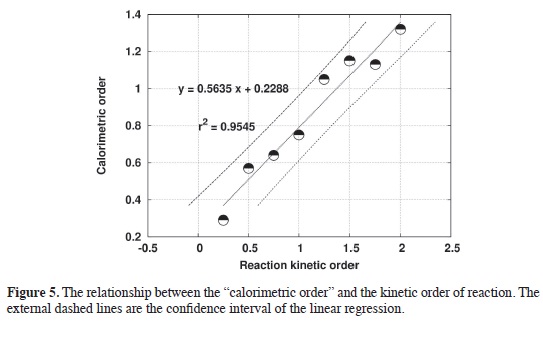
The ideal relationship would be a straight line with slope equal to one and intercept equal to zero; instead, a straight line with slope different to one and in-tercept different to zero was obtained. However, this relationship is particularly useful to obtain the kinetic order of the reaction from the calorimetric data, and it can be used to obtain that information from experimental calorimetric results as we will discuss in the next part of this paper. It is important to notice, before to follow with the experimental data, that the "calorimetric order" it is not equal to the "kinetic order" because the signal in calorimetry, the right hand side of the equation [2], has more than one term, and then the slope of the log-log plot of the calorimetric data is not the kinetic order of the reaction.
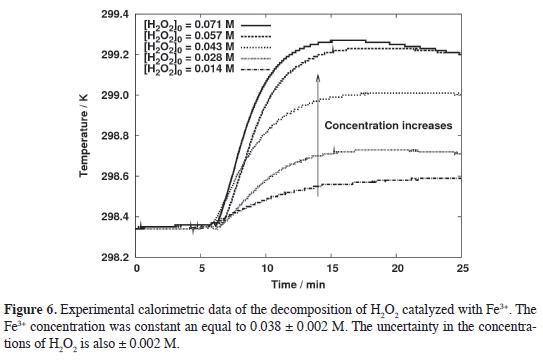
Experimental results. The decomposition of H2O2 in homogeneous phase catalyzed by Fe3+ was studied experimentally using the calorimeter described previously. The experimental data was compared with the simulations for different orders fnding that the overall pro-cess is a clear second order, Figure 6. Observe the slope of the log-log plot, figure 7, and compare it with Figure 5. The interpolation of the "calorimetric order", 1.316, in the calibration curve produces a kinetic order of 1.92 ~ 2.
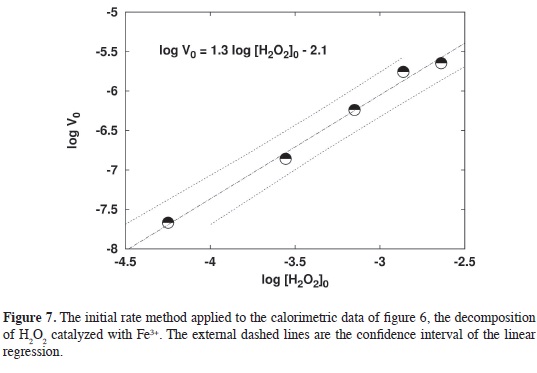
This behavior is consistent with a mechanism were the Fe3+ is an essential part of the process, see reference (6) and it can be resume in the global reaction:
Equation [4] is a second order reaction.
On the other hand, the same process catalyzed by activated carbón, a hetero-geneous process, shows first kinetic order, (data are not showed because they are similar to figures 6 and 7). The ex-periment was made at constant concentration of H202 (0.043 ± 0.002 M) and variable quantities of activated carbón (0.2000, 0.4000, 0.6000 and 1.0000 ± 0.0003 g per 35.0 ± 0.1 mi of reaction volume). In this case, the slope of the log-log plot was 0.812 which, after interpolation in the calibration curve, produce a kinetic order of 1.03-1 with respect to the activated carbón. This result agrees with previous studies using other techniques (10), which demónstrate the accuracy of the protocol developed to achieve the kinetic order of a reaction from calorimetric data. It must be said that these two processes of catalyzed decomposi-tion of the H202 are complex; specially the heterogeneous one. The effect of the H202 over the surface of the activated carbón could be of different types (13, 14); but the meaning of the calorimetric data is how much is the total heat evolution of the process; there is no easy way to obtain information about the individual steps occurring during the decomposition reaction (15). Then, the kinetic information, obtained from calorimetric data is, also, the kinetic information of the total process, and the order of reaction is for the global process of decomposition of H2O2, including any changes of the surface or any other process involved (16).
Finally, as a way to control the whole process, and because it is a calibration reaction for the calorimeter, too; the neutralization reaction of NaOH with HCl was studied. The results showed a second order for the kinetics which is what it is expected, and a reasonable agreement in the value of the kinetic constant. Howe-ver, it is necessary to mention that, due to the huge value of the second order constant of the neutralization process, it is not possible to obtain a clear distinction between zero, first or second order reactions, when the calorimeter data are taken at intervals of 1 second, as it was the case in the calorimeter used for this work. In this case, to see the difference in the calorimetric signal as a function of the kinetic order, it is necessary to collect data at time intervals in the range of the inverse of the kinetic constant of the reaction, it means at intervals around of 10-10 seconds. This is a warning, because the procedure to obtain the kinetic order of the reaction works only if the kinetic constant of the process under investigation, has a value that generate data in a scale of time longer than the time scale of data acquisition.
CONCLUSIONS
An easy way to relate, what we call, the "calorimetric order", with the kinetic order of the reaction was presented. The relationship was resumed in a linear equation, and it was used to obtain the kinetic order of three experimental processes: The decomposition of the H2O2 cataly zed by Fe3+ in homogeneous phase, the same process but catalyzed by activated carbon in heterogeneous phase, and the neutralization of NaOH with HCl. The latter reaction is used as a patron in ca-lorimetry, and in this case, it was helpful to control the entire procedure, allowing to establish a limit to the applicability of the protocol developed, particularly with respect to the magnitude of the kinetic constant of the studied reaction.
ACKNOWLEDGMENTS
This work had partial fi nancial support by the División de Investigación - DIB from Universidad Nacional de Colombia under the project HERMES code 3674. JAB thanks to Departamento de Química and Facultad de Ciencias from Universidad Nacional de Colombia for the fi nancial support to present this work at the "International symposium on Chemistry of solutions".
REFERENCES
1. Souillac, P.; Dave, P.; Rytting, J. The use of solution calorimetry with micellar solvent systems for the detection of polymorphism. International Journal of Pharmaceutics. 2002. 231: 185-196. [ Links ]
2. Marabi, A.; Mayor, G.; Raemy, A.; Bauwens, I.; Claude, J.; Burbidge, A.; Wallach, R.; Saguy, I. Solution calorimetry: A novel perspective into the dissolution. Food Research International. 2007. 40: 1286-1298. [ Links ]
3. Kayaert, P.; Li, B.; Jimidar, I.; Rombaut, P.; Ahssini, F.; Van den Mooter, G. Solution calorimetry as an alternative approach for dissolution testing of nanosuspensions. European Journal of Pharmaceutics and Biopharmaceutics. 2010. 76: 507-513. [ Links ]
4. Liu, J.; Zeng, x.; Deng, Y. ; Tian, A. Studies on thermokinetics of conse-cutive first-order reactions. Journal of thermal analysis. 1995. 44: 617-627. [ Links ]
5. Beezer, A.; Morris, A.; O'Neill, A.; Willson, R.; Hills, A.; Mitchell, J.; Connor, J. Direct Determination of Equilibrium Thermodynamic and Kinetic Parameters from Isothermal Heat Conduction Microcalorimetry. J. Phys. Chem. B. 2001.105: 1212-1215. [ Links ]
6. Mendoza, J. Estudio termocinético de la oxidación de fenol. Master Thesis, Universidad Nacional de Colombia, Bogotá, 2011. [ Links ]
7. Casado, J.; López-Quintela, A.; Lorenzo-Barral, F. The initial rate method in chemical kinetics. J. Chem. Educ.1986. 63:450-452. [ Links ]
8. Duesterberg, C.; Waite, T. Process Optimization of Fenton Oxidation Using Kinetic Modeling. Enviro-mental Science & Technology. 2006. 40: 4189-4195. [ Links ]
9. De Laat, J.; Giang Le, T. Effects of chloride ions on the iron(III)-ca-talyzed decomposition of hydrogen peroxide and on the eff ciency of the Fenton-like oxidation process. Applied Catalysis B: Enviromental. 2006. 66: 137-146. [ Links ]
10. Paternina, E.; Arias, J.; Barragán, D. Estudio cinético de la descomposición catalizada de peróxido de hidrógeno sobre carbón activado. Química Nova. 2009. 32: 934-938. [ Links ]
11. Espenson, J. Chemical kinetics and reaction mechanisms. New York, McGraw-Hill. 1981. p.170. [ Links ]
12. Hansen, L.; Hart, R. The art of calorimetry. Thermochimica Acta. 2004. 417: 257-273. [ Links ]
13. Jaramillo, J.; Álvarez, P.; Gómez-Serrano, V. Oxidation of activated carbon by dry and wet methods. Fuel Processing Technology. 2010. 91: 1768-1775. [ Links ]
14. Moreno-Castilla, C.; Ferro-García, M. A.; Joly, J. P.; Bautista-Toledo, I.; Carrasco-Marín, F.; Rivera-Utrilla, J. Activated Carbon Surface Modi-fcations by Nitric Acid, Hydrogen Peroxide, and Ammonium Peroxydi-sulfate Treatments. Langmuir. 1995. 11: 4386-4392. [ Links ]
15. O'Neil, M.; Beezer, A.; Tetteh, J., Gaisford, S.; Dhuna, M. Application of chemometrics analysis to comple-xity in isothermal calorimetry data. J. Phys. Chem. B. 2007. 111(28): 8145-8149. [ Links ]
16. Zielenkiewicz, W.; Margas, E. Theory of calorimetry. Dordrecht : Kluwer Academic Publishers, 2002. [ Links ]
