


 Inglês (pdf)
 Artigo em XML
 Referências do artigo
 Enviar este artigo por email
 Citado por SciELO
  Citado por Google
  Similares em
SciELO
Similares em
SciELO  Similares em Google
 Permalink
Introduction
An emerald is the green variety of the mineral beryl, which has the ideal formula, Be3A12Si6O18. Beryl is a cyclosilicate mineral constituted of six-membered rings of silica tetrahedra. The crystal structure of beryl stacks the silica rings one over the other forming channels that run parallel to the crystallographic c-axis of the emerald. The channels (not uniform cavities) with a diameter of approximately 0.51 nm separated by bottlenecks with a diameter of approximately 0.28 nm can be occupied by mineralising fluids that contain alkali ions (such as Na+, Li+, K+, Rb+, and Cs+), H2O and CO2 molecules. The mineralising fluids can be found in fluid inclusions [1-4]. The H2O molecules at the channels are held in two orientations relative to the c-axis. Water-I molecules have the vector connecting the two protons parallel to the c-axis. In contrast, water-II molecules have the previously mentioned vector perpendicular to the c-axis. Water-II molecules are found in beryl crystals containing alkali ions (Li, Na, or K) located at bottlenecks [2,5,6].
Colombia, Brazil, and Zambia are the largest producers of emeralds. Colombian deposits produce most of the world's high-quality emeralds. The monetary value of the emerald can be influenced by clarity, brilliance, colour, and geographical origin [7-9]. The determination of the geographical origin of the emeralds is based on gem characteristics linked to their geological formation. Geological environments imprint physicochemical attributes on emeralds that differentiate them by geographic origin. However, the geographic determination is complicated considering that emeralds can have a similar appearance even if they were formed in different geological environments, e.g., the emeralds from Colombia and those from Zambia are similar despite the different origin: Colombian emeralds come from sedimentary rocks, while Zambian emeralds are formed by the interaction of schist with beryllium-bearing pegmatites [3,7].
The determination of emerald origin requires the combination of several non-destructive analytical methods. Some of those methods are Fourier-Transform InfraRed spectroscopy (FT-IR), Ultraviolet-Visible spectroscopy (UV-Vis), Near InfraRed spectroscopy (NIR), Raman spectroscopy, inclusion analysis, and energy dispersive X-ray spectroscopy (EDX) [1,2,10-16]. FT-IR has been used mainly to differentiate natural from synthetic emeralds [11,17]. In addition, FT-IR can be used to distinguish emeralds by their geographical origin [13,14]. The reflectance FT-IR spectrophotometry is particularly well suited for the study of emeralds because it is a fast and cost-effective analysis [18].
On the other hand, chemometric data analysis procedures improve the ability of spectroscopy for sample classification, authentication, and denomination of origin. A standard chemometric method is Principal Component Analysis (PCA) [19]. PCA can be used for revealing relations between variables and between samples (e.g., clustering), detecting outliers, finding and quantifying patterns, and denomination of origin, especially in the fields of food [19-21], cultural heritage [23], and geology [24]. Several chemometric approaches have been reported for determining the geographical origin of natural emeralds through non-destructive chemical fingerprinting [16,23,24]. Reference [24] presents the PCA ofmajor, minor, and trace elements of worldwide emerald samples measured by Electron Microprobe Analysis (EMPA) and Secondary Ion Mass Spectrometry (SIMS). In reference [25], the authors present a case study focused on the major, minor, and trace element analysis of emeralds using laser ablation inductively coupled plasma time-of-flight mass spectrometry (LA-ICP-TOF-MS) and chemometric analysis, including PCA. These mentioned references show that PCA helps in the discrimination of emeralds from various sources. However, those references used expensive and specialised instrumentation, which is not easy to access. In this work, we take the same approach as the mentioned references but using reflectance FT-IR spectroscopy, a cheaper and more accessible technique. Three emerald groups with different geographic origins were studied. Two groups are Colombian emeralds, and the third group is Zambian emeralds, Figure 1. We analysed the FT-IR spectra of the mentioned geographical groups of emeralds using PCA, clustering, and Partial Least Squares-Discriminant Analysis (PLS-DA), which readily discrimínate the geographical origin of the set of emeralds studied.
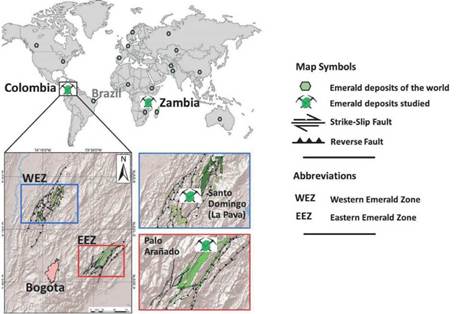
Figure 1 Map of the studied emerald zones. Santo Domingo (La Pava mine) is located in the western Emerald Zone and Palo Arañado in the Eastern Emerald Zone of Colombia. The third group is the emeralds from Kafubu - Zambia.
The geographic origin of the emerald is a significant value factor in the gem trade. Therefore, reliable provenance determination on such gemstones is requested by the trade and is offered as a service by specialised gemological laboratories. This study is intended to demonstrate how PCA in regards to reflectance FT-IR spectra can separate three emerald groups according to their geographical origin. As mentioned before, two groups come from Colombia, one from the eastern emerald zone, Chivor district, and the other from the western emerald zone, Muzo district. The third group comes from Kafubu - Zambia (Figure 1). Also, it is important to note that the PCA results were verified, supported, and extended using clustering and PLS-DA.
Material and Methods
Samples
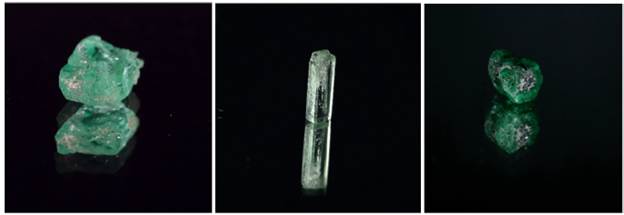
The total number of emeralds studied was 84: 26 from Palo Arañado, a deposit located in the Colombian eastern emerald zone (4°53' 42" N, 73°20' 51" W) with a light green colour (PA); 28 from La Pava mine -Santo Domingo tunnel in the Colombian western emerald zone (5°32' 52" N, 74°09' 49" W) with a light green to green colour (SD); and 30 from Kafubu - Zambia (13°05' 32" S, 28°08' 22" E) with a dark green colour (Z). The analysed emeralds belong to the Centro de Desarrollo Tecnológico de la Esmeralda Colombiana CDTEC. The Colombian samples were collected according to their stratigraphic position, hydrothermal alteration degree, and emerald occurrences. Whereas the Kafubu - Zambian emeralds were collected according to their occurrences. The samples obtained are type A (mined by a field trip team) [26]. All samples were cleaned with ethyl alcohol before collecting the spectra. Three representative samples are shown in Figure 2.
Characterisation of emeralds by their Reflectance Infrared spectrum
The FT-IR analysis was performed using a Scientific Nicolet 6700 spectrometer (Thermo Fischer Scientific, Waltham, MA, USA) with the diffuse reflectance accessory. The spectra were acquired from 7,501 to 399.2 cm-1 with 4 cm-1 resolution and 32 scans per emerald. All diffuse reflectance spectral data were collected in triplicate and were perpendicular to the c-axis. The mean of the triplicate spectra for each emerald was used for the PCA, the clustering, and the PLS-DA.
Statistical Analysis
The reflectance FT-IR spectra were processed and analysed using R and RStudio software [27,28]. The first step in processing the spectra was smoothing, using the Savitzky-Golay method from the Pracma package [29]. Then, a baseline correction was performed using the polylinear fit function from the Baseline package [30]. The PCA function was used from the FactoMineR package [31]. Data visualisation was carried out using the Factoextra [32] and the mdatools [33] packages. Clustering was made using the FactoMineR package after PCA, and PLS-DA was carried out using the mdatools package.
Results and discussion
Main features of the emeralds' reflectance FT-IR spectra
Typical reflectance FT-IR spectra from the 84 emeralds after pretreatment (smoothing and baseline correction) are shown in Figure 3 (region from 2,271 to 4,000 cm-1) and Figure 4 (region from 4,000 to 7,249 cm-1).
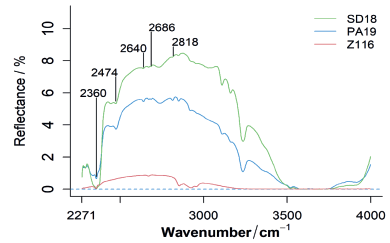
Figure 3 Typical reflectance FT-IR spectra of the emeralds studied in this work. The region from 2000 to 4000 cm-1 with the characteristic peaks found in the Colombian compared to the Zambian emeralds. From bottom to top: Kafubu - Zambia, Palo Arañado (Colombia, eastern emerald zone, Chivor district), and Santo Domingo tunnel - La Pava Mine (Colombia, western emerald zone, Muzo district).
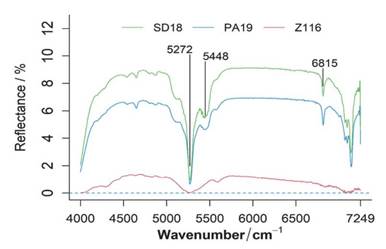
Figure 4 Reflectance FT-IR spectra with the characteristic peaks found in the Colombian emeralds compared to the Zambian emeralds. The region is from 4,000 to 7,249 cm-1. From bottom to top: Kafubu - Zambia, Palo Arañado (Colombia, eastern emerald zone, Chivor district), and Santo Domingo tunnel - La Pava Mine (Colombia, western emerald zone, Muzo district).
The pretreated data were used for PCA, and only the region between 2,271 to 7,249 cm-1 was considered, eliminating zones with poor signal and too much noise. The spectra in Figure 3 and Figure 4 have noticeable diferences. First, the reflectance intensity of the Colombian emeralds' spectra is higher than that of the Zambian emeralds, probably because the Colombian samples were thinner than the Zambian ones. Second, some bands are only present in the Colombian emeralds' spectra, or they are more evident than those in emeralds from Zambia.
The region from 2,000 to 4,000 cm -1
Some of the most relevant absorptions of the emeralds' FT-IR spectra are related to the stretching vibrations of the water in the silica ring channels and the vibrations of other molecules such as CO2. Additionally, the latter vibrations are also influenced by cations in those channels. In the 2,000 to 4,000 cm-1 range (Figure 3), Colombian emeralds show a reflectance peak centred at 2,360 cm-1. In the literature, the peak at 2,359 cm-1 is linked to the CO2 vibration [1,4]. The subtle signal at 2,818 cm-1 is attributed to HCl [34]. The zone around 3,500 cm-1 has been linked to the stretching of water molecules [35]. However, in the present study, all the samples have a reflectance close to zero in this zone, hindering any possible peak observation in this region; see figure 3 around 3,500 to 4,000 cm-1. Nonetheless, at least one report [36] mentioned weak bands in this zone.
The region from 4,000 to 7,249 cm -1
In the 4,000 to 7,249 cm-1 range (Figure 4), the emeralds from Colombia show a strong, thin peak around 5,272 cm-1 associated with type II water [1,34], and a wide medium peak at 5,448 associated with type I water [1,36]. The Zambian emeralds show the 5,272 cm-1 peak. However, it is wider than that of the Colombian emeralds, and the medium peak around 5,448 is absent. Zambian emeralds have the 5,272 cm-1 signal as a wide medium peak which is more related to type II water. Moreover, the Colombian emeralds have a clear peak at 6,815 cm-1 attributed to type I water, which is at most only insinuated in the Zambian emeralds. The literature reports the 6,820 cm-1 band for type I water and the 6,849 cm-1 band for type II water [1,36]. The intensity of these two bands has been associated with the alkalinity of the environment where the emerald grew. Usually, the intensity of the band at 6,820 cm-1 is higher, while the intensity of the band at 6,849 cm-1 is lower for type I water (emeralds with low alkalinity). The literature confirms that the emeralds from Colombian tend to present higher peaks related to type I water, while Zambian emeralds present higher peaks related to type II water [14,35].
Analysis using the PCA of each of the three groups of emeralds
After pretreatments, PCA was applied to each of the three groups of emeralds separately to detect outliers and extreme individuals.
Palo Arañado emeralds, Colombian eastern emerald zone, Chivor district
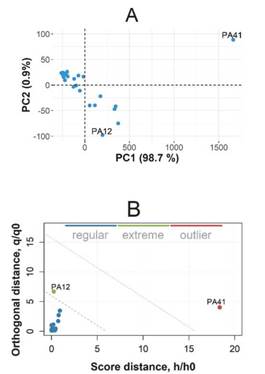
Figure 5 shows the PCA results for the samples from Palo Arañado. Figure 5A is the score plot of the first two principal components (PCs), where each reflectance FT-IR spectrum is represented as a point. Notice that most samples are grouped except for emerald PA41. Figure 5B shows the orthogonal distances where sample PA41 is once again apart from the other samples. According to Figure 5, sample PA41 is an outlier, which is reasonable because PA41 has higher reflectance than the other samples; this emerald differs from others due to its unique cylindrical and thin shape. Based on these facts, PA41 was eliminated from subsequent studies. Also, emerald PA12, although it is just an extreme individual, was removed to have a better classification.
Santo Domingo tunnel - La Pava mine emeralds, Colombian western emerald zone, Muzo district
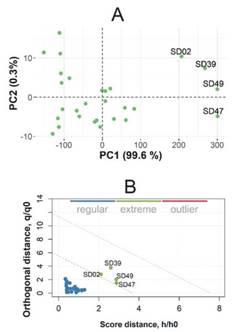
Figure 6A shows the first score plane of the PCA results for the Santo Domingo samples. In this case, there are four extreme samples: SD 02, 39, 47, and 49, see Figure 6B. These samples were also excluded to obtain a more precise classification. The SD emeralds have no outliers.
Kafubu - Zambia emeralds
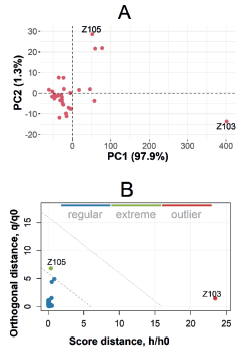
Figure 7 shows the PCA results for the Zambian samples where one extreme, Z105, and one outlier, Z103, were identified. Figure 7A shows the first plane of the individuals (score plot PC2 vs. PC1), where Z103 and Z105 are far from the others. This fact is confirmed in Figure 7B, where Z105 is in the zone of extreme observations, and Z103 is in the outlier zone. Thereupon, we decided to exclude both samples, Z103 and Z105, from the following analysis.
The PCA of the whole set of emeralds, after removing the outlier and the extreme samples
Once the outlier and extreme samples were eliminated, a PCA was made using the new set of 76 emeralds: 24 from PA, 24 from SD, and 28 from Z. Figure 8 A shows the first plane of the PCA, where PC1 and PC2 explain 98.9 % and 0.5 % of the total variance, respectively.
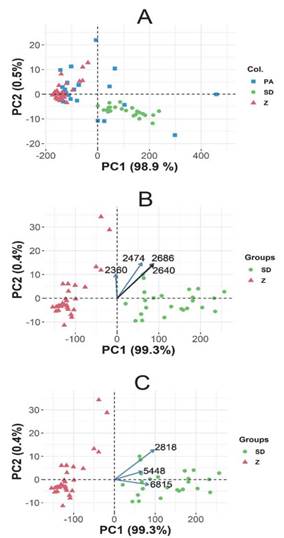
Figure 8 The principal component analysis of the emeralds reflectance FT-IR spectra. A. The first plane of individuals for 76 emeralds. The outliers and extreme samples were excluded. Palo Arañado (blue squares) PA, Santo Domingo tunnel - La Pava mine (green circles) SD, and Zambia (red triangles) Z. B and C are biplots for the 52 emeralds after removing PA emeralds, outliers, and extreme samples. Sd emeralds are represented with green circles, Z emeralds with red triangles, and wavenumbers with vectors. In B, the wavenumbers 2,474; 2,640; and 2,686 cm-1 correspond to deuterated water and 2,360 cm-1 to CO2. In C, 2,818 cm-1 corresponds to chloride, while 5,448 and 6,815 cm-1 to type I water.
In Figure 8A, the SD emeralds are together towards the bottom right zone of the plane, while the Z emeralds are grouped towards the left upper side. On the contrary, the PA emeralds are scattered over the plane, and only a few samples seem close to each other. This behaviour is due to the dispersion in the intensities of the reflectance signals in the reflectance FT-IR spectra of the PA samples, while the SD emeralds always have significant intensity signals, and the Z samples always have comparatively lower intensities. Consequently, the PA samples are sometimes close in reflectance intensity to the SD emeralds and sometimes are close to the Z samples or neither. Following a detailed analysis of the latter, the emeralds shapes, the reflectance FT-IR spectra, and the PCA results, we have concluded that the size and form of the emerald is a critical factor in generating the mentioned dispersion in the reflectance FT-IR spectra of the PA emeralds, and it must be considered more rigorously in future works.
The PCA of the selected set of SD and Z emeralds
The PCA results for the Santo Domingo and Zambia samples show a clear separation between them.
Figures 8B and 8C, show biplot graphs where emeralds are represented with circles (SD) and triangles (Z) and wavenumbers with vectors. The PC1 and PC2 explain 99.3 % and 0.4 % of the total variance, respectively. Then, the first plane of the individuals is a good description of the samples' behaviour and a valuable tool to differentiate SD emeralds from Z emeralds.
In the biplots, the vectors represent the wavenumbers of the most representative peaks of the emeralds reflectance FT-IR spectra. The vector magnitude projected over the abscissas positively correlates with the contribution of those wavenumbers to PC1, which explains 99.3% of the total variance of the spectra. Therefore, the wavenumbers with the most significant contribution to this PC1 will be the most valuable criteria for separating the groups of emeralds by their geographical origin.
In consequence, and according to the previous discussion, we have found two groups of wavelengths that are the most relevant in the emeralds' reflectance FT-IR spectra:
The peaks centered at 2,474; 2640; and 2,686 cm-1 in the studied emeralds (see Figure 3). These FT-IR spectra peaks are related to deuterated water vibrations [35]. Figure 8B shows the biplot where it is clear that the mentioned wavenumbers have a significant correlation to the PC1 (0.969, 0.985, and 0.984, respectively), and they are represented by the magnitude and direction of the vectors, which means that those wavenumbers are helpful when differentiating the two groups of emeralds. On the other hand, in the same figure 8B, the reported peak of CO2 vibration in emeralds [4], and here centred at 2,360 cm-1 for the studied emeralds, has its orientation towards the PC2 and lower magnitude with respect to the other wavenumbers in the first plane of the individuals (the correlation to PC1 is just -0.284 and to PC2 is 0.826). The interpretation can be that the 2,360 cm-1 peak is more related to the Z emeralds because it points upwards in the same direction where some of the Zambian emeralds are located. The general effect of the two groups of wavenumbers mentioned (related to deuterated water and CO2) is that the Zambian emeralds (Z) are upside towards the left, and the Colombian Santo Domingo tunnel - La Pava mine emeralds (SD) are towards the right and downside of the first individual plane. It is important to mention that the low value of the explained variance of PC2 (only 0.4 %) draws into question the conclusions regarding PC2; however, Figure 8B helps to support these conclusions.
The peaks at wavelengths of 2,818 cm-1; 5,448 and 6,815 cm-1. The 2,818 cm-1 peak is attributed to chloride vibrations [34], and the 5,448 and 6,815 cm-1 peaks are related to type I water [1,36]. These wavenumbers have a considerable correlation to PC1 (0.989, 0.997, and 0.998, respectively), which means that those FT-IR peaks are helpful to differentiate SD from Z emeralds, Figure 8B and 8C.
The previous results were extended and confirmed using clustering and PLS-DA. In this case, the PA samples were not excluded. The clustering made to the PCA is shown in Figure 9. The most important result of the clustering is the clear discrimination between the Z and SD emeralds using only the reflectance FT-IR spectra. This can be clearly seen in Figure 9, where there are three clusters. The first cluster contains all the samples from Zambia and 11 samples from PA; the second cluster contains all the SD samples and eight emeralds from PA, and the third one contains five samples all from PA.
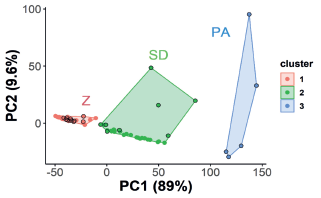
Figure 9 The studied emeralds clustering from the first plane of the PCA. The algorithm discriminates three clusters: one with all Z emeralds and 11 from PA, a second with all the SD emeralds and eight from PA, and a third with only PA emeralds. The circles with a black border are the emeralds from PA. Observe that some of those black border circles (PA emeralds) are in the SD or Z clusters.
On the other hand, the PLS-DA results are consistent with the studies made by PCA (Figure 8A) and clustering (Figure 9). Hence, the multivariate tools used in this work have proven powerful in identifying the geographical origin of emeralds. In this sense, we differentiated Colombian (SD) from Zambian emeralds. However, the Colombian PA emeralds were not clearly separated from the other samples. Thus, the database of emeralds must be increased and depurated to obtain a reliable and well-established set of emeralds classified by geographical origin. Furthermore, the FT-IR spectra must be complemented with UV-Vis spectra, Raman [35,37,38], and other available measurements to improve the multivariate analysis prediction capabilities and help with the correct identification of PA samples, which showed high dispersion in this work.
Conclusions
The reflectance FT-IR spectra of emeralds following pretreatment and analysis with PCA, clustering, and PLS-DA allowed the identification of vibrational bands associated with their chemical composition. In this study, the previously reported characteristic bands of emeralds centred at 2,474; 2,640; and 2,686 cm-1 and related to deuterated water vibrations, 2,818 cm-1 attributed to chloride vibrations and 5,448 and 6,815 cm-1 which corresponded to type I water vibrations showed 100% efficiency in distinguishing the emeralds from Santo Domingo tunnel - La Pava Mine Colombian western zone (Muzo district) from the Kafubu - Zambian emeralds. Regarding the Colombian PA emeralds (Chivor district), although it was not possible to differentiate all the samples from those from SD and Z, PA has a subset of individuals clearly different from the others, which means that more studies must be undertaken to resolve this issue.

