


 English (pdf)
 Article in xml format
 Article references
 Send this article by e-mail
 Cited by SciELO
  Cited by Google
  Similars in
SciELO
Similars in
SciELO  Similars in Google
 Permalink
Introduction
The fluid that moves in the extracellular space of the plant, consisting of the cell wall matrix and the intercellular spaces, is usually called apoplast. It contains a wide variety of molecules that participate in various processes that may include: (i) growth regulation, (ii) cell wall modification, (iii) protection against dehydration and environmental stress, (iv) transport, (v) homeostasis (vi) cell-cell adhesion, (vii) gas exchange, and (viii) plant-pathogen interactions [1]-[5]. Pathogens must traverse the apoplast to reach host cells in several host-pathogen associations. Consequently, different plant compounds at this tissue level compartment are accumulated to constitute a defensive barrier against pathogens and, therefore, wall polymers, antioxidants, and antimicrobial compounds, among others, can appear in the apoplast [2], [6], [7]. The pathogen recognition at this level is based on apoplastic sensors that allow the detection of foreign components and subsequently trigger plant defense responses at the intra and extracellular levels. The perception of extracellular markers, such as pathogen-associated molecular patterns (PAMP) or damage-associated molecular patterns (DAMP), is mediated by pattern recognition receptors (PRR) linked to the plasma membrane, which indicates a prevalence of the pathogen invasion through the apoplastic pathway [3], [8]-[12].
Despite the importance of apoplastic proteins and metabolites during plant-pathogen interactions, these have been poorly studied compared to those stored at the intracellular level. This fact is predominantly due to technical difficulties in obtaining the apoplastic fluid free of those proteins and metabolites inside the cell [5]. So far, various studies have been carried out focused on studying the apoplastic proteins in different plant-pathogen interactions [3], [5], [13]. In contrast, the reports analysing the apoplastic metabolites during pathogen-host interactions are even scarcer. To date, there is only one study focused on apoplastic metabolites and proteins in Arabidopsis thaliana leaves during its interaction with Verticillum longisporum [14]. Research on plant apoplast is very relevant. Therefore, suitable protocols are required for the apoplastic metabolite extraction in those plant species to be first studied. This procedure is even more decisive in applying highly resolutive separation techniques, based on holistic approaches, whose contamination with cytoplasmic molecules can generate drawbacks when interpreting results [3]. The most used method for obtaining apoplastic fluid is infiltration, vacuum, and centrifugation [3], [15]. In this regard, the selection of the infiltration solution is a fundamental step in this process, resulting in the largest number of metabolites to be extracted for subsequent analysis. In the only report on investigating the apoplastic metabolites from a plant under biotic stress, a 100 mM KCl/0.003% Triton X-100 solution was used [14].
Non-targeted metabolite-oriented analyses require experimental conditions to optimise the number of separated compounds, extracted from the plant sample, to be analysed according to the selected analytical technique. For instance, in the case of liquid chromatography coupled to mass spectrometry (LC-MS), the analytical success requires the proper selection of extraction conditions and the subsequent separation. The separation should consider various quality parameters such as the resolution, selectivity, number of theoretical plates, and duration of the analysis [16].
In the present study, the workflow for selecting the most suitable experimental conditions for the analysis of metabolites that occurred in the apoplast of carnationroots and stemsis described, including both the apoplastic fluid extraction conditions and those used for LC analysis. Accordingly, we evaluated different conditions for selecting the best infiltration solution and the proper elution profile to obtain the apoplastic fluid and separate phenolic-like metabolites, respectively. Further studies may use these experimental conditions for those metabolite-focused analyses focused on identifying resistance-related metabolites to vascular wilting, an economically relevant disease for the carnation caused by the pathogenic fungus Fusarium oxysporum f. sp. dianthi (Fod). In this regard, we lastly applied the selected extraction and separation conditions for recognising the differential phenolic-related metabolic characteristics of apoplast-derived extracts from roots and stems of two carnation cultivars with contrasting resistance to Fod by means of multivariate statistics. Analogously, future experiments can also use this proposed workflow to select experimental conditions during the initial study of apoplastic metabolites in other plant species.
Materials and methods
Plant material
Stems and roots of indexed, pathogen-free, 3-to-4-week rooted cuttings of carnation (Dianthus caryophyllus L) were used. The present study employed two susceptible cultivars (i.e., 'Gran Slam' and 'Solex') and a resistant cultivar (i.e., 'Golem') to Fod. These carnation cultivars were donated by the company Florval SAS, Headquarters QFC (Gachancipa-Cundinamarca, Colombia).
Carnation apoplastic fluid extraction
The apoplastic metabolites of carnation were extracted using the infiltration technique with vacuum-centrifugation [17]. Carnation roots or stems (2.5 g) were used, cut into 0.5-1.0 cm segments in length. These segments were used to evaluate the following infiltration solutions: I = NaH2PO4-Na2HPO4 0.1 M pH 6.5/NaCl 50 mM, previously employed to obtain apoplastic fluid for proteomic studies in carnation [17]; II = 50 mM NaCl employed to modify ionic strength, and III = 100 mM KCl/ Triton X-100 0.003% v/v previously employed in the only metabolomics and proteomics-based study in plant-pathogen interaction [14].
Verification of intracellular-component-free apoplastic fluids
The activity of malate dehydrogenase (MDH), often used to estimate cell membrane damage levels, was measured to evaluate whether the obtained apoplastic fluids presented contamination with intracellular molecules generated by a possible breakdown of the plasma membranes [5]. Extraction of total plant material was performed as described by Ardila et al., 2014 [4] and carnation apoplastic fluid was obtained as previously described. The activity of this enzyme was determined according to the conditions reported by Martinez et al. (2017) [17].
Selection of infiltration solution for metabolite analysis
The infiltration solution to be used for the suitable extraction of apoplastic fluid from carnation roots and stems for metabolite analysis was assessed based on the results following the measurement of the total phenolic, flavonoid, and sugar contents.
Determination of total phenolic content (TPC)
TPC was carried out using the Singleton & Rossi method [18] adapted by Cuervo (2018) [19]. For this determination, apoplastic fluid (50 μL) was mixed with Folin Ciocalteau's reagent (100 μL) and double-distilled water (ddH2O) (100 μL). The mixture was incubated for 5 min. Subsequently, 7.0% w/v Na2CO3 (200 μL) and ddH2O (200 μL) were added, the resulting mixture was stirred, and the absorbance was measured in a spectrophotometer (Genesys uv 10, ThermoFisher, USA) at 764 nm after 1 h in the dark. Gallic acid was used as a standard. The result was then expressed as mg of gallic acid equivalents per g of fresh plant material (mg GAE/g FPM). Each determination was made using biological triplicate and analytical triplicate.
Determination of total sugar content (TSC)
TSC was carried out by the method set forth by Dubois et al. 1956 [20], adapted by Cuervo (2018) [19], using D-glucose as a sugar standard. ddH2O (195 μL) and apoplastic fluid (15 μL) were mixed in a 2.0 mL eppendorftube. Subsequently, freshly prepared 80% w/v phenol (200 μL) was added and vortexed for 1 min. Concentrated sulfuric acid (1.0 mL) was then added and vortexed for 1 min. Samples were cooled to room temperature in the dark. Absorbance readings were measured in a spectrophotometer (Genesys uv 10, ThermoFisher, USA) at 490 nm. The reaction blank comprised distilled water (210 μL), 80% w/v phenol (200 μL), and concentrated sulfuric acid (1.0 mL). The content was expressed as mg of glucose equivalents per g of fresh plant material (mg GE/g FPM). Each determination was made using biological triplicate and analytical triplicate.
Determination of total flavonoid content (TFC)
TFC was carried out using the colorimetric method reported previously [21], [22] with slight modifications. An initial reaction mixture was prepared, involving apoplastic fluid (100 μL), 5% w/v NaNO2 solution (30 μL), and ddH2O (100 μL). After 5 min, 10% w/v AlCl3 solution (60 μL) was added. After incubating for 6 min at room temperature, 2.0 M NaOH (100 μL) was added, and the absorbance at 510 nm was then measured in a spectrophotometer (Genesys uv 10, ThermoFisher, USA). (+)-catechin (Sigma®) was used as a flavonoid standard. The results were expressed as mg of catechin equivalents per g of fresh plant material (mg CE/g FPM). Each determination was made using biological triplicate and analytical triplicate.
Preparation of polar extracts for metabolite analysis
Aliquots of apoplastic fluids (200 μL) were extracted with a mixture of methanol (150 μL) and methyl tert-butyl ether (MTBE) (500 μL) according to the protocol reported by Matyash et al. (2008) [23] and Floerl et al. (2012) [14]. The resulting mixtures were shaken for 1 h in the dark, and ddH2O (120 μL) was then added. Subsequently, they were incubated for 10 min and centrifuged for 15 min at 1500 rpm, and 20 °C to allow phase separation. The polar phase of each sample was carefully transferred to a new tube avoiding contamination with the apolar one. The transferred polar phase was then evaporated using a speedback-type vacuum concentrator. The obtained residue was reconstituted in acetonitrile/methanol/water (1:1:12 v/v/v) mixture (200 μL), the resulting mixture was vortexed for 1 min until complete homogenisation, and lastly filtered using a 0.2 μm polytetrafluoroethylene (PTFE) membrane.
Selection of conditions for the metabolite chromatographic separation
Each obtained polar extract was analysed by means of liquid chromatography coupled to mass spectrometry (LC-MS) using a Shimadzu UFLC Prominence system. This was equipped with an SPD-M20A multi-wavelength photodiode array detector (DAD) and a Shimadzu LCMS2020 mass spectrometry detector with a quadrupole analyser and electrospray ionisation (ESI). The metabolite separation was carried out using a Synergy HydroRP C-18 column (4.6 mm x 150 mm, 4 um). The flow was 0.7 mL/ min, and the injection volume was 10 μL (50 μg dry extract/μL). The mobile phases comprised a mixture of solvent A (0.1% formic acid - water) and B (acetonitrile). The separation method was conditioned after three elution trials. The whole separation time ranged from 60 to 65 min, depending on the elution profiles presented on Table 1, until the selected signals reached reasonable chromatographic quality parameters. Detectors dually monitored the separation at 270 nm and MS scan mode (150-10000 m/z). The separation method was selected considering resolution, selectivity and number of theoretical plates using two reference signals (A and B) that were recognised as common in the three separation trials. Additionally, high-resolution MS (HRMS) data were also acquired using a Shimadzu UFLC Prominence system coupled to a Bruker MicrOToF-Q II detector with a Quadrupole-Time of Flight (QToF) analyser and ESI. Identical chromatographic conditions mentioned above were used. ESI was operated in positive and negative ion modes (scan 100-1500 m/z), capillary voltage at 4.5 kV, de-solvation line temperature at 400 °C, nitrogen as nebuliser gas at 4 Bar, drying gas at 8 L/min, quadrupole, and collision energy at 7 and 20 eV, respectively.
Table 1 Elution profiles of the separation trials for the LC-DAD-ESI-MS analysis of extracts from carnation apoplastic fluids.
| First trial | Second trial | Third trial | ||||||
|---|---|---|---|---|---|---|---|---|
| Time (min) | %Ba | Elution | Time (min) | %Ba | Elution | Time (min) | %Ba | Elution |
| 0-3 | 10→10 | Isocratic | 0-5 | 0→0 | Isocratic | 0-5 | 0→0 | Isocratic |
| 3-13 | 10→18 | Gradient | 5-14 | 0→18 | Gradient | 5-14 | 0→10 | Gradient |
| 13-18 | 18→18 | Isocratic | 14-19 | 18→18 | Isocratic | 14-19 | 10→10 | Isocratic |
| 18-27 | 18→32 | Gradient | 19-28 | 18→32 | Gradient | 19-30 | 10→30 | Gradient |
| 27-45 | 32→100 | Gradient | 28-45 | 32→100 | Gradient | 30-32 | 30→30 | Isocratic |
| 45-48 | 100→100 | Isocratic | 45-48 | 100→100 | Isocratic | 32-50 | 30→90 | Gradient |
| 48-62 | 100→10 | Gradient | 48-62 | 100→0 | Gradient | 50-53 | 90→90 | Isocratic |
| 62-65 | 10→10 | Isocratic | 62-65 | 0→0 | Isocratic | 53-57 | 90→0 | Gradient |
| 57-60 | 0→0 | Isocratic | ||||||
aVariations in percentage of acetonitrile (ACN) as phase B within the elution solvent along separation method.
Metabolite profile-derived data processing
The MS data obtained from LC-ESI-MS were pre-processed in MZmine 2.17, comprising peak detection, baseline correction, and deconvolution [24]. The pre-processed data were exported as a .csv format to build the feature intensity table (FIT), i.e., (samples x features) and imported into Matlab R2013. On the other hand, the data obtained from LC-DAD were extracted as an ACSII format and imported into OriginPro 8.5 to build a datasheet. In this datasheet, intensity data in mUA (milliunits of absorbance) at 270 nm were included every 0.01067 s of the whole chromatogram (i.e., bins) and organised into a matrix (samples x bins), namely the bin intensity table (BIT). FIT and BIT datasheets were jointly aligned by retention time using the COW (correlation optimised warping) algorithm obtained from http://www.models.kvl.dk/ [25], [26]. This alignment method operates by segments and makes alignments of a sample with another reference by means of segment expansions using linear interpolation [27]. The BIT-aligned FIT was then filtered using the UV data to select only those phenolic-like features having absorbance at 270 nm. The other non-phenolic features were discarded for the present analysis. Once the FIT data were aligned and filtered, a normalisation by sum and autoscaling (unit variance scaling) was finally performed [28], [29], to distribute the data for adequate comparisons and further statistical analyses.
Statistical analysis
Data from TPC, TSC, and TFC obtained after extraction using different infiltration solutions and enzymatic activities for controlling contamination were reported as means ± standard deviation (SD). The Shapiro-Wilks test assessed the normal distribution of data. Once normality was verified, the significant differences between means were analysed by means of one-way ANOVA followed by the post-hoc Tukey test (p < 0.05) using Statgraphics software version 5.1. On the other hand, the pre-processed, filtered FIT datasheet was analysed by means of multivariate statistics [30], using principal component analysis (PCA), hierarchical clustering analysis (HCA), and orthogonal partial-least squares-discriminant analysis (OPLS-DA) [31]. These analyses led to the construction of the respective scores plot, dendrogram, and the variable importance in projection (VIP) scores plot, using the statistical module of MetaboAnalyst 4.0 [32].
Annotation of the main carnation constituents
Annotation procedure was employed to adequately communicate the metabolite identity of selected main compounds following the previously-proposed confidence levels [33]. In the present study, we reached the category related to the tentative candidates (level 3). Levels 1 (confirmed structure) and 2 (probable structure) were not possible due to a lack of authentic standards and insufficient information from the combined HRMS and UV spectral data to communicate a unique structure (e.g., exact isomers) of the specialised metabolites detected, filtered, and processed. Molecular formulas were predominantly deduced from the accurate mass of the quasi-molecular ion obtained in negative ([M-H]-) and positive ([M+Na]+) ion modes. Hence, the annotation was finally achieved by using the combined diagnostics of the deduced molecular formulas and the typical MS fragments, supported by UV spectra, phylogenetic filtering, chromatographic behaviour (if possible), and data comparison with different databases (e.g., dictionary of natural products, Metlin, KNApSAcK, PubChem).
Results and discussion
Selection of the infiltration solution to obtain apoplastic fluid for metabolite analysis
Three different infiltration solutions were evaluated during the selection of suitable conditions for obtaining metabolites in the apoplastic fluid of carnation. The results obtained from measurements of total sugar, phenolic, and flavonoid contents and, additionally, the intracellular contamination evaluated through MDH activity led to the selection of the most appropriate infiltration solution.
Regarding the MDH activity of apoplast-derived extracts from carnation roots, the obtained values for evaluating the intracellular contamination employing this enzymatic marker did not constitute statistically significant differences (p > 0.05) for the three infiltration solutions. In this sense, MDH activity exhibited ca. 1% compared to crude root extracts, which agreed with what has been reported in other studies. Some examples are related to the apoplastic fluid from Brassica napus L and ryegrass leaves during senescence [34], and other plant-pathogen interactions, such as rape and A. thaliana leaves infected with Verticillum longisporum [14], [35] or wheat leaves infected with Zymoseptoria tritici [36]. This test was not carried out on stems since previous studies on the proteomic analysis found that this buffer solution does not generate cell membrane rupture and subsequent contamination with the respective intracellular content [17], to the same extent as observed in carnation roots after our trials. These results indicated that the three test infiltration solutions could adequately remove the apoplastic fluid from carnation roots without intracellular contamination, hence the selection criteria were required to be expanded by examining the total content outcome (Figure 1).
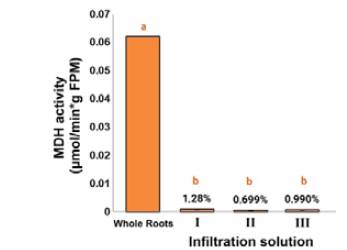
Figure 1 Determination of the presence of malate dehydrogenase (MDH) activity in carnation roots (susceptible cultivar 'Gran Slam'). Total plant material and apoplastic fluid of carnation obtained with infiltration solutions I (0.1 M NaH2PO4-Na2HPO4 pH 6.5 / 50 mMNaCl), II (50 mMNaCl), III (100 mMKCl / Triton X-100 0.003% v/v). MDH activity is expressed as means ± standard deviation (SD) (n = 3) and measured as μmol of MDH per minute and g of fresh plant material (μmol MDH/min*g FPM). Different lowercase letters indicate significant differences between treatments (p < 0.05).
In the case of total sugar content (TSC) (Figure 2A), infiltration solutions I (i.e., NaH2PO4-Na2HPO4 0.1 M pH 6.5 / 50 mM NaCl) and III (i.e., 100 mM KCl / Triton X-100 0.003% v/v) promoted the highest sugars extraction for stems and roots, respectively. Comparing both organs, their TSC values of stem apoplastic fluid were higher than that of the roots using infiltration solutions I and II. This result was expected considering that stems are the closest organ to the leaves, which are the place in the plant where carbohydrate synthesis occurs and from where sugars are transported to other organs and tissues [37]. Similar results have been reported in previous studies on carnation, whose TSC levels in stem apoplast are 3-fold higher than those found in the root apoplast [19]. Considering that the sugar levels did not exhibit significant differences between organs with infiltration solution III, we deduced that such an infiltration solution might not be suitable for the process under study. The importance of selecting an infiltration solution, which allows obtaining the highest reliable amount of these compounds to be subsequently analysed by means of chromatographic techniques, is based on the role of said compounds in plant-pathogen interactions. Studies carried out on this plant model have reported a wide variety of glycosylated compounds that may have a role highly associated with the carnation defense [38]. In other models, soluble sugars have been proposed as being involved in the cell osmotic balance and the reactive oxygen species equilibrium. These events comprise the plant response to oxidative stress generated by biotic or abiotic factors as a part of the physiological and biochemical mechanisms that support plant survival [39].
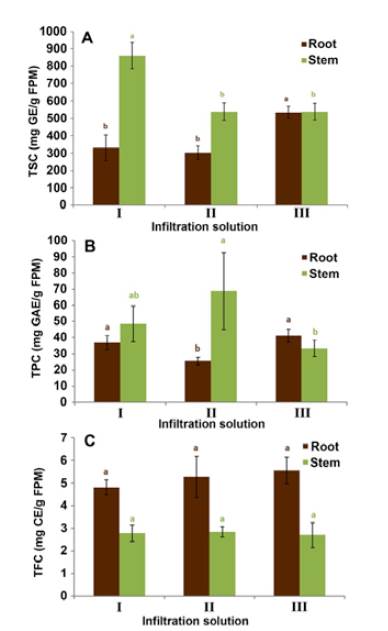
Figure 2 Determination of the total content of sugars (A), phenols (B) and flavonoids (C) (TSC, TPC, and TFC, respectively) in the apoplastic fluid of carnation roots and stems (susceptible cultivar 'Gran Slam'), using infiltration solutions I (0.1 M NaH2PO4-Na2HPO4 pH 6.5 / 50 mM NaCl), II (50 mM NaCl), and III (100 mM KCl / Triton X-100 0.003% v/v). TSC measured as mg of glucose equivalents per g of fresh plant material (mg GE/g FPM); TPC measured as mg of gallic acid equivalents per g of fresh plant material (mg GAE/g FPM); TFC measured as mg of catechin equivalents per g of fresh plant material (mg CE/g FPM). The vertical bars represent each mean's standard deviation (SD) (n = 3). The organs were independently evaluated. Different lowercase letters indicate significant differences (p <0.05) between the test infiltration solutions per organ.
On the other hand, the apoplastic fluid-derived extracts that exhibited the highest total phenolic content (TPC) were obtained using infiltration solutions I and II for stems and I and III for roots (Figure 2B). These results are within the range previously reported for TPC values from carnation whole plant tissue, i.e., 40-120 mg GAE/g FPM [38]. Remarkably, in the case of total flavonoid content (TFC) (Figure 2C), there were no significant differences between the three solutions used to prepare extracts from both stem and root apoplastic fluids. However, it is relevant to highlight that this total content measurement showed higher values for root apoplast than for stems. Several studies have proposed that some flavonoid-like phenolic compounds could be associated with resistance, acting constitutively as phytoanticipins [40]-[42]. This fact might rationalise the observed higher flavonoid amount in apoplastic root fluid than stem fluid. In addition, there are many phenomena related to flavonoids taking place in roots, such as nutrient uptake [43], growth [44], and interaction with soil microorganisms, including pathogens such as Fod, whose plant entering is favoured through the roots. This outcome was in accord with those TFC values from carnation whole plant material determined in previous studies since higher flavonoid accumulation in root tissue was also evidenced [38]. The biosynthesis of these compounds is apparently regulated according to the test organ and its adaptive requirements, whose phenomenon has also been reported in other species [45], [46].
The pooled results obtained for TSC, TPC, and TFC showed that the infiltration solutions with the highest metabolite removal were I and III. These infiltration solutions involved no significant differences between the measured total contents. However, since the higher TSC values from apoplastic stem fluid-derived extracts were achieved with infiltration solution I, it was selected to proceed with the subsequent metabolite extraction and LC-based analysis. This solution I was formerly used to obtain apoplastic fluid for protein analysis [17] Consequently, this fact was considered positive since both analyses can be carried out based on the same apoplastic fluids. In other words, this leads to an important experimental advantage during this type of study since the obtained sample amount is usually minimal and/or limited.
Selection of separation conditions for chromatographic analysis of apoplastic carnation extract
We studied reverse-phase HPLC-based elution conditions to obtain a suitable chromatographic separation of the root apoplast-derived extract from 'Gran slam' carnation cultivar. Thus, Figure 3 shows the results of the three-elution profiles presented on Table 1. The chromatogram of the first trial displays a very poor separation (Figure 3a). Most compounds eluted in the first 5 minutes using these conditions due to this chromatographic method appeared to involve a high elution power. Indeed, two reference signals, A and B, eluted jointly at 4 minutes. Based on this outcome, the elution profile of the second trial was modified, including 0% phase B as an initial isocratic step during the first 5 minutes. This variation offered a clear separation of reference signals A and B (ca. 13 min) and a better resolution for the other signals since reducing the elution power allowed for improved separation of them (Figure 3b). However, three chromatogram regions still had low resolution at 2-4, 12-14, and 28-36 minutes. A third trial was then proposed based on these considerations, retaining the above mentioned 5-min initial step (i.e., 0% phase B) and including three modifications based on isocratic elutions at 14-19 min (i.e., 10% phase B), 30-32 min (i.e., 30% phase B), and 50-53 min (i.e., 90% phase B). They involved subsequent middle-sloped gradient steps for improving the signal resolution. The resulting chromatogram of the third trial showed that this elution method allows a better compound separation and even A and B signals (Figure 3c). Hence, this elution appropriately separated the compounds between 2-36 min, and the rest of the chromatogram showed no phenolic-like relevant peaks. However, the elution after 40 min was maintained to eliminate from the reversed-phase column those apolar residues that could contaminate it. Additionally, these trials were compared by way of different separation quality parameters, such as resolution, the number of theoretical plates, and selectivity, calculated for signal A [47], to properly select the best elution profile.
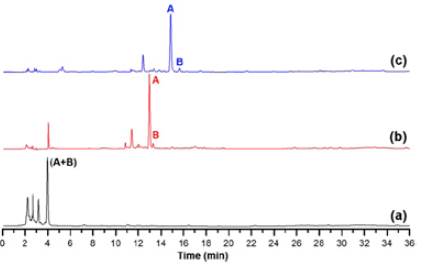
Figure 3 Chromatographic separation trials for the metabolite analysis of polar extracts from the apoplastic fluid of carnation roots (susceptible cultivar 'Gran Slam'). (a) First trial, (b) Second trial, (c) Third trial. Chromatographic conditions according to the information presented on Table 1. Signals A and B were selected for the intuitive visualisation of the separation quality among trials.
Table 2 presents the calculated parameters for signal A. The elution profile used in the third trial allowed to obtain the best resolution (> 2.0), the highest number of theoretical plates (> 4*104), and enhanced selectivity (1.06). These parameters indicated that the chromatographic conditions of the third trial are suitable for a metabolite separation of polar extracts from the carnation root apoplast and, therefore, we chose it for further analysis. The selected elution profile undoubtedly guaranteed the results of the following part of the study since we carried out identical tests, using this third elution profile with a polar extract from the apoplastic stem fluid of the resistant and susceptible cultivars. Consequently, the selected chromatographic conditions were also conducive to good metabolite separation of such mixtures (data not shown).
Table 2. Chromatographic parameters calculated for signals A and Ba.
| Parametersb | First trialc | Second trialc | Third trialc |
|---|---|---|---|
| Resolution (A, B) | 0 | 1.1 | 2.4 |
| Number of theoretical plates for signal A | Undetermined | 2.8x10⁴ | 4.7x10⁴ |
| Selectivity for signal A | Undetermined | 1.03 | 1.06 |
a Signals separated in chromatograms presented in Figure 3; b Parameters calculated [47] for selecting the best elution method to analyse polar extracts from carnation apoplastic fluids; c Trials involved chromatographic conditions according to the information presented on Table 1.
Metabolic profiling of the apoplastic fluid of two cultivars with contrasting levels of resistance to Fod-caused vascular wilt
As part of the application of the conditioned procedure for the analysis of phenolic metabolites in the carnation apoplast, extraction of the apoplastic fluid of roots and stems of the carnation cultivars 'Solex' (Fod susceptible) and 'Golem' (Fod resistant) was carried out. Infiltration solution I was used to obtain the respective apoplastic fluids, as performed previously for the 'Gran slam' cultivar. Then, the individual LC-ESI-MS-based metabolic profiles of the mentioned extracts were recorded to compare the relevant variations based on those metabolites with more contrasting differences. The LC-MS data preprocessing led to the recognition of eight main constituents (1-8) among the four types of extracts (see Figure 4), highly consistent between the biological replicates, whose characterisation details by high-resolution mass spectrometry and the respective feature annotation at confidence level 3 [33] (see Materials and Methods section) are presented on Table 3. These metabolites were related to one flavone (1) and seve0 flavonols (2-8), whose core moieties comprised (iso) pratol, kaempferide, (dihydro)kaempferol, quercetin, and myricetin-type flavonoids. Additionally, these compounds involved (di)acyl, glycosyl, and (di)acylglycosyl substitutions. Signals A and B, previously employed for the selection of the best elution profile from apoplast-derived from 'Gran slam' cultivar, corresponds to compounds 2 and 3.
In general, the stacked, aligned chromatograms in Figure 4 show that root-derived extracts have more abundant metabolites than extracts from stems. These organ-based differences were observed between both carnation cultivars, which exhibited phenotypic differences such as resistance to Fod-caused disease [42]. In this sense, compounds 1 (hydroxy-methoxyflavone, an (iso)pratol-like flavone), 6 (di-O-acetylkaempferol, a diesterified flavonol), and 8 (kaempferide disalicyloylrhamnoside, a diacylglycosylated flavonol) were found to be exclusively occurred in the root apoplast of the resistant cultivar 'Golem'. However, the mere presence of a component in the resistant cultivar does not guarantee its role in resistance since it may be related to other phenotypic characteristics that differentiate both cultivars [48]. However, this differential evaluation has traditionally been used as a first approximation to study naturally-occurring compounds with potential resistance roles [4], [19], [49]-[51].
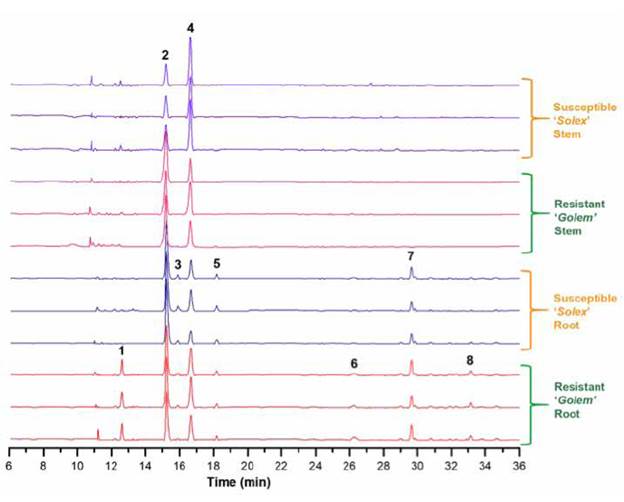
Figure 4 Stacked chromatographic profiles of apoplastic fluid-derived extracts from carnation roots and stems. Each plant organ (i.e., stems and roots) from every cultivar ('Golem' as Fod-resistant and 'Solex' as Fod-susceptible) comprised three biological replicates from 3-to-4-week rooted carnation cuttings. Bold numbers indicate the main constitutive compounds of carnation cultivars.
On the other hand, the two plant parts under study exhibited other constitutive differences. This observation is related to those metabolites only occurring in the apoplastic root fluid, such as compounds 3 (kaempferide salicyloylglucoside, an acylglycosylated flavonol), 5 (O-acetylmyricetin, an esterified flavonol), and 7 (di-O-benzoylquercetin, a diphenylacyl flavonol). This differential comparison indicated that the mentioned compounds possibly participate in specific mechanisms of this plant organ, for instance, possible siderophore-type or rhizosphere-signaling compounds, which may play an essential role in processes that typically occur at this level [43]. In addition, the two most abundant metabolites were also detected in both plant organs of both carnation cultivars. However, they exhibited differential content among plant organs, comprising glycosylated flavonol 4 and acylflavonol 2 as the most abundant in stems and roots, respectively, which indicate a plausible functional specialisation triggering their particular accumulation in a certain plant organ to facilitate its action.
The principal component analysis (PCA) led to expanding the global comparison of the whole set of metabolic profiles to recognise those patterns based on differences or similarities of this constitutive composition of carnation cultivars. The PCA-based dataset modeling exhibited good performance since this explained 83.6% of the total explained variance (VE) using the two-first principal components (PC1 and PC2). Thus, the resulting PC1*PC2 scores plot (Figure 5A) shows that PC1 discriminated (61.5% of VE) mainly those chemical data from each test organ. For its part, PC2 (22.1% of VE) separated the resistant cultivar (' Golem') stem extract from the other three metabolic profiles. This pattern indicated that the apoplast-derived extract from each organ of both cultivars had relevant chemical differences, as previously mentioned. Still, stem apoplast revealed higher differences between cultivars than root apoplast. This fact was evidenced through hierarchical clustering analysis (HCA). The respective dendrogram (Figure 5C) divided the metabolic datasets into two main organ-dependent groups and, subsequently, four treatment-dependent subgroups, clustering the three biological replicates under analysis with a comparable hierarchical level. Nevertheless, HCA reached the central separation of the organ-dependent groups with different cluster distances. In this regard, stem clustering exhibited ca. 2-fold branch height to the root clustering, indicating that root apoplast-derived extracts from both cultivars have a more similar chemical composition to those obtained from stems. These findings indicated that the selected extraction and separation conditions permitted suitable discrimination of intrinsic phenolic-related metabolic characteristics of the carnation apoplast obtained from each organ and cultivar.
Table 3 Most abundant phenolic-like metabolites detected and annotated in apoplastic fluid-derived extracts from carnation roots and stems.
| #a | Rtb (min) | [M-H]- (m/z) | [M+Na]+ (m/z) | Annotationc | Molecular Formulad | Error (ppm)e |
|---|---|---|---|---|---|---|
| 1 | 12.6 | 267.0668 | 291.0649 | hydroxy-methoxyflavone | C16H12O4 | 3.86 |
| 2 | 15.3 | 419.0747 | 443.0768 | O-salicyloylkaempferide | C23H16O8 | -4.75 |
| 3 | 15.8 | 581.1276 | 605.1259 | kaempferide salicyloylglucoside | C29H26O13 | -3.27 |
| 4 | 16.7 | 449.1075 | 473.1069 | dihydrokaempferol glucoside | C21H20O11 | -1.78 |
| 5 | 18.1 | 359.0415 | 383.0389 | O-acetylmyricetin | C17H12O9 | 3.34 |
| 6 | 26.3 | 369.0621 | 393.0595 | di-O-acetylkaempferol | C19H14O8 | 2.98 |
| 7 | 29.65 | 509.0891 | 533.0861 | di-O-benzoylquercetin | C29H18O9 | 3.73 |
| 8 | 33.2 | 685.1569 | 709.1548 | kaempferide disalicyloylrhamnoside | C36H30O14 | 1.75 |
aCompound numbering according to Figure 4. bRetention time (Rt) recorded in chromatograms presented in Figure 4. cCompound annotation at level 3 according to the suggested communication confidence [33] by accurate mass measurements and the information of some key MS fragments. dMolecular formula of the annotated compounds [M], deduced from the adducts [M-H]- and [M+Na]+. 'Relative error calculated between the monoisotopic mass and the accurate mass measured for the quasi-molecular ion [M-H]- of those detected, annotated compounds.
Further exploration of the individual variations and the relative content distribution of the most abundant metabolites (1-8) established the specific chemical differences between the test extracts to determine the intrinsic flavonoid-based characteristics of each organ and cultivar. Thus, the peak areas of metabolites 1-8 were normalised by sum and autoscaled (unit variance) for comparative purposes by means of a heat map-based intuitive visualisation. As shown in Figure 5C, the heat map revealed that the most abundant metabolites among the four extracts were 2, 3, and 5 for 'Solex' roots, while the contents of metabolites 1, 6, 7, and 8 were higher for 'Golem' roots. The hierarchical analysis on these autoscaled contents separated these two metabolite sets, generating two main clusters, accompanied by a third cluster corresponding to compound 4, which was very abundant for the 'Solex' stems. A detailed inspection found no structural relationship between the flavonoid moieties in these clusters derived from the hierarchical analysis. However, substitutions in the 'Solex' root flavonols were found to be monoacylated, while the 'Golem' root flavonols were predominantly diacylated. Hence, further studies are required to determine whether flavonol acylation might be related to carnation resistance. Indeed, previous studies described that Fod-resistant carnation cultivars can accumulate flavonoids generally glycosylated [29], [42], [52] or acylglycosylated [53], [54]. Certainly, flavonoids can have structural variations (e.g., methylation by methyltransferases, glycosylation by glycosyltransferases or acylation by specific acyltransferases), which modify flavonoid stability, solubility, and reactivity. These structural variations guide their various functions in the plant, possibly as antimicrobials or antioxidants [55], [56], and even modulate internal or external cell transport to fulfil their particular role [57], [58]. On the other hand, the 'Golem' roots showed the abundant presence of flavone l, suggesting another metabolic trait of this resistant cultivar. This trait is possibly due to the enhanced flavone synthase (FNS) activity, diverting the metabolic route toward producing this type of lavonoids, which has also been recognised as phytoalexins [59]. Contrarily, the susceptible cultivar was the glycosylated dihydrolavonol 4, which seems to be an intermediate that did not reach the lavonol end-product, possibly due to a reduced flavonol synthase (FLS) activity. Transcriptional studies have shown that the FLS exhibited lower levels in Fod-susceptible carnation cultivars than in those resistant cultivars [53].
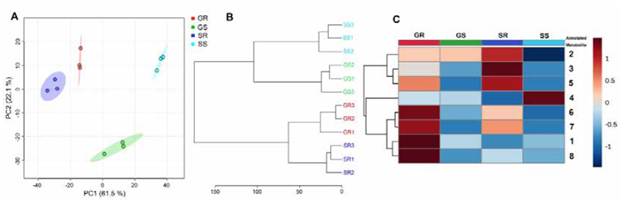
Figure 5 Comparative analysis of the metabolic profiles of the apoplastic fluid-derived extracts from roots and stems of two carnation cultivars. A. PClxPC2 scores plot from PCA. B. Dendrogram from HCA using Ward algorithm. C. Heat map-based intuitive visualisation of the relative content distribution of the most abundant metabolites 1-8, whose numbering and annotation agreed with Table 3. Each colored cell on the heat map corresponds to each compound's relative abundance (normalised, autoscaled peak area) (dark blue = low; dark red = high). GR: resistant cultivar 'Golem'root (red), GS: resistant cultivar 'Golem' stem (green), SR: susceptible cultivar 'Solex'root (dark blue), SS: susceptible cultivar 'Solex' stem (light blue). PCA = principal component analysis; HCA = hierarchical clustering analysis.
Partial least squares-discriminant analysis (PLS-DA) favored extending the previous comparisons. Thus, the resulting VIP (variable importance in projection) scores plot (Figure 6) showed that the main metabolites significantly influenced the discrimination of the four extracts (VIP > l). In this regard, compounds 2 and 4 were those metabolites that varied the most and, therefore, contributed more to the discrimination of the root and stem apoplast, respectively, of the 'Solex' cultivar (VIP> 1.7). More abundant compounds in the 'Golem' root apoplast resumed the subsequent VIP trend (l.2> VIP> l.7), while the lavonols majorly present in the ' Solex' root apoplast varied the least among the four extracts (1.0> VIP> 1.1). The relative variations displayed as box plots conirmed the PLS-DA-based previous outcome (Figure 6), specifying the amplitude of these autoscaled variations for each metabolite and rationalising the recognised patterns according to the statistical comparison of metabolic proiles. For instance, these box plots indicated that the metabolites mainly present in the root of the resistant cultivar 'Golem', i.e., 1, 6, 7, and 8, had 2-3-fold abundance with respect to other extracts, constituting relevant information that can serve as the basis for further studies focused on comprehending the role of diacylated flavonols in carnation resistance to Fod.
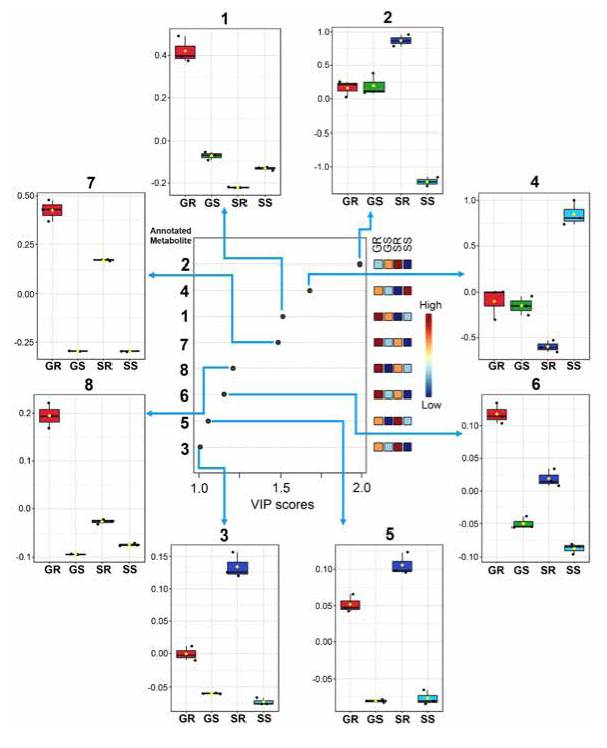
Figure 6 Relative variations and discriminating importance of the main phenolic metabolites detected in the apoplastic fluid-derived extracts from stems and roots of two carnation cultivars ('Golem' as resistant and 'Solex' as susceptible cultivars). The discriminating influence agrees with the color scale (dark blue = low influence; dark red = high influence) of the right-side heat map for each treatment. GR: resistant cultivar 'Golem' root, GS: resistant cultivar 'Golem' stem, SR: susceptible cultivar 'Solex' root, SS: susceptible cultivar 'Solex' stem. VIP = Variable importance in projection.
Conclusions
Buffer solution I (i.e., NaH2PO4-Na2HPO4 0.1 M pH 6.5 / NaCl 50 mM) reached the best removal of the apoplastic luid from carnation stems or roots. Such an iniltration solution performed well in removing higher contents of sugars and phenolic-like metabolites while involving the slightest contamination with intracellular compounds. The best HPLC separation of polar metabolites of those extracts obtained from the optimised, removed apoplastic fluids involved three isocratic-gradient elution steps. Such an analysis permitted the detection and the subsequent HRMS-based annotation of eight phenolic compounds, i.e., one flavone and seven lavonols, as main constituents of apoplastic luids from roots and stems of two carnation cultivars. These lavonoids may be related to the passive defense mechanisms of the plant, particularly those diacylated flavonoids, such as 1, 6, 7, and 8, which abundantly occurred in the resistant cultivar, and require further studies to disclose their plausible roles in the Fod-resistance of carnation. In conclusion, our findings indicated that the selected extraction and separation conditions led to adequate pattern recognition based on the differential phenolic-related metabolic characteristics of the apoplast-derived extracts from stems and roots of two carnation cultivars with contrasting resistance to Fod. In addition, further studies can apply this worklow to other plant species in order to study the performance and dynamics of apoplastic metabolites and their influence and plausible roles in various biological processes that may include interactions with pathogens.

