


 Inglês (pdf)
 Artigo em XML
 Referências do artigo
 Enviar este artigo por email
 Citado por SciELO
  Citado por Google
  Similares em
SciELO
Similares em
SciELO  Similares em Google
 Permalink
Introduction
One of the main problems of cattle production is the scarcity of information applications available online and mobile, which can serve as tools to support decision-making. Having information on natural resources for specific territories and times would help to observe differences in the productive variables among agroecological regions (Mochi, 2014). Geographic information systems (GIS) enable generation of maps, making it possible to group, represent and obtain spatial georeferenced information of any geographic coordinate (Bocco, 2004). By developing simulation models, it is possible to manipulate data and maps that can be easily used to develop specific functions for a given region of a production system, and thus provide better results for decision-making (Díaz-Ambrona, Gregorio, Martínez, & Calvete, 2011). Cloud computing services (Amazon Web Services, Azure, App Engine, etc.) and Web services can help to achieve communication and data exchange. In addition, the adoption of the Hypertext Transfer Protocol (HTTP) can help to access results of predictions online and mobile for use in decision-making by producers, investors, and government. The aim of this research was propose a methodology to develop a tool in the form of a web service to support decision-making in a cattle production system addressed to avoid problems during period of forage scarcity.
Material and methods
Study area
This study was conducted in the municipality of H. Cardenas, Tabasco- Mexico, located in the humid tropics among 17°55' and 18°25' N and 93°16' and 94°08' W. Altitude varies from 0 to 28 m. a. s. l. The municipality covers an area of 2049.24 km² (INEGI, 2010).
Cartography
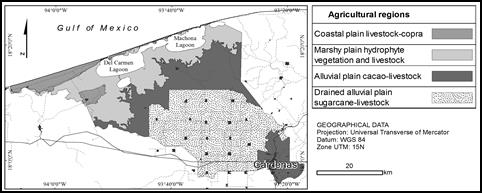
The map that served as the basis of the work generated by identifying and selecting the farming areas of the municipality of Cárdenas, Tabasco (Osorio, 2008). Parting from this work, we modified four areas, considering type of relief, crop associations and dominant grasses and vegetation. Integration of the areas was done by geo-referencing a map developed in a previous study (Osorio, 2008), with the software QGIS Version 2.6.1. The borders of the farming areas defined by photo interpretation of orthophotomaps at scale 1:15000 (INEGI, 2010). The final map performed a scale of 1:250000.
Development of the model
The model of this study describes weight gain production potential (WPP) and animal units (AU) per hectare (ha) AUD.ha-1 of grazing cattle in the agricultural regions identified in this study in the municipality of H. Cárdenas-Tabasco, Mexico. The model comprises two sub-models: biomass production potential (BPP) and weight gain production potential. For the first sub-model, the methodology adopted to calculate potential crop yield (Rivera-Hernández et al., 2012). The second sub-model describes WPP and the AU, adding equations that calculate these variables from BPP. The description of BPP, WPP and AU defined by factors and variables obtained from the literature: weight gain variable for the factor animal (Meléndez, 2012); the variable grass type (Castellaro, Klee, & Chavarría, 2007), leaf area index (Guenni, Gil, & Guedez, 2005) and dry matter (Mármos, 2006). For the factor pasture, radiation and temperature variables (Díaz-Ambrona et al., 2011) for the factor climate, as well as the usual climatological variables for the period 1981 - 2010.
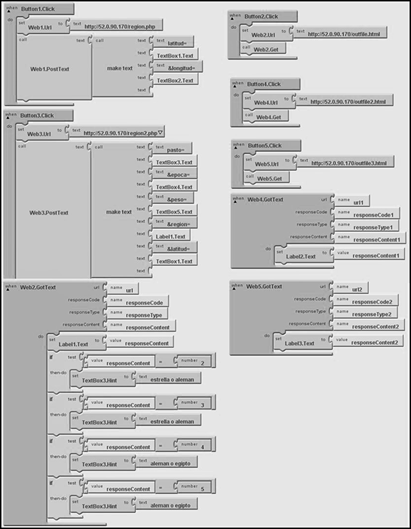
Implementation of the Web service
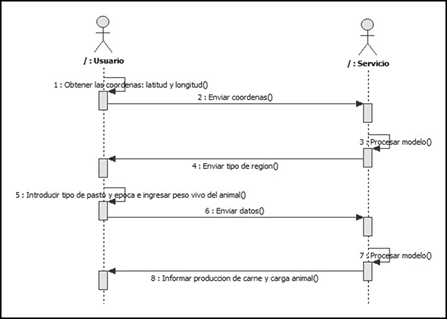
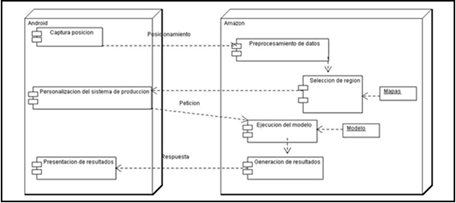
Use and sequence case diagrams developed with StarUML softwareTM and three actors: government, producers and investors. The entry scenarios are the following: introduce latitude, longitude, animal live weight, season of the year and type of grass. Outputs are AU and WPP. The software architecture diagram constructed with ArgoUML software shows the interaction among client, Amazon Web Services (AWS) server and Android device. The architecture diagram is represented as follows:
Capture position: geographical coordinates (latitude and longitude).
Data pre-processing: R software Raster library.
Selection of region: agricultural region map.
Personalization of the production system: grass, season and live weight.
Model execution: grass yield potential equations.
Results: run model in R.
Presentation of results: given information on beef production and stocking rate. Although it is recognized, other characteristics of beef cattle production (sex, age, physiological state, etc.) are important for the system, were not included in this work since it is a preliminary study, which explores the development of a methodology for decision-making. To install the Web service, an m3.medium EC2 was constructed and configured with the 64 bites Linux Ubuntu platform, version 14.04 software(r) . In addition, the platform performed an installation with the SP 1.0-17, Rgdal 0.9-1, and Raster 2.3-12 libraries. Finally, Apache and PHP 5.4.36 were installed. The post method was performed to manipulate the variables and the communication among server and the Android application.
Development of the application in Android
The Google App Inventor platform of Google Labs, was performed to create the application for mobile devices with MIT (Massachusetts Institute of Technology) Android operating systems.
Evaluation of the system results
To evaluate the results of the system, studies were conducted in situ by scientists of the Colegio Superior de Agricutura Tropical (CSAT) in the regions identified in our study. CSAT is the only institution of the state that has done complete studies in the municipality of H. Cárdenas, Tabasco-Mexico, on production of grasses related to season and beef production, which were necessary for present research. Due to CSAT was closed by government in 1985, the available data at date, did not cover the entire study area. Our research identified the points in the municipality where the study focused to offer the user of this type of service, a broader description of the entire region in the near future.
Results and discussion
Agricultural regions of Cárdenas -Tabasco, Mexico
In the municipality of H. Cárdenas -Tabasco, Mexico, four differentiated and modified agricultural regions based on previous work (Osorio, 2008). These regions were the following: 1) the coastal plain, livestock and copra; 2) the marshy plain, hydrophyte vegetation and livestock; 3) alluvial plain, cacao and livestock; and 4) drained alluvial plain, sugarcane and livestock. The four regions selected served as basis for obtaining the data belonging to the factors and variables, which intervened in the description of cattle, weight gain. Figure 1, shows the four regions. The drained alluvial plain with sugarcane and livestock (40%) and the alluvial plain with cacao and livestock (29%) are outstanding for their extension.
Simulation model design
The model developed in this work is static, mechanistic, and deterministic is based on the FAO zoning model. However, interaction with and parameters related to grasses, season, and beef production in cattle production systems can improve the description of the system by adding temporal, spatial and systematic dimensions.
Web service and Android applications
Figure 2, shows the sequence diagram of the Web service and Figure 3, software architecture of the Web service, both developed in our work. Web service was achieved by interaction of the simulation model, cartography, cloud computation and sensor capture of the smart devices. This complexity, required for developing Web services, is in the same line with Candelaria et al., (2011), who define an increase model complexity over years and more complete system representations attempted by multivariable integration in a systemic approach. This could be to three separate or combined reasons: the interaction of the different disciplines, an increase in knowledge and experience in modeling and advances in information management technology.
Interoperability
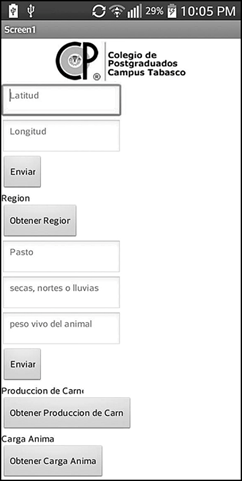
The block diagram for mobile app in the Android platform with the Web service, was constructed with Java software (App Inventor for Android Blocks Editor) and communicated to the Android application (Figure 4) with the HTTP POST protocol, making interoperability among the different elements of the service possible (Figure 5). Some authors (Spilke & Zurnstein, 2005), coincide in potential of Web services to transfer and integrate information for agricultural systems. However, other authors (Nash, Korduan, & Bill, 2009), mention the main problem in achieving its interoperability when combine spatially referenced data (cartography), models and production systems to Web services. Our study achieved interoperability using cartography and the model for the beef production system by optimizing informatics resources through the Web service and adopting HTTP (Hypertext Transfer Protocol) and R libraries carried out with maps, performing the advantage of consume few resources in their operations with some client interaction or server and do not load maps to the server memory.
SOAP vs REST
One difference among SOAP and REST, is security. SOAP is reliable and safe and supports transactions, the reason it consumes many resources in the processes of coding and decoding. In contrast, REST, by means of the HTTP protocol, enables use of methods such as GET and POST with low resource consumption. However, the developed methodologies can increase system security, as in the case of their use in ASW, which originally started with SOAP support for interactions with API, but recently has reduced its SOAP support in favor of REST. The best recommendation for any use of API of AWS is to focus on the use of REST. For this reason, the exchange of data in this application was through REST, which permitted developing a tool with good interoperability with Web services now and in the future.
Map servers
Map servers are an option for working with spatial data in Web, whether with free services such as Google maps or with open code applications such as Map Server. These, however, have disadvantages, such as limited consults, high resource consumption, limited scalability and little flexibility (De La Cruz, Herrera, Evelia, Chico, & Cota, 2010). For this reason, AWS services were adopted: have advantage over horizontal and vertical scalability of informatics resources as needed. They also allow integration of different programming languages with R software using different libraries, such as in our case the use of the Raster library since, with this software, when the data load is too heavy for RAM, it can be stored in a temporary file.
Interoperability in agricultural systems
Developers of mobile applications for the Cloud face the challenge of multiple mobile operating systems and devices with heterogeneous characteristics. Web services are considered the most adequate support for interoperability in mobile computing. However, its potential is not fully exploited as in the case of the agricultural sector where interoperability can be achieved among dynamic models and cartography with spatial characteristics.
Evaluation of the system results
The results showed differences in the productive variables among the agricultural regions, seasons of the year and grass type (Table 1). However, when validating the data obtained by the model against data generated in situ by CSAT, similarity was observed in the productive variables stocking rate and weight gain. Although, it is feasible to modify the developed model to describe beef cattle production in the municipality in a better way, there is a need to conduct more research on the agricultural regions of the municipality of H. Cárdenas -Tabasco, Mexico, due to CSAT was closed in 1985. In addition, in situ research on grass biomass production and its relation with cattle production has stopped. This information is essential for better understanding of the beef cattle system.
Table 1 Potential cattle production by agricultural region and season for 250 kg live weight animals
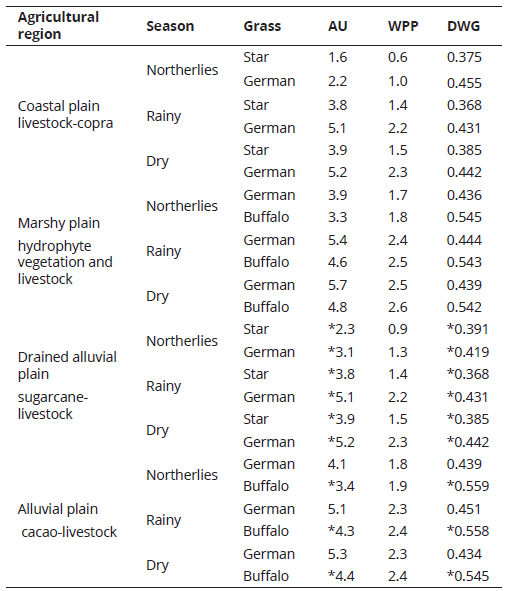
AU = Potential stocking rate per hectare
WPP = Potential production gains in beef per hectare per day.
DWG = Potential production gain in beef per animal per hectare per day.
* Values compared against those cited in the literature.
Drained alluvial plain region: sugarcane-livestock
The results of our study showed values of 3.9, 3.8 and 2.3 AU.ha-1 for the dry, rainy and northerlies (nortes) seasons, respectively. Regarding weight gain in dry, rainy and northerlis seasons, averages of 0.385, 0.368 and 0.391 kg.day-1, respectively, were obtained. The lowest stocking rate was during the season of northerlies with 2.2 AU. ha-1 and weight gain of 0.390 kg.day-1 This could be due to the climatic conditions, which were more favorable for grass development. In the same agricultural region, using German grass (Echinochloa polystachya), the results of the validation model for the dry, rainy and northerlies seasons were 5.2, 5.1 and 3.3 AU. ha-1, with weight gains of 0.442, 0.431 and 0.419 kg.day-1, respectively. The low temperatures and short photoperiods may have affected grass growth. During the season of northerlies, the lowest yields found with a stocking rate of 3.3 AU.ha-1 and a weight gain of 0.456 kg.day-1.
Alluvial plain, cacao and livestock
The results achieved in this research during simulation model validation when buffalo grass (Brachiaria mutica) were 4.4 AU.ha-1 with weight gain of 0.545 kg.d-1 in the dry season, 4.3 AU.ha-1 with weight gain of 0.558 kg.d-1 in the rainy season, and 3.4 AU.ha-1 with weight gain of 0.559 kg.d-1 during the season of northerlies. Stocking rate is lower probably due to the low temperatures and have a greatest harmful effect on forage production. Results similar to ours were found by Pérez, Meléndez, & González, (1980), with buffalo grass (Brachiaria mutica), for which the highest stocking rate for beef production in the dry season was 4.2 AU.ha-1 with weight gain of 0.550 kg.d-1, but in the rainy season was 4.0 AU.ha-1 with weight gain of 0.521 kg.d-1. In this case, the data had an approximation of 94%.
Average production values in the municipality of Cárdenas- Tabasco, Mexico
The average rate stocking for the municipality of H. Cárdenas -Tabasco, Mexico was 1.8 AU. ha-1 (INEGI, 1991). However, this rate may vary depending on the live weight of the animal, grass type and climate of each agricultural regions. The simulation model used is based on the potential parameters of the municipality of H. Cárdenas - Tabasco, Mexico while the information of INEGI is based on surveys of producers and focused on the number of animals they have on their land or ranches, and with this information the stocking rate is calculated. According to the simulation model validation, the highest yields obtained during the dry and rainy seasons, confirmed the occurrence with previous work. In this sense, Guenni et al., (2005), mention several factors, which limit grass growth: fertilization to increase cover, trampling because of the soil compaction and grass leaf area index, which can vary with the season, species and production system. They consider a combination of these several factors, is the reason for higher production in dry season. In dry season, residual moisture left by the northerlies enables greatest grass growth (Meléndez, González, & Pérez, 1980).
Examples of how the system can support decision-making
Application users (producer, government and investors) should have in mind the objectives of each actor to be able to make the most adequate decision. The following examples may be useful. A) The producer can decide whether, depending on the season, he can maintain the same stocking rate production values year around, and if not, in which season he would have to supplement. B) The investor who needs to construct a refrigerated slaughterhouse can, with this tool, be informed of beef production and stocking rate and determine in which agricultural region to establish the building. C) The government can use this interface to determine which regions produce more beef and divulge the information through federal or state government programs to producers or offer recommendations to investors on the most productive agricultural regions that can better guarantee higher profits.
Conclusion
For the case of the municipality of H. Cárdenas, Tabasco - Mexico, cartography enabled us to differentiate agricultural regions with similar climate, edaphic conditions and type of crop, which facilitates quantitative description of the beef cattle production systems. The simulation model based on agricultural region, allows estimate potential grass yield. The developed system requires evaluation under different conditions and can achieve interoperability among the different elements of the system, using mapping data, information metadata, and simulation models adopting data transfer protocols. In this way, the results of the predictions are accessible and have allowed a decision-making tool

