Introduction
Soybean (Glycine max L. Merril) is an oleaginous legume of short and long cycle which grows in tropical, subtropical and temperate regions of the world and it is considered as the main oleaginous for animal and human feeding uses due to its high percentage of proteins (35% to 50%) and quality oils (15% to 25%) (FAO, 2014). In Colombia, is considered as a protein source and raw material for the creation of balanced concentrates, particularly for the poultry-swine chain, with alternative uses such as silage in the meat-dairy chain and food rich in essential amino-acids with important benefits for human health and nutrition. In the producing regions, is considered as the crop per excellence of the rotation systems such as rice, corn and sorghum. Therefore, is fundamental part of the Colombian food security (Bastidas & Agudelo, 1994).
One additional importance of the soybean is the condition as mandatory rotation crops within the diverse regional production systems: corn-soybean (Valle del Cauca, Colombia), rice-soybean (Llanos orientales region) or sorghum-soy (Tolima and Valle del Cauca, departments) (Romero et al., 2006; Caicedo & Baquero, 2012).
The planted area in the Meta department expands throughout two regions: high plains and foothills. Statistics for the year 2012, exhibit a planted area of 38000 hectares with high plains participation of 59% and 27%, for the foothills (Fenalce, 2014). The natural region of the Colombian Orinoquia represents a 23% of the Colombian total area, equal to 26 million of hectares with high interest for the sustained agricultural development, especially in the foothills and high plains (Valencia & García, 2012). The potential area for soybean production in the high plains is over 560000 hectares. Some advances have been noticed in the sowing area which went from 57 hectares in the year 2000 to 12.434 hectares in 2009 and 23.480 in 2014 (Fenalce, 2014).
The soybean breeding for the Colombian Orinoquia acid soils, started with ICA (Instituto Colombiano Agropecuario) in 1984, which pretended to obtain aluminum-tolerant genotypes in the oxisol soils conditions. As a result of this research, the first variety for oxisols in Colombia was obtained in 1994 (Soyica Altillanura 2), tolerant to 70% of aluminum saturation. In addition, other varieties with a high genetic potential developed by Corpoica have allowed to obtain this trait: Orinoquía 3 (immature), Corpoica Libertad 4 (aluminum-tolerant) and Corpoica Taluma 5 (forage or grain). Recently, the Superior 6 Corpoica variety, was obtained as an immature varietal alternative, adapted for the meadow soils of the foothills and oxisols with 50% of base saturation (Valencia et al., 2006).
Currently, Corpoica has the mission in Colombia to provide new soybean varieties to the producers in the Orinoquia throughout a continuous research process in plant genetic resources. For this reason, this research was carried out with the aim to identify elite genotypes with specific adaptation and high performance which can lead to a plant with pathogen resistance, a fast cycle soybean and a variety with an appropriate grain quality for balanced food industry.
Material and methods
Structure of the agronomical assessment test (AAT)
Seven soybean experimental genotypes (elite lines within F6 generation), were evaluated in six locations of the Colombian high plains throughout an adjusted AAT to the 000970 ICA resolution (March 10th, 2010) with application to the Colombian Orinoquia sub-region.
Genetic materials
The AAT consisted of seven promising genotypes of the Corpoica plant genetic resources program, selected throughout previous studies under the high plains and foothill conditions and experimentally identified as follows: L-2078, L-1432, L-251, L-189, L-154, L-103, L-062 and Corpoica Superior 6 and Soyica P-34 commercial varieties were performed as control.
AAT Locations
The research was carried out in six locations of two high plain towns (Puerto López and Puerto Gaitán) during the first agricultural semester, and in two foothill towns (Granada and Villavicencio) during the second agricultural semester. The locations were identified as follows: Location 1 (TA): Puerto López (Corpoica Taluma, semester A); Location 2 (CA): Puerto Gaitán (Corpoica Carimagua, semester A); Location 3 (PO): Puerto López (Finca El Porvenir, semester A); Location 4 (PA): Granada (Finca Paraíso, semester B); Location 5 (TO): Villavicencio (Finca Topacio, semester B); Location 6 (DE): Granada (Finca Delicias, semester B).
Experimental design
A randomized complete block design (RCBD) with nine treatments (7 genotypes and 2 control) and four replicates, was performed. The experimental unit was stablished with plots of six rows (5m long) and a distance among rows of 0.40 meters for a plant density of 375000 plants. ha-1.
Soil characteristics
In each locality of the AAT, soil samples were taken at a depth of 0 to 20 cm with the aim to analyze the physical and chemical characteristics throughout an edaphological physical and chemical analysis in terms of soil fertility level.
Agronomical management
The establishment was carried out in a manual way and on each location, the fertilization was based on the results from the soil analysis and soybean nutritional requirements for the high plains and foothills. Simple compounds were applied in K.ha-1 as follows: N: 150; P2O5: 120; K2O: 90; Ca: 70; Mg: 25 and Boro-zinc: 20. Weed control was addressed to gramineae and wide leave plants, from the sowing time with pre-emergent applications of s-metolachlor and metribuzin, and post-emergent with fomesafen and lethodim. Pest control was also conducted against these principal pests: Anticarsia gemmatalis (hubner), Bemisia tabaci (Gennadius) and Maruca testulalis (Geyer) with applications of Imidacloprid and Carbaryl.
Agronomical assessments
The agronomical variable descriptions are listed as follows: 1) height plant to physiological maturity (HPM): determined in the physiological maturity stage; 2) knots to physiological maturity (KPM): taken at the moment of physiological maturity 3) starting of bud filling (BL): height of the first pod expressed in cm; 4) days of physiological maturity (DPM): the period of time between the emergence and 95% of the pods are dried, expressed in days; 5) pods per plant (PP): number of total pods per plant, with an average of 5 pods per plants; 6) 100 grains weight (100GW): weight in grams of 100 grains per plot taken at the harvest moment; 7) grain yield (GY): weight of grain per plot and is referred to t.ha-1 with a 13% of humidity; 8) dehiscence: this was determined two weeks after the grain physiological maturity using the 1-5 scale in which 1=absence of dehiscence; 2=1-10%; 3=11-25%; 4=26-50%; and 5=more than 50% of the plants with dehiscence.
Disease resistance evaluation
70 days after sowing under field conditions of natural inoculum was established in order to obtain pressure of the following plant pathogens: Cercospora sp., Bacterial pustule, Downy mildew and virus aspect (without defining the causal agent). A scale of 1-5 was used in which 1= free of symptoms and 2-3-4-5 correspond to the 5%, 20%, 45% and 50% of the affected foliar area, respectively.
Morpho-agronomical description
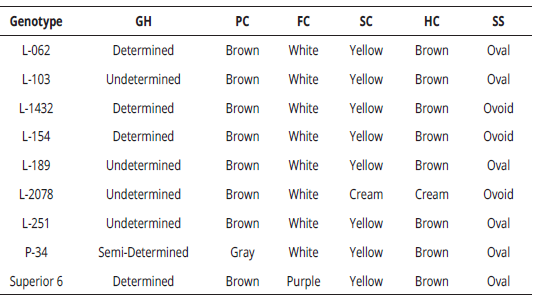
The varietal description of the evaluated genotypes was carried out with six morphological descriptors of the qualitative type, as follows: 1) growth habit; 2) pubescence color; 3) flower color; 4) seed color; 5) hilum color; and 6) seed shape, using the guide for the soybean descriptors from Bioversity International (Bioversity International, 2007).
Statistical analysis
The procedures and statistical analysis were carried out with the SAS, version 9.3(r), software licensed to Corpoica. In order to determine the differences among medians, the Tukey (P=0.05) test was performed. With the grain yield variable (GY), the variance analysis were established by individual and combined locations. For the variance analysis, the locations and replicates were considered as randomized effects and genotypes, as fixed effects.
The mathematical model performed was as follows: Yijk = μ+ Gi + Aj + (GA) ij + Bk (j) + Eijk; where: Yijk = average performance of the i-th genotype obtained in the j-th environment and k-th repetition; μ = effect of the general median; Gi = effect of the i-th genotype; Aj = effect of the j-th environment; (GA)ij = effect of the interaction among the i-th genotype and the j-th environment; Bk(j) = effect of the k-th repetition in the j-th environment and Eijk = randomized effect of the experimental error associated to the i-th genotype in the j-th environment and k-th repetition, accordingly to the additive linear model.
Analysis of phenotypic stability
The interaction genotype x locality was studied for the grain yield variable (GY) using the model (AMMI) (Additive Main Effects and Multiplicative Interaction) described by Gabriel (1971), and Crossa et al. (2002).
Plant material selection
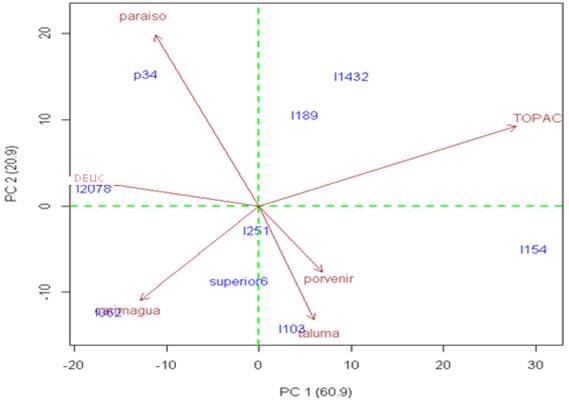
On the first stage, with the information on grain yield and the biplot analysis (stability and/or specific adaptation), (Figure 1), the genotype with the highest performance and general and/or specific adaptation was identified, which was associated to complementary attributes on a second analysis stage and have allowed the final selection of candidate genotype for a new variety. The main complementary traits were as follows: earliness to physiological maturity, height plant and number of knots, starting of bud filling, number of pods per plant, dehiscence and plant resistance to limiting diseases.
Table 1 Soil analysis of two groups of environments: highplains (A), foothills (P), six localities (L) for the evaluation of seven soybean Corpoica 2011 genotypes

Tex: Texture; TA: Corpoica Taluma 2011 A; CA: Corpoica Carimagua 2011 A; PO: Finca El Porvenir 2011 A; PA: Finca El Paraíso 2011 B; TO: Finca el Topacio 2011 B; DE: Finca las Delicias 2011 B. FA: sandy-loam texture; FAr: clay-loam texture; FL: limey-loam texture.
Results and discussion
Characterization of the environments evaluated
The soils used for the evaluation of soybean genotypes performed two differentiated groups: a) three locations (TA, CA and PO) with oxisol soils associated to "high plains" and b) three locations (DE, PA and TO) with swamp soils from the Ariari river, corresponding to the "foothills" (Table 1). Both location groups, performed differences which contrast in relation to soil drainage, base saturation, fertility level, and crop cycle from the soil formation. The contrast level among location groups and within locations have allowed to determine throughout main components, the magnitude of the genotype x location (GxL) interaction and discrimination and/or behavior of the soybean genotypes in each location.
Phenotypic stability analysis for grain yield
The combined variance analysis per location for the grain yield accordingly to the AMMI pattern (Table 2), showed the simple location-soybean genotypes effects and their interaction were highly significantly. The presence of the G x L interaction indicates that the soybean genotypes showed differential behavior throughout the evaluated locations. In addition, this interaction due to the main components, was detected during the two first main components CP1 and CP2 with an accumulated explanation of the variation per interaction of 81.8%. The other additional components CP3, CP4 and CP5, were not significantly important and their values corresponds to 7.5%; 7.4% and 3.3% respectively, are considered low in terms of the interaction model (Table 2).
Table 2 AMMI analysis for grain yield (k.ha-1) of seven promising soybean Corpoica 2011 genotypes evaluated in six locations
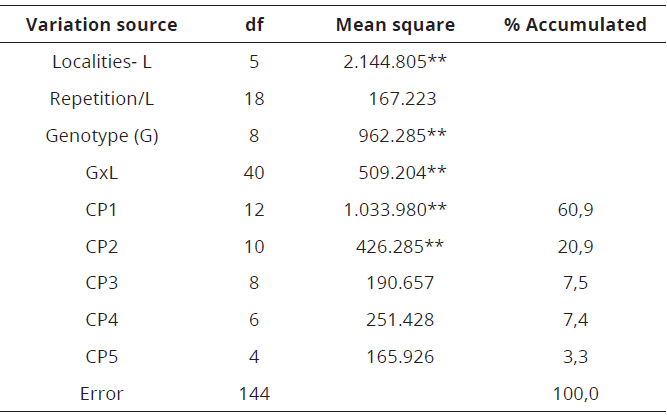
df= degrees of freedom; **, * Significantly differences at 0.05 and 0.01%, respectively
The average yield per genotype fluctuated from 1.991 to 2.660 k.ha-1 for the soybean genotypes L-154 and L-189, respectively. The lowest yields were obtained with the L-54 genotype, 1.991 k.ha-1 and the control Corpoica Superior 6 with 2.118 k.ha-1 (Table 3).
Table 3 Average performance of seven promising soybean genotypes and their increase or decrease in relation to two commercial control groups
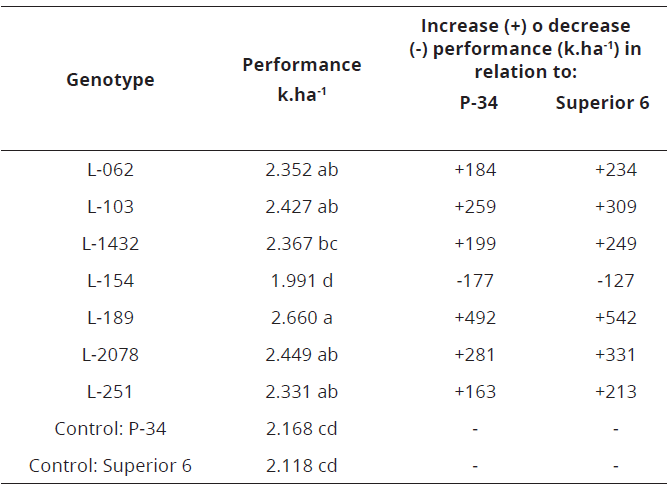
Medians with the same letter on a vertical way are statistically equals, accordingly to P < 0.05 (Tukey).
The average yield per location fluctuated from 2.062 k.ha-1 to 2.667 k.ha-1 for the localities DE (Finca las Delicias 2011 B) and PA (Finca el Paraíso 2011 B) respectively (Table 4). The length vector per location is a measure of response and stratification ability due to their behavior on a determined environment (Gabriel, 1971; Crossa et al., 2002) (Figure 1). Two locations performed the highest vector length, indicating the biggest stratification of the TO and PA genotypes. The first location, Finca el Topacio, with an interval yield grain which oscillated from 1854 k.ha-1 (L-062) to 3.182 k.ha-1 (L-154); and the second location, Finca el Paraíso, with an interval yield grain from 1.842 k.ha-1 (L-154) to 3.166 k.ha-1 (L-189). The PO location, Finca el Porvenir, performed the lowest genotypes stratification with an interval yield grain which fluctuated from 1.462 k.ha-1 to 2.485 k.ha-1. The PA and DE locations, performed the highest and lowest yield grain with averages of 2.667 k.ha-1 and 2.062 k.ha-1, respectively (Table 4).
Table 4 Average performance (k.ha-1) of seven promising soybean genotypes evaluated in six localities
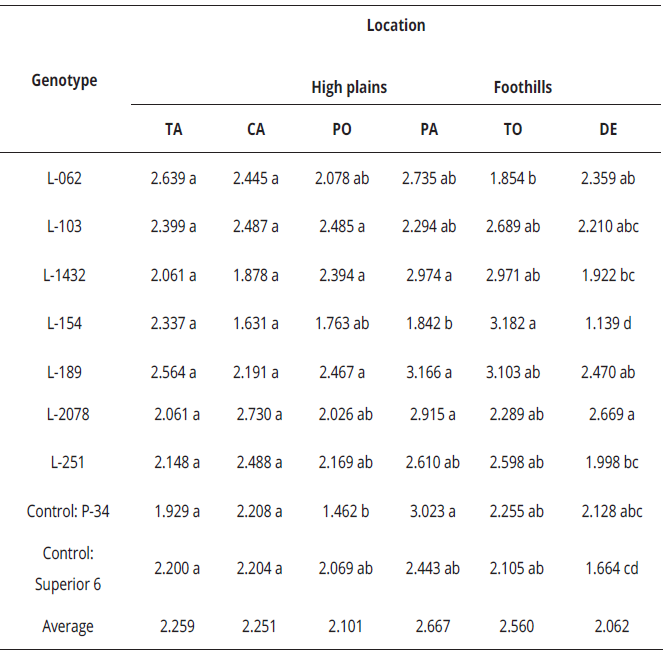
Location TA: Corpoica Taluma 2011 A; CA: Corpoica Carimagua 2011 A; PO: Finca El Porvenir 2011 A; PA: Finca El Paraíso 2011 B; TO: Finca el Topacio 2011 B; DE: Finca las Delicias 2011 B. Medians with the same letter on a vertical way are statistically equals, accordingly to P < 0.05 (Tukey).
Figure 1, shows the two first main contrasted components: CP1 and CP2, where six sectors can be identified and delimited by the six vector angles associated to locations and denominated as follows: Paraíso, Topacio, Delicias, Carimagua, Taluma and Porvenir, respectively. With the exception of the -L251 genotype, which shows, due to its proximity to the zero point of the Biplot graph, the highest stability degree from all genotypes. The other evaluated genotypes, performed specific adaptation associated to one location in particular. The L-251 genotype, despite to perform the best stability, their yield grain were not satisfactory (2.331 t.ha-1) since it was not able to statistically overcome the commercial control groups P-34 (2.168 t.ha-1) and Superior 6 (2.118 t.ha-1). In addition, performed a 5% of damage caused by Cercospora sp. in the Porvenir location (degree 2) and in Topacio of a 30% (degree 3) (Table 7). Especifically, a critical level of degree 3 for the dehiscence pod (Table 8). Due to this, the genotype L-152 was not selected to be recommended as a variety for the two groups of environments High plains and Foothills.
In the group of genotypes with specific adaptation, three genotypes demonstrated the best record: L-062, L-103 and L-189. The two first genotypes, performed a specific adaptation associated to two locations from the high plains; L-062 to the CA location and L-103, to TA. Unlike those two genotypes, L-189 performed specific adaptation associated to the vector limited by the two locations which showed the best yield average (TO=2.560 k.ha-1 and PA=2.667 k.ha-1), both associated to the foothills region. The L-189 genotype, also stands out for the highest yield grain, which is statistically different from the commercial control groups and it even came to surpass them -492 k for P-34 and 542 k for Superior 6- (Table 3), these values are considered important from a genetic gain basis.
The commercial control groups due to their location in the vectors of the Bipot graph, showed specific adaptation. The P-34 genotype located on the vector delimited by the PA and DE locations which is defined by specific adaptation to the foothills region, whereas Superior 6 Corpoica genotype, located on the vector delimited by the TA and CA locations, is defined by specific adaptation to the high plains region.
Complementary variables analysis
The seven evaluated soybean genotypes showed a highly significant interaction for the DPM and PP variables which is significantly for the HPM, BL and W100G variables and non-significant for KPM (Table 5).
Table 5 Combined variance analysis for height plant to maturity (HPM), knots to physiological maturity (KPM), starting of bud filling (BF), days to physiological maturity (DPM), pods per plants (PP) and 100 seeds weight (100SW) of seven promising soybean genotypes
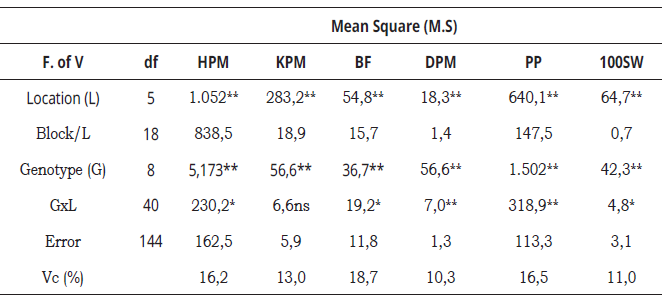
df=degrees of freedom; *, ** = levels of significance to 0.05 y 0.01, respectively; ns = non-significant; Vc = Variance coefficient.
Nonetheless, all the evaluated genotypes performed average values with respect to six evaluated variables accordingly to the needs of a good variety. L-189 stands out for performing the highest number of pods per plant (56) and the lowest seed size from all the experimental genotypes with 15.2 g (100 seeds weight) (Table 6).
Table 6 Comparison of height plant to maturity (HPM) medians, knots to physiological maturity (KPM), starting of bud filling (BF), days to physiological maturity (DPM), pods per plants (PP) and 100 seeds weight (100SW) of seven promising soybean genotypes
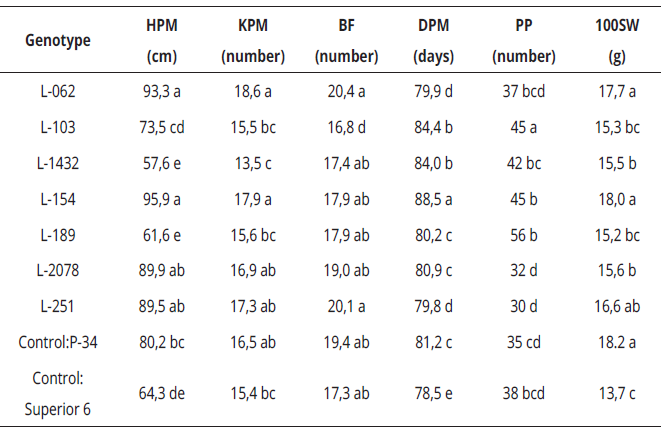
Medians with the same letter on a vertical way are statistically equals accordingly to P < 0.05 (Tukey).
It is important to note that from the four phytosanitary problems which were evaluated on six evaluated locations, any damage caused by Cercospora sp., was observed only in DE, PO, CA and TO locations. The L-189 genotype did not show any damage caused by this plant pathogen (Table 7). Likewise, the evaluated genotypes by dehiscence, showed a degree of 1 (absence of dehiscence) in all locations where it was subject to evaluation (Table 8).
Table 7 Field grading (scale 1-5) to pathogens prevalent in the High plains and Foothills of seven promising soybean genotypes.
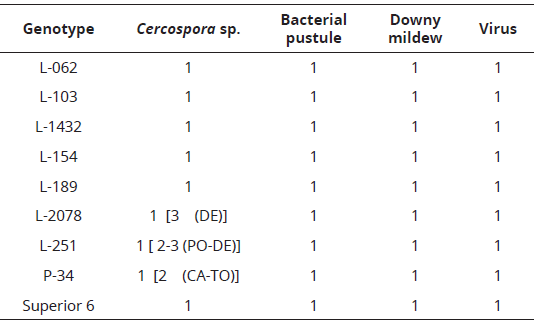
Locality. CA: Corpoica Carimagua 2011 A; PO: Finca El Porvenir 2011 A; TO: Finca el Topacio 2011 B; DE: Finca las Delicias 2011 B
Table 8 Dehiscence interval values (1-5 scale) of seven promising soybean genotypes evaluated in the high plains and foothills
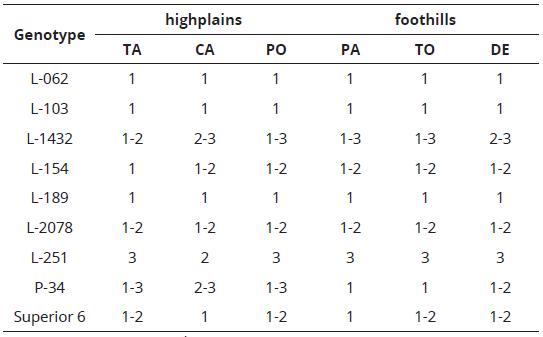
Location. TA: Corpoica Taluma 2011 A; LA: Corpoica Carimagua 2011 A; PO: Finca El Porvenir 2011 A; PA: Finca El Paraíso 2011 B; TO: Finca el Topacio 2011 B; DE: Finca las Delicias 2011 B
Varietal description of the L-189 genotype
With the aim of ensuring the varietal purity with distinction, homogeneity and stability for the seed production, the varietal description with qualitative descriptors of the L-189 genotype is performed as a candidate to commercial variety: soybean plants of undetermined habit with a height and number of knots to the physiological maturity of 61.6 cm and 15.6, respectively; 17.9 of bud filling, 45.0 pods per plant, 80.2 days to physiological maturity and 15.2 g, the weight of 100 seeds. The pod is indehiscent with brown pubescence, white inflorescences, yellow seed color, brown hilum color and the seed shape is oval (Tables 6 and 9).
Conclusion
The length analysis of the vectors in the Biplot graph allowed to recognize two locations which provide the best soybean genotype performance and this can lead to discriminate the evaluated genotypes. These two locations were as follows: Topacio and Paraíso and they are associated to the foothill region. In contrast, the Porvenir location, associated to the high plains region, performed the lowest power of genotypes discrimination and the lowest performance in all type of environments. The L-189 genotype performed the highest yield grain, surpassing in more than half a ton to the commercial control groups P-34 and Superior 6.


