


 Inglês (pdf)
 Artigo em XML
 Referências do artigo
 Enviar este artigo por email
 Citado por SciELO
  Citado por Google
  Similares em
SciELO
Similares em
SciELO  Similares em Google
 Permalink
Introduction
Apple (Malus domestica Borkh.) production in Brazil is concentrated in the south. The state of Rio Grande do Sul, is responsible for 52.4% of the national production and Santa Catarina (SC) has become the second largest producing state with 43.3% of the production (ACATE, 2014). In SC-Brazil, apple production is concentrated in the regions of the Planalto Serrano and the Midwest (IBGE, 2011), due to favorable weather for cultivar performance.
Studies on different management systems used in apple orchards, such as nitrogen source and weed management, have already been carried out in apple orchards located in the Planalto Serrano region in SC, Brazil, where the use of different management systems was correlated with yield and fruit quality (Martins et al., 2008; Oliveira et al., 2014). But these studies evaluated soil chemical properties, despite knowing that the agricultural use of the soil invariably affects its chemical composition, its physical structure, and may also affect its conservation and reduce crop yield (Silva et al., 2006).
Therefore, the management system used in apple orchards may lead to disturbances in soil structure, resulting in soil physical problems, such as soil compaction, which will result in lower infiltration and availability of air and water to plants, and may also lead to soil erosion (Bronick & Lal, 2005). Thus, soil structure is of fundamental importance for the soil-plant relationship as a soil with appropriate aggregation will present better distribution of pores, and consequently better water infiltration.
The region of the soil profile with the highest concentration of plant roots is where plant-soil interactions take place. Thus, it is where soil physical attributes are critical for proper plant growth. Therefore, the structure of the soil, density, macro and micro porosity, the presence and stability of aggregates, and penetration resistance (Luciano et al., 2014; Richart et al., 2005; Schoenholtz et al., 2000) are attributes that should be measured to assess how the management system interferes or influences soil characteristics and its relationship with the plant (Luciano et al., 2014).
In weed management systems, where weeds are completely eliminated through frequent mowing or herbicide use, degradation of soil physical quality such as increased bulk density and decreased macroporosity and total volume of pores has been reported (Alcântara & Ferreira, 2000; Carmo et al., 2011), and there is a distinction as to the SOM content being greater in a mowing system compared to the use of herbicides (Espanhol et al., 2007).
This study aimed to evaluate the physical attributes of Cambisol in apple (Malus domestica Borkh. cv. Gala) orchards under different weed management systems in Santa Catarina, Brazil. The attributes evaluated in this research were as follows: hydraulic conductivity; bulk density; soil penetration resistance; total porosity, macropores, micropores; soil aggregation indices such as arithmetic and geometric mean diameter of air-dried and water-stable aggregates; aggregate stability index and volumetric water content.
Materials and methods
The experiment was conducted in a commercial orchard implemented in 2008, located in the city of Urubici in the Planalto Serrano region of SC, Brazil. The orchard consisted of Gala apple variety. Central leader planting system was adopted in the orchard with plants grafted on Marubakaido rootstock in spacing of 4.5 m between rows and 1.5 m between plants. The soil of the orchards was classified as Cambisol (Embrapa, 2013) and the climate is humid temperate climate with mild summer according to Köppen classification. Before the start of the experiment, the following attributes of the 0-20 cm layer were recorded: SOM=46 g kg-1; pH in water=5.8; Al+3=0.0 cmolc dm-3; Ca+2=8.5 cmolc dm-3; Mg+2=3.2 cmolc dm-3; P=32 mg dm-3; K+=243 mg dm-3; and sandy clay loam texture with 462 g kg-1 of sand; 299 g kg-1 of silt and 239 g kg-1 of clay.
Weed management started in September 2011 with three treatments as follows: T1 - no weed management (control), T2 - chemical desiccation of weeds on the crop row (desiccation), and T3 - mowing of weeds on the crop row (mowing). The desiccation and mowing of the weeds was carried out every 30 days. For the desiccation we used non-residual herbicide, whose active ingredient is potassium glyphosate, with dilution of 50mL.20L-1 and application of 500L.ha-1. The mowing was done with a portable brush cutter. Through prior weed assessment, which were predominated in the orchard, were as follows: Trifolium repens, Trifolium grass cultivation, Paspalum notatum and Chaptalia nutans.
The experimental design was randomized complete blocks consisting of four replications, each consisting of five plants, resulting in an area of 7.0 m2. The average apple yield in the 2011/2013 harvests was 23.4; 25.8 and 27.8 Mg ha-1, for the control, desiccation and mowing treatments, respectively (Oliveira et al., 2014).
Soil samples were subjected to a number of analyses. Firstly, the samples were saturated by capillarity, by being placed in a container where water was added until reaching half of the height of the metal ring and left for 24 hours so that the entire sample was saturated. Afterwards, we measured the weight of the saturated samples.
To obtain the water retention curve in the soil, saturated samples were placed on a tension table where pressures of 0.6 and 6 kPa were applied, then moving on to Richards extractor, where pressures 60 and 600 kPa were applied. After the application of each pressure, we measured the sample weight and continue to the next pressure. With the data obtained from the application of each pressure, we also determined the distribution of pore sizes. The macropores with diameter equal to or greater than 50 µm retain water of the saturated soil up to a pressure of 6 kPa. The mesopores with a diameter between 50 and 5 µm retain water between pressures of 6 to 600 kPa, and the micropores with a diameter of less than 5 µm retain water that even a pressure of 600 kPa could not remove (Dane & Topp, 2002; Veiga, 2011).
After this sequence of analyses, the samples that had their structure preserved so far passed onto the second stage, where they were deformed. Firstly, penetration resistance was performed using a bench penetrometer (Marconi Brand Model MA933 ™). Then, we determined bulk density (BD) by removing 20 g of the sample and drying it at 105° C for 24 hours to evaporate water completely. At a later time, we determined the soil aggregate stability through size distribution of air-dried aggregates to obtain the aggregate size distribution. The sample was removed from the metal ring and passed through an 8 mm mesh and the aggregates were then air-dried until moisture was stabilized. Subsequently, the soil was sieved in a number of meshes with the following diameter classes: <0.5, 0.5-1.0, 1.0-2.0, 2.0-4.0, and 4.0-8.0 mm. In addition, soil aggregates which were retained in each mesh were then weighed, thus composing the data of aggregate size.
We determined the size distribution of water-stable aggregates with the aggregates retained in each mesh. We placed the aggregates on the mesh of the sieves with the same diameters as the previous determination. Then, they were placed into the apparatus where sieving was conducted, adding water until it reached the bottom of the upper mesh and leaving it in this condition for 10 minutes. Next, the device was activated for 10 minutes, promoting mild agitation. Finally, we removed the meshes, each containing a class of aggregates that were dried at 105° C to be quantified. With the masses of the aggregates retained in the Ø classes: <0.5, 0.5-1.0, 1.0-2.0 and 2.0-4.0 mm and the mean Ø of the respective class, we determined weighted arithmetic and geometric mean Ø of air-dried (AMDad and GMDad, respectively) and water-stable aggregates (AMDws and GMDws, respectively), as well as the aggregate stability index (ASIAMD = AMDws/AMDad and ASIGMD = GMDws/GMDad). The AMD is an estimate of the relative amount of soil in each class of aggregates. It increases as the percentage of larger aggregates retained in sieves with larger meshes increases.
The results were analyzed for normality and homogeneity of data through Lilliefors & Bartllet tests, respectively. Then, the data were submitted to analysis of variance with application of F test for two factors, where treatments and depths were the two factors and, in detecting statistical differences, we applied a mean separation test (Tukey test at 5%). In addition, we also performed analyses of Pearson correlation and a multivariate statistical analysis (principal component analysis - PCA) with all data. The PCA was performed using the XL Stat program. All attributes were standardized, taking the average as equal to 0 (zero) and variance equal to 1.0 and were selected by Pearson correlation (p>0.50).
Results and discussion
In general, data variability was greater for the treatment factor, which showed significance only for BD, AMDws, ASIAMD, GMDws and ASIGMD. For the interaction between treatment and depth, only BD, AMDws, and ASIAMD GMDws were significant. The depth factor showed a greater number of attributes with significance by F test (Table 1).
Table 1 Analysis of variance for the physical attributes indicating significance to the related factors.
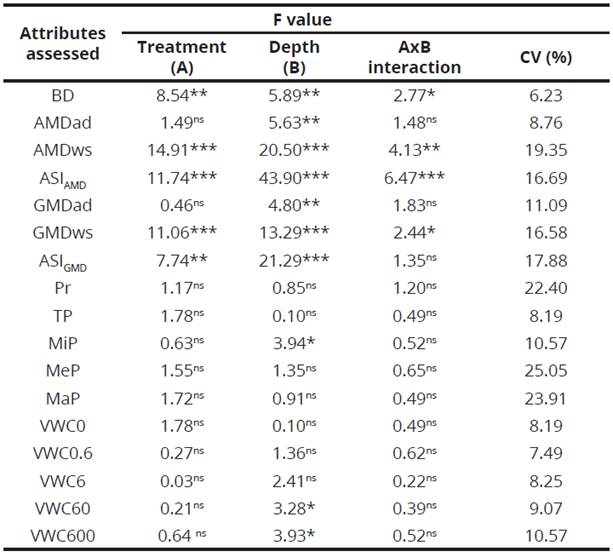
p<0.05 (*) 0.01 (**) and 0.001 (***). BD = bulk density, AMDad and AMDws=arithmetic mean diameter of air-dried and water-stable aggregates, respectively; GMDad and GMDws=geometric mean diameter of air-dried and water-stable aggregates, respectively; ASI=aggregate stability index; Pr=penetration resistance; TP=total porosity; MiP=micropores; MeP=mesopores; MaP=macropores; VWC0/0.6/6/60/600=Volumetric water content at 0; 0.6; 6; 60 and 600kPa, respectively.
We observed that the treatments did not significantly influence Pr, TP, MiP, MeP and MaP (Table 1). The mean values for Pr, TP, MiP, MeP and MaP were, respectively, 2.80, 0.50, 0.27, 0.07 and 0.17. However, when depth was evaluated for the same attributes only MiP showed significant differences, which increased in depth (0.25 to 0.29). With medium to low coefficients of variation (CV%) (Table 1), we can infer that the lack of statistical differences is due to the fact that the means were fairly homogeneous. This indicates the absence of plowing and harrowing in soil in the evaluated areas, together with the high SOM content (4.6%), favors similar values of TP, MaP, Mip and MeP among treatments.
In addition, weed management for a period of two years did not influence the attributes assessed in this study. However, the maintenance of weed on the soil decreases the erosive processes and increases the rent of water in the soil (Alcântara & Ferreira, 2000). Ugarte-Nano et al. (2016), evaluated the effects of integrated weed management (IWM) based cropping systems on the water retention of a silty clay loam soil after 12 years of differentiation of systems with IWM.
Alcântara & Ferreira (2000), showed that there is more TP for treatments with vegetation cover, followed by desiccation and mowing. Similar results were observed by Carmo et al. (2011), in comparing treatments with and without mowing of cover crops. These differences between treatments were not evident in this study, because TP was not influenced by weed management, which corroborates the study of Centurion et al. (2004), in comparing mowing to the control treatment, and Espanhol et al. (2007), in comparing mowing to desiccation.
The means for soil microporosity, corroborate the findings of Espanhol et al. (2007), in which there were no differences among mowing and desiccation, but there was an increase in depth. Although Carmo et al. (2011), and Centurion et al. (2004), did not find any differences between mowing and vegetation cover (control), these authors also did not observe differences of microporosity in depth, which diverges from the findings of this study.
Soil macroporosity did not differ among treatments, corroborating with Centurion et al. (2004), and Espanhol et al. (2007). However, these authors found differences in depth, where they both indicate a decrease in macroporosity, which again diverges from this study in which no differences were found. Carmo et al. (2011), also found no differences in depth, but observed increased macroporosity in soils where vegetation cover was maintained.
BD presented interaction among factors (Table 1) and was influenced mainly by depth, where we observed an increase in depth for the mowing and desiccation treatments. The control treatment was the only treatment that did not suffer this influence (Figure 1). For the 15-20 cm layer, the control treatment had the lowest BD.
Figure 1 Unfolding of the means of the interaction between treatment and depth for bulk density. Means followed by the same capital letter do not differ within the same depth and same lowercase letter do not differ within the same treatment (Tukey test, p<0.05).
In general, the obtained data for BD corroborate with several other authors, who reported that covered soils have lower BD than soils using some type of weed suppression management (Alcântara & Ferreira, 2000; Carmo et al., 2011; Centurion et al., 2004). Increased density in depth is also described by Carmo et al. (2011), who attribute this characteristic to the fact that higher SOM contents are found in the surface layers of soil, subsequently decreasing in depth. The highest means of BD in depth may be correlated to the increase in microporosity also observed along the profile (Table 2).
The arithmetic mean diameter of the air-dried aggregates (AMDad) only showed significance for depth (Table 1), where we observed lower values in the surface layer and higher values in the two layers (5-15 cm). Also, the layer between 15-20 cm, presented intermediate values. The mean values for AMDad were 2.69, 2.78 and 2.64, respectively, to mowing, desiccation and control. To depth, the mean values were 2.49, 2.78, 2.87 and 2.68, respectively, to 0-5, 5-10, 10-15 and 15-20 cm.
For the arithmetic mean diameter of the water-stable aggregates (AMDws) we observed interaction between the factors treatment and depth (Table 1). In the surface layers (0-5 cm), between mowing or desiccation AMDws values were not different to control treatment, however between 5-15 cm desiccation decreased AMDws values in comparison to control treatment (Figure 2).
Figure 2 Unfolding of the means of the interaction between treatment and depth for arithmetic mean diameter of water-stable aggregates (AMDws). Means followed by the same capital letter do not differ within the same depth and same lowercase letter do not differ within the same treatment (Tukey test, p<0.05).
We observed differences in depth only for the mowing and control treatments with lower AMDws values in layers 10-20 cm for mowing and 15-20 cm for control. The desiccation treatment presented the lowest means in the first three layers and did not differ as a function of depth (Figure 2).
We also found significant interaction between the factors for the aggregate stability index of the arithmetic mean diameter (ASIAMD) (Table 1, Figure 3). There was a decrease in depth of the ASIAMD for all treatments (Figure 3).
Figure 3 Unfolding of the means of the interaction between treatment and depth for aggregate stability index of the arithmetic mean diameter (ASIAMD). Means followed by the same capital letter do not differ within the same depth and same lowercase letter do not differ within the same treatment (Tukey test, p<0.05).
The desiccation treatment had the lowest ASIAMD in the 0-5 cm layer, and in the subsequent layer, only the control obtained a higher index than others. For the other layers, the treatments did not differ. The analysis of the geometric mean diameter of air-dried aggregates (GMDad) was only significant for depth (Table 1). The mean values for GMDad were 1.60, 1.65 and 1.63, respectively, to mowing, desiccation and control. To depth, the mean values were 1.47, 1.70, 1.74 and 1.61, respectively, to 0-5, 5-10, 10-15 and 15-20 cm.
The geometric mean diameter of water-stable aggregates (GMDws) showed interaction between the factors that were assessed (Table 1), with decreasing values in depth for mowing and control treatments (Figure 4), which was also described by Espanhol et al. (2007).
Figure 4 Unfolding of the means of the interaction between treatment and depth for geometric mean diameter of water-stable aggregates (GMDws). Means followed by the same capital letter do not differ within the same depth and same lowercase letter do not differ within the same treatment (Tukey test, p<0.05).
In the first two depths sampled, the lowest GMDws was observed in the desiccation treatment, corroborating with the data presented by Alcântara and Ferreira (2000), who, however, observed the highest means for the control area, not for mowing.
For the aggregate stability index of geometric mean diameter (ASIGMD), which presented significance for each factor alone (Table 1), we observed influence of the treatments, with mowing presenting the highest index and desiccation the lowest. Furthermore, we observed the decrease of the index in depth, with lower values for the 10-15 and 15-20 cm layers (Figure 5).
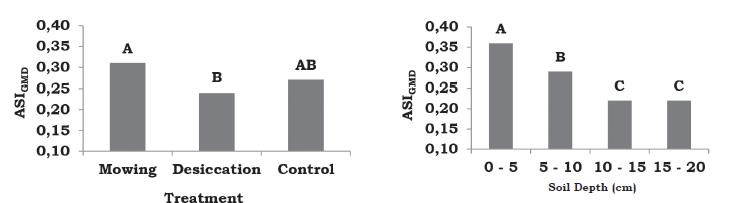
Figure 5 Mean values of aggregate stability index of the geometric mean diameter (ASIGMD) for treatment and depth. Means followed by the same letter were not significantly different (Tukey test, p<0.05).
There was a pattern to the values of mean diameter of water-stable aggregates and aggregate stability indices, obtained arithmetically or geometrically, of lower values for the desiccation treatment, especially in comparison to the mowing treatment. Dalla Rosa et al. (2013), and Brandão & Silva (2012), found the influence of the roots of cover crops in the formation and stability of aggregates, uniting smaller aggregates to form larger aggregates.
Alcântara & Ferreira (2000), attribute to mowing a greater need for weed management practices due to the loss of apical dominance of plants and consequent stimulus to the growth of buds. Data of larger mean diameter of aggregates in mowing obtained in this study may be related to the activity of the root system that continues to release exudates that increase soil aggregation (Dalla Rosa et al., 2013). Moreover, the growth of roots confers small compressions to the soil and, associated to organic compounds released by the roots, contribute to the formation and stability of aggregates (Brandão & Silva, 2012; Dalla Rosa et al., 2013).
Volumetric water content was not influenced by treatments, but there were differences at pressures of 60 and 600 kPa (Table 1) for depth. There was an increase of volumetric water content in depth in both pressures, with the lowest values in the 0-5 cm layer, the highest in 15-20 cm the layer, and intermediate values in the 5-15 cm layer. The mean values for volumetric water content (cm-3) pressure 0, 0.6, 6, 60 and 600kPa were, respectively, 0.50, 0.37, 0.34, 0.30 and 0.27 for treatments and depth.
The hydraulic conductivity (HC) was not influenced by the different treatments (p>0.05). The mean values for HC (cm h-1) were 92.64, 68.45 and 72.07, respectively, to mowing, desiccation and control, respectively.
Analyzing the HC correlation values with some variables at the 0-5 cm layer, there was a significant positive correlation between HC and the mean diameter of aggregates (AMDad, AMDws, GMDad and GMDws) and negative correlation with BD (Table 2). Comparing HC with BD, we observed that the lower the BD, the higher the HC, because there is a greater volume of pores. The highest ASIAMD values for the mowing and control treatments compared to desiccation (Figure 3, 0-5 cm) confirm the positive correlation between HC and AMD (Table 2).
Table 2 Pearson correlation (r) between the attributes and hydraulic conductivity
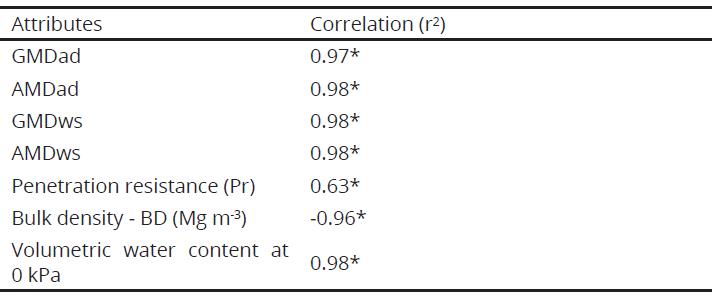
* Significant at 5% probability (p <0.05).
In relation to the principal component analysis (PCA), the attributes were grouped into six main factors, and the model fit was able to explain 62.15% of variance, especially the first and second components (PC1 and PC2, respectively), which explained 37.47% and 24.68% of the variability of soil physical properties in the experimental area. The attributes related to PC1 which had the highest scores, and thus are considered highly significant as they all were ≥ 0.50 (Coelho, 2003), are as follows: bulk density (BD10, BD15, BD20, all with positive scores), aggregate stability index (ASIAMD5, ASIAMD10, ASIAMD15, ASIGMD5, all with negative scores), penetration resistance (Pr5, with a positive score), total porosity (TP10 and TP20, with negative scores), micro and macropores (MiP20, MaP5, MaP10 and MaP20, all with negative scores) (Table 3).
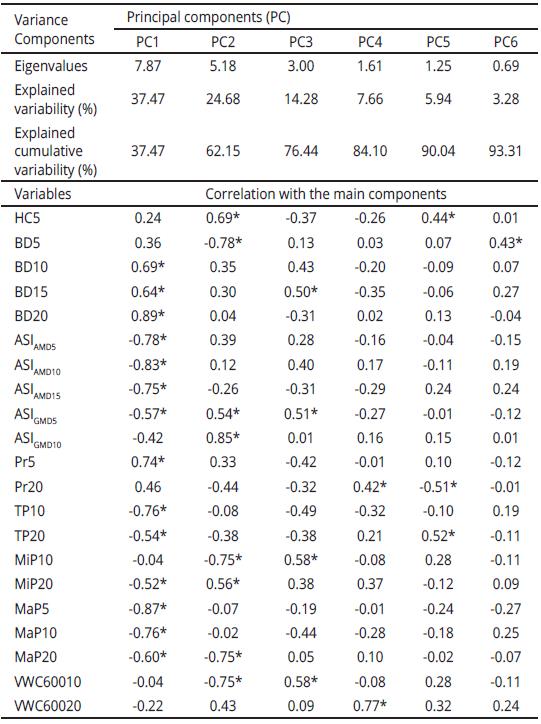
For the second principal component (PC2), the following attributes stood out: HC5, ASIGMD5, ASIGMD10 and MiP20 showed positive and highly significant scores, and BD5, MiP10, MaP20 and VWC60010, all with negative scores and highly significant. For the other principal components (PC3, PC4, PC5 and PC6) we observed that the proportion of explained variance (%) decreased, just as there are lower scores with highly significant values of the variables and higher scores with values considered slightly to moderately significant (Table 3).
Throughout the ordination diagram constructed by PCA, it is possible to verify the formation of three distinct groups, one related to the mowing treatment (number 1), another to the desiccation treatment (number 2) and yet another to the control area (number 3), (Figure 6). For the mowing treatment, attributes related to its separation from the rest were HC5, VWC60020 and ASIGMD10, all associated with PC2 and because the highest scores among these attributes are found with PC2. HC did not differ (p<0.05) among treatments, but the mowing and control treatments were 35% and 6% higher than the desiccation treatment. Although VWC60020 did not differ between treatments, we did observe an increase of 11% in this attribute for the mowing and control treatments compared to desiccation. As for ASIGMD10, there were higher values of this attribute in the mowing treatment compared to desiccation, but no differences between control and mowing (Figure 6).
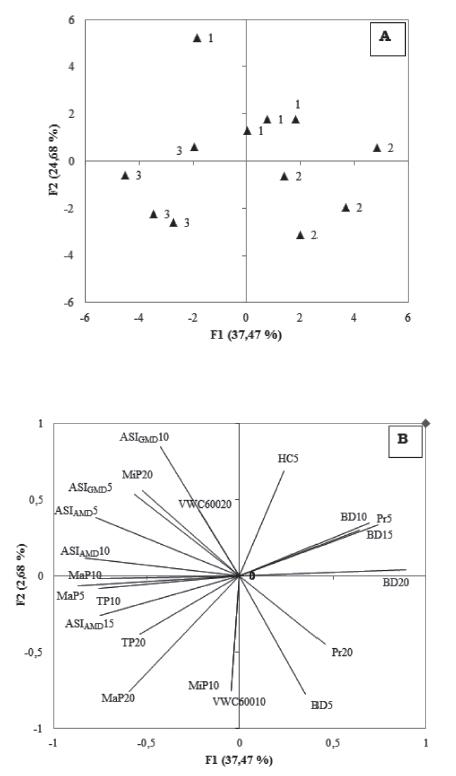
Figure 6 Ordination diagram constructed by PCA of the collected data indicating the arrangement of the treatments (A) and the assessed variables (B). 1=mowing, 2=desiccation, 3=control. HC=hydraulic conductivity, BD=bulk density, ASIAMD=aggregate stability index related to arithmetic mean diameter, ASIGMD=aggregate stability index related to the geometric mean diameter, Pr= penetration resistance, TP=total porosity, MiP=microporos, MaP=macroporos, VWC600=volumetric water content at 600 KPa
The attributes related to the separation of the desiccation treatment were BD5, BD20 and Pr20 (Figure 6). The values of Pr20 were 3.47 for desiccation, 2.32 for mowing and 2.74 for control (data not shown). For BD5 and BD20, the desiccation treatment had proportionally higher values compared to mowing and control (Figure 1). The scores observed for BD20 and Pr20 were higher in PC1 and positive, indicating a direct relationship between higher values of BD and higher Pr in the desiccation treatment, especially in the depth of 10-20 cm, because there are higher BD values in this depth for desiccation compared to control (Figure 1). Pr values were 10% and 15% higher in the desiccation treatment compared to the mowing and control treatments.
For treatment 3, the attributes associated with its separation from the rest were ASIAMD10, ASIAMD15, MaP5, MaP10, MaP20, TP10 and TP20 (Figure 6). The values of TP and MaP are proportionally higher in the control treatment compared to desiccation, just as there are greater ASIAMD10 values in the control area compared to the other treatments (Figure 3).
Conclusion
The management of weeds with mowing or chemical desiccation increased the bulk density at a depth of 15-20 cm. The mowing treatment was responsible for presenting the highest ASIGMD, while chemical desiccation contributed to the lowest ASIGMD. The chemical desiccation treatment decreased AMDws (0-10 cm), ASIAMD (0-5 cm), GMDws (5-10 cm) and reduced hydraulic conductivity (HC) by 26% and 22%, respectively, compared to the mowing and control treatments.
Through PCA it was possible to separate the three treatments. The mowing treatment was correlated with HC, VWC at 600 kPa pressure (15-20 cm) and ASIGMD (5-10 cm); chemical desiccation was correlated with BD (0-5 and 15-20 cm) and PR (15-20 cm); and control was correlated with ASIAMD (5-10 and 10-15 cm), MaP (0- 5, 5-10 and 15-20 cm) and TP (5-10 and 15-20 cm).

