


 Inglês (pdf)
 Artigo em XML
 Referências do artigo
 Enviar este artigo por email
 Citado por SciELO
  Citado por Google
  Similares em
SciELO
Similares em
SciELO  Similares em Google
 Permalink
Introduction
Anthropogenic activities such as livestock management processes are linked to environmental impacts. Unquestionably, the livestock sector throughout its production stages, is an important source of greenhouse gas (GHG) globally emissions, mainly those generated in terms of carbon dioxide (CO2), methane (CH4) and nitrous oxide (N2O). In addition, a direct contribution (breathing, enteric fermentation and manure management, respectively), to climate change, indirectly contributes to the emissions throughout activities for their food production and forest conversion to pasture (Steinfeld et al., 2006). Furthermore, this sector contributes with 14.5% of global emissions (Gerber et al., 2013).
Accordingly to the GHG inventory conducted in Colombia for 2000-2004 years, commitment to the convention framework of the United Nations on climate change (CMNUCC), Colombia contributes to 0.37% of total issued in the world. It is important to note that from this percentage, the agricultural and livestock sector participates with 38%, which translates into 18.5%, the attributed proportion to enteric fermentation (IDEAM, 2009). This estimate was prepared following the guidelines established by the Intergovernmental Panel on Climate Change, methodology to estimate the amount of greenhouse gases produced through the construction of emission factors (EF) for each activity, according to type of tier, which can work (Tier 1, 2 or 3) depending on the specificity of information that can be obtained. For the EF calculation in livestock sector, using tiers 2 and 3 for the access to information on the animal categories, livestock class, feeding offered, type of management, among others (IPCC, 2006a). Estimated the emissions, it is possible to generate the amount of GHG emitted per quantity of product or generated services for activity, this environmental indicator known as carbon footprint, is measured in terms of kilograms of equivalent CO2 per unit of product (Rotz et al., 2010). The transformation of greenhouse gases to CO2eq, is made using equivalencies proposed by the IPCC (2007), where 1 kg CO2 = 1 kg CO2eq; 1 kg CH4 = 25 kg CO2eq and 1 kg N2O = 298 kg CO2eq, respectively.
Colombia has an inventory of 22.6 million of bovine, located in 39.2 million hectares (0.6 animals.ha-1), from which, Valle del Cauca department of Colombia, contributes with 2% (FEDEGAN, 2014). This Colombian department, whose major agricultural product is the sugar cane cultivation in zones with flat slopes, has grazing as the predominant production system for livestock, being star grass (Cynodon nlemfuensis Vanderyst.), the main grassland component below 2000 m. a. s. l. , and kikuyu grass (Pennisetum clandestinum Hochst. ex Chiov.), the most representative pasture at altitudes above 2000 m.a.s.l. The 45% of farms, are classified as double purpose, predominating in these the use of crossed cattle between zebus, creole, Holstein and Swiss brown, mainly. The livestock in the Valle del Cauca region, has a birth rate of 83%, 34.8 months of age at first birth, 437 days of calving interval. In addition, proportion of daily cows in production as follows: dry cows 70:30, 3.9 average of birth cow, average daily production per cow of 5.33 kg and 15% of animal extraction for slaughter (450 kg BW) (Cuenca et al., 2008; FEDEGAN, 2014).
This activity, is characterized by its population dynamics, is established by different animal groups, which pass throughout various physiological states during their lifetime. The understanding and study of this activity can be addressed through methodologies such as system dynamics (SD), which have allowed to study and manage complex systems change over time, in order to understand the structural causes of their behavior (Sterman, 2000). Alternatively, through the use of diagrams of stock and flows, the associated variables with the research problem are divided into three types as follows:
Level: accumulate material or information; Flow: Governs changes in level over time and auxiliary, converting input information into new information (Sterman, 2000). And although they are not predictive models, which have allowed projections based on historical trends to observe what may be the effect of certain decisions made under specific conditions.
Given these concerns, the aim of this research is to establish a dynamic estimation of GHG emissions (CH4, N2O) produced by cattle in Valle del Cauca, Colombia. Additionally, such specific objectives, aims to build the carbon footprint exhibited by livestock and simulate future stages addressed to contribute to the efficiency of livestock production process.
Materials and methods
Study Zone
The work was carried out with information related to bovine livestock activity in Valle del Cauca, Colombia located in southwestern of Colombia, with 22140 km2. The average temperature of Valle del Cauca, department is 23°C and relative humidity varies between 65-75% (IGAC, 2009).
Estimation of emission factor (EF)
The EF estimates were established following the proposed methodology by IPCC (2006a) and its level 2 equations. Pastures, was the main food base in Valle del Cauca, department, we worked with a forage with 61% of neutral detergent fiber (NDF), 9% of crude protein (CP) and 50% digestible energy. The cattle population was divided by age in 8 categories as follows: 1) Female calves 0-12 months, 2) heifers 1-2 years, 3) Pregnant heifers >2 age at first calving, 4) Cows, 5) Males calves 0-12 months, 6) Steers 1-2 years, 7) Steers 2-3 years, 8) Males > 3 years. This categorization is based on the divisions proposed by livestock census conducted biannually during cycles of vaccination against aphtose fever and brucellosis (FEDEGAN, 2014).
According to each category, the dry matter intake (DMI), was estimated using the equation proposed by Mertens (1994), where body weight of the animal (BW) and neutral detergent fiber (NDF) of food were fundamentals for estimation. (Equation 1).
 Equation 1
Where: Dry matter intake (DMI), kg.day-1; Body Weight (BW), kg and NDF as a fraction of food dry matter.
This provides more accurate and reliable estimates of given categories, where there was not homogeneity among animals, three different weights were taken (at the beginning, middle and at the end of stay in touch with each category) with the aim to determine the average consumption of dry matter in each group. Subsequently, with this data, the amount of energy and protein intake was daily estimated in animals.
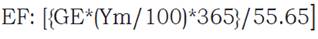
Respectively, for enteric methane estimation, was used the equation proposed by IPCC (2006a), (Equation 2).
 Equation 2
Where: emission factor (EF), kg CH4.animal-1.year-1; Gross Energy Intake (GE), MJ.animal-1.day-1; Ym: methane conversion factor, percentage of gross energy in converted food to methane and 55.65 (MJ.kg-1 of CH4), is the energy content of methane.
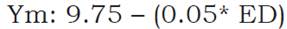
The Ym was calculated using the equation proposed by Gerber et al. (2011), (Equation 3).
 Equation 3
Where:
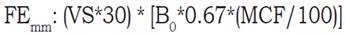
ED= energy digestibility (in percentage of gross energy, GE) of the offered food. To estimate the emitted methane from manure management, was used the equation proposed by the IPCC (2006a). (Equation 4).
 Equation 4
Where:
EFmm = emission factor of CH4, kg.animal-1.year-1
VS=daily volatile solid excreted for livestock, kg of dry matter.animal-1.day-1
30=basis for calculating monthly vs production days
B0= maximum methane producing capacity for livestock manure m3 of excreted CH4
0.67= conversion factor of m3 CH4 to kg of CH4 and MCF is methane conversion factors for each manure management system per climate region, %. VS was calculated using Equation 5.
 Equation 5
Where:
GE= gross energy intake, MJ.day-1
DE= feed digestibility in percentage (%;)
(UE*GE)= urinary energy expressed as GE fraction
(UE = 0.04)= ash content of manure calculated as dry matter fraction
(Ash= 0.08)= dry matter feed intake
18.45= conversion factor for GE dietary per kg of dry matter. MJ. Kg-1 (urine and ash energy values, were obtained according to IPCC (2006a)).
MCF was established by simple regression of MCF values on their respective temperature (IPCC, 2006a), (Equation 6).
 Equation 6
Where:
T= average temperature of the study area (°C).
For nitrous oxide estimation, emitted by manure handling, according to IPCC (2006a) and is expressed in Equation 7.
 Equation 7
Where: N (nitrous) excreted and N intake are expressed in kg N.animal-1 .day-1, the N retained is the fraction of N ingested that retained the animal.
The nitrous intake was obtained by the Equation 8.
 Equation 8
Where:
CP= percentage of crude protein in diet. 6.25 is the conversion factor from kg of dietary protein to kg of N dietary N, kg of feed protein (kg N).
The values for the N retained, were obtained according to IPCC (2006a).
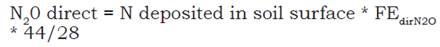
N excreted, is multiplied by the percentage, which is volatilized (20%, IPCC, (2006b)) to obtain N deposited in the soil surface. N20 direct estimation, was performed using the equation proposed by the IPCC (2006a), (Equation 9).
 Equation 9
Where:
N20= expressed in kg.animal-1.day-1
FEdirN2O= (0.02; IPCC, (2006b))
44/28 = conversion factor of N2O-N to N2O.
Once constructed the emission factors for each category, was multiplied by the number of animals correlated to each group. In addition, after obtained the amounts of produced gases, which were converted into CO2eq and divided into milk and meat sector productions. In order to obtain the amount of CO2eq emitted per generated product, the milk production was not the only product generated by the livestock activity, the emissions from milk and meat, were separated by the allocation factor developed in Equation 10.
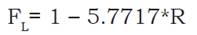 Equation 10
Where:
FL= total fraction of the carbon footprint attributed to milk production
R= kg meat.kg of produced milk
1 - 5.7717= allocation factor for milk.
Therefore, kg of meat were obtained from the sum of animal live weights, including calves (male and female), bulls, steers, heifers, and animals for sacrifice (IDF, 2010). The produced milk was corrected in fat (4%) and protein (3.3%) (Equation 11).
 Equation 11
For Valle del Cauca department, fat and protein percentage were 3.5 and 2.9, respectively.
Testing and model construction
Using the system dynamic (SD) methodology, was built a model that addressed the herd population dynamics in Valle del Cauca department as a reference of the work carried out by Pereira et al. (2009); Parsons et al. (2011) and McRoberts et al. (2013), where it include similar population chains in this research.
The model was built using Vensim®PLE Plus version 6.3 (Ventana System, Inc. ®), to build simulation models for conceptualizing, document, simulate, analyze and optimize models created by the methodology of system dynamics. The time for the simulation was 20 years, time horizon pertinent to see the herd evolution and response to certain interventions and proposed policies.
The created animal categories, as previously described, established some division ages, which were represented by level variables (stock). These levels in turn, were directly and unique influenced by their different flow variables (input and output), which they were affected by various auxiliary variables (Equation 12), (Figure 1).
 Equation 12
Figure 1 Stock and Flow diagram used to simulate the population dynamic of bovine herd in Valle del Cauca, Colombia.
The population chain started with the input flow, which represented the cattle births and finished with the output flows correlated with cows and steers under 3 years old. The inflows, have allowed passage among categories (levels) and were directly affected by auxiliary variables (constants), which were determined by the spent time in each group. The outflows for each group, simulate mortalities and sales, affected by auxiliary variables, which express their respective rates. In addition, auxiliary variables, were introduced into the birth rate model, calving interval, parity, among others. The information for these variables was obtained accordingly to FEDEGAN (2014).
During the model building process, were performed some tests recommended by Sterman (2000), to generate confidence in exposed results. First, the structure of the model was compared with the system reality, also developed equations are analyzed in order to verify the results were consistent. Other tests were also conducted, i.e., the system behavior under extreme conditions and sensitivity parameters. The test of extreme conditions was carried out on the calves mortality rate (female and males, between 0-12 months of age) with values of 0 and 100% (Figure 2).
Figure 2 Behavior of the cattle population of Valle del Cauca, Colombia under extreme conditions in calves death rate (0 to 100%) between 0 and 12 months old.
On the other hand, the sensitivity test was performed varying in 10% the herd birth rate (Figure 3). In each of these cases, the behavior of the total cattle population, was expected.
After testing the model, emission factors for each category were added, represented by auxiliary variables. After testing the model of population chain, emission factors were added to each category, represented by auxiliary variables, in order to estimate dynamically the production of greenhouse gases and carbon footprint caused by cattle activity in Valle del Cauca department, Colombia. In addition, 3 different policies were raised in order to improve the herd efficiency, reduce GHG emissions and kgCO2eq proportions per kg of generated product. Raised policies were included as follows: 1) improving reproductive parameters (IRP): increased birth, from 83 to 90% and decrease in age at first calving, from 34.8 to 30 months of age. 2) increased production of milk per cow (IPM10), from 5.33 to 10 kg.day-1. 3) policies integration 1 and 2 (P1+P2). Policies were raised according to the recommendations proposed in the research of Pereira et al. (2009).
Results and discussion
It is important to note that divided livestock population were into groups according to the methodological sequence proposed by the IPCC (2006), average daily of dry matter intake per animal for each category was estimated, respectively. The obtained values are shown in Table 1.
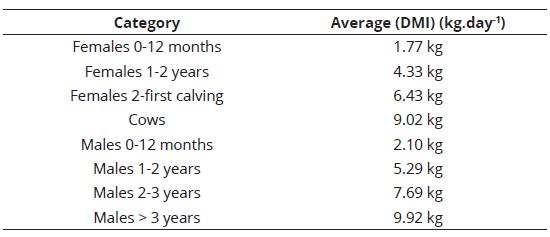
This provides more accurate and reliable estimates of the obtained consumption of dry matter and forage nutritional quality (protein, energy, and NDF digestibility), methane emission factors and nitrous oxide.year-1.animal-1 within each group formed were estimated, respectively (Table 2).
Table 2 Emission factor of enteric and manure methane (CH4) and nitrous oxide (N2O) for each animal category, expressed in kg-year-1 for cattle head
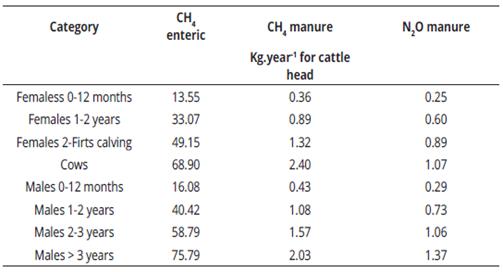
Table 2, shows the detail level for each EF obtained using the equations Tier 2 of IPCC, which vary significantly from standard values proposed by the Tier 1 (72 and 56 kg.animal-1.year-1 of CH4 enteric for dairy cows and others animals, respectively. In addition, 1 and 2 kg.animal-1.year-1 of CH4 in terms of the excreta for all categories.
The GHG emissions were calculated using the estimated EF for each category, multiplied by the number of animals in each of these. The animal inventory of the last 6 years is shown in Table 3. CH4 annual emissions for the years 2010, 2011, 2012, 2013, 2014 and 2015, were 22916533 ; 23148899 ; 22836285 ; 22023396 ; 22533967 and 21466173 kg, respectively. In the same year series, N2O emissions were 380283; 384697; 379247; 365627; 375228 and 356522 kg, respectively.
Table 3 Livestock inventory of Valle del Cauca in the last 6 years (FEDEGAN, 2014)
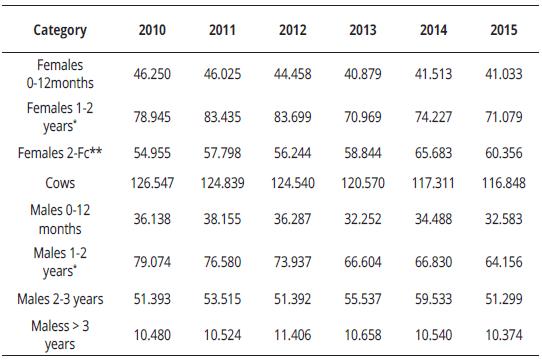
*Animals increased number in these categories, could be due to imports in Valle del Cauca, department-Colombia ** Fc: Firts Calving.
Subsequently, with the methane values and estimated nitrous oxide, the annual emissions of CO2eq, were obtained. The results are shown in Figure 4. Estimated average annual production of milk and meat for Valle del Cauca department, the kg of CO2eq per kg of generated product, were obtained. The results showed the CO2eq.milk-1 ratio for the years between 2010 and 2015 were as follows: 5.06; 5.37; 5.85; 5.59; 5.30 and 6.31 kg CO2eq.kg-1 milk, respectively.
Therefore, values between the range proposed by Gerber et al. (2011), which vary between 1.3 and 7.5 kg of CO2eq.kg-1 of fat and protein in corrected milk. For meat, in the same period above mentioned, the ratio was 4.64; 3.91; 2.81; 3.44; 4.37 y 2.10 kg of CO2eq.kg-1 meat, respectively.
Simulation of herd dynamics population, GHG and carbon footprint
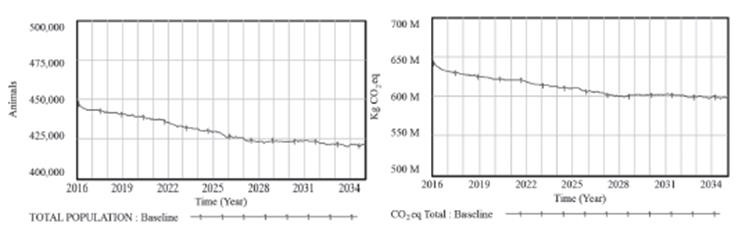
Model formulation to simulate the herd behavior, according to trend values obtained by vaccination cycles of the past 6 years. Presumably, Valle del Cauca livestock with a downward trend of 27000 animals over 20 years of simulation, seeing this behavior reflected in GHC decreased in 45557000 kg of CO2eq (Figure 5). The decreased pattern exhibited in the Valle del Cauca cattle population is due to herd outflows (animal sales and deaths), which is greater than inflows (birth rate and imports).
Although, the allocation factor calculation, the amount of CO2eq was obtained for each generated product by livestock (milk and meat), as shown in Figure 6.
Subsequently, these quantities were divided among kilograms of milk and meat annually produced in Valle del Cauca department, obtaining emission intensities between 4.1-4.3 kg of CO2eq. milk kg-1 and between 3.7 - 3.9 kg of CO2eq. meat kg-1.
Implemented policies
For policy 1, an improvement of the reproductive parameters, increased the number of herd animals and GHG emissions in relation to the behavior shown in the baseline (Figure 7). However, this strategy had no significant effect on kgCO2eq.kg-1 of generated product, because the emissions per animal were constant and the individual milk production was the same.
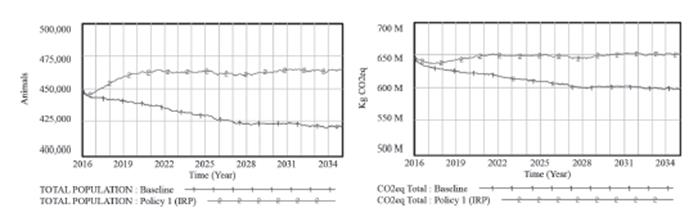
Figure 7 Effect of age lowering at first birth and birth rate increased on the herd inventory and their annual CO2 emissions.
To facilitate a more precise implementation in the policy 2, an increased daily milk production per cow, had no effect on cattle population or their animal emissions, but modified the intensity emission as shown in Figure 8, obtaining similar values to the global average proposed by Gerber et al. (2013), which was 2.8 kg of CO2eq. fat kg-1 and protein in corrected milk.
For policy 3, the dynamics of bovine population changed relatively in terms of the baseline, which had a directly proportional effect on the amount of produced CO2eq. Milk production increased by more than 100 million kilograms per year in relation to the baseline and proportion of kgCO2eq. kg-1 of decreased milk in 1.4 units (Figure 9).
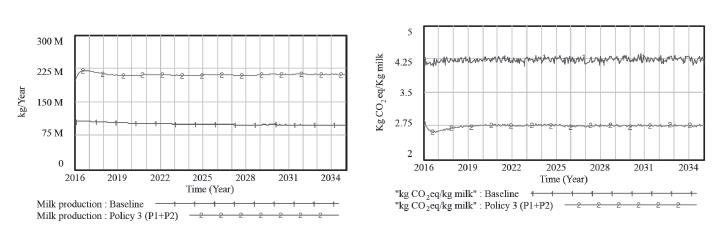
Figure 9 Effect of integration policies 1 and 2 on the annual milk production in the Valle del Cauca department and its emission intensity
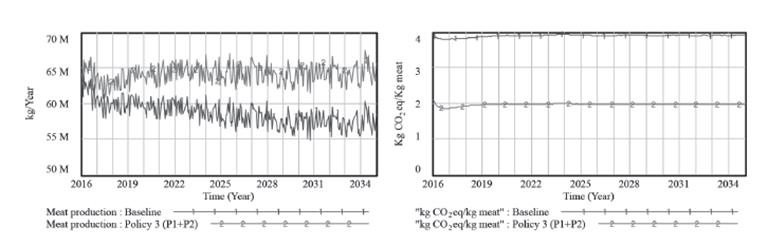
For meat, an increased production by more than 4 million of kilograms per year in relation to the baseline and proportion of kgCO2eq. kg -1 , which decreased in 2 units (Figure 10).
Conclusion
This information is useful to apply the methodology of dynamics system, which have allowed to argue the livestock behavior in the region and its contribution to global warming. Given these concerns, a required long-term analysis with the proposed model, provides more accurate and reliable estimates of strategies planning for greenhouse gas mitigation. The birth rate, age at first calving and calving interval, are key variables in the dynamic population of any species. The proposed model showed that selecting more efficient animals (productive and reproductively) can produce more animal protein (meat and milk) with lower carbon footprint. A subsequent integration of economic and social variables to the proposed model, could generate useful information for the evaluation of socio-environmental policies at the territorial level.

