Introduction
Identification of new protein sources to develop nutritional products is an area of promising research, given that it refers to flours from different sources, like tubers, legumes, cereals, and fruits that when mixed enhance their nutritional value and functional capacity. quinoa, amaranth, and chia flour are products cataloged as super foods because they are highly nutritious; quinoa (C. quinoa) is a source of vitamins E, C and B complex, as well as minerals, like calcium, iron, magnesium, manganese, phosphorus, potassium, and zinc.
Additionally, it contains healthy fatty acids, protein, and fiber indispensable for health. Amaranth (A. caudatus) contains an excellent balance of natural amino acids, minerals, and vitamins A, B, C, B1, B2, B3, and it is rich in folic acid, niacin, calcium, iron, and phosphorus. It presents high caloric value, carbohydrates, fibers, and mineral salts. These two pseudo-cereals are rich in fiber and antioxidants, with positive effects on the metabolism of lipids and carbohydrates, contain proteins rich in lysine, and provide a biological value similar to that of proteins of animal origin. All these nutritional benefits can be used to innovate products in the baked goods sector, or elaboration of meat analogues like cold cuts (Delgado & Albarracín, 2012).
Chia (S. hispánica) has a high content of protein and dietary fiber, besides being an excellent source of calcium, phosphorus, magnesium, potassium, iron, zinc, and copper, three times higher than traditional products, like spinach, legumes, and milk, characteristics that represent an opportunity for its use in the elaboration of fortified foods. Recent studies have demonstrated that chia can be successfully added to nutritional products. For example, chia gel has been used to replace eggs in cakes, without diminishing the sensory properties (Pizarro, Almeida & Sammana, 2013). Chia flour is used to improve chestnut flour mass, finding better results than with olive oil or sunflower oil. Due to its functional properties, like higher absorption and water retention, it is incorporated in cakes to improve nutritional properties and maintain sensory acceptance (Ramos et al., 2013).
Hence, quinoa, amaranth, and chia flours represent an important alternative to efficiently supply mankind's nutritional requirements, broadening the availability of protein sources which can be included in the new concepts of nutrition and healthy lifestyles, guaranteeing perfect equilibrium, without deficiencies or excesses. Given these concerns, the aim of this study was the physical-chemical characterization of quinoa, amaranth, and chia flours and seeds through proximal, optical, functional, thermal, and structural analyses.
Materials and methods
Raw materials
This research used flours and seeds of quinoa (C. quinoa), amaranth (A. caudatus), and chia (S. hispanica) obtained in a local market in the city of Armenia, Quindío, Colombia. Their moisture content and water activity was determined to establish compliance with quality parameters according to Colombian Technical Standard, NTC 267.
Proximal analysis
Proximal analysis of quinoa, amaranth, and chia flours was determined according to the methods described by the AOAC (Association of Official Analytical Chemists) in the following manner: humidity analysis (934.01), total ash (923.03), protein (984.13), and using 6.25 as conversion factor, fat (920.39), and raw fiber (925.09). The carbohydrate level was obtained through difference (AOAC, 2002).
Optical analysis
Optical microscopy is versatile qualitative technique is used frequently as complement of chemical analyses and offers a general idea of the quality and distribution of nutrients in seeds. Longitudinal cuts were made to quinoa, amaranth, and chia seeds. For the identification of biomolecules such as starch fats and proteins, were used as indicators lugol, sudam III and biuret, structures were observed in a stereoscope (NIKON SMZ800).
Functional analysis
Swelling capacity (SC) is the ease with which a product increases its volume in the presence of water excess. A total of 2.5 g of flour was weighed in a calibrated test tube; water excess (30 mL) was added and agitated manually. The solution obtained was left to rest for 24 h, at ambient temperature of 27 °C ± 0.5 and the final volume (Vf) of the sample was measured in mL (Robertson, Monredon & Dysseler, 2000). The SC result was obtained by applying Equation (1).
Water retention capacity (WRC) is defined as the weight in grams of water retained by a gram of dry sample. For analysis, 1 g of flour was weighed in a test tube; 30 mL of water were added, agitated and left to hydrate for 18 h. Thereafter, sample was centrifuged at 2000 rpm for 30 min, the supernatant was separated and the residue was transferred into a crucible and weighed, obtaining the value of the wet residue (WR). Finally, the residue was dried at 105°C ± 1 for 24 h and weighed, obtaining the value of the dry residue (DR) (Chau & Huang, 2003). The WRC is obtained by applying Equation (2).
The percentage of soluble material was calculated indirectly from WRC with Equation 3.
Water absorption capacity (WAC) expresses the maximum amount of water that can be retained by a gram of dry material in the presence of water excess under the action of a force pattern. A 0.5-g amount of flour was weighed in a test tube; water excess (10 ml) was added and agitated for 30 min. Thereafter, the solution obtained was centrifuged during 10 min at 3000 rpm; the supernatant was removed and the sediment was weighed. The results were expressed in grams of water per grams of sample, as shown in Equation 4 (Wu, Wang, Ma & Ren, 2009).
Oil retention capacity (ORC) expresses the maximum amount of oil retention in ml for a gram of sample (Ml.g-1). A total of 10 mL of sunflower oil was added to 1 g of flour and agitated during 30 min. Subsequently, it was centrifuged at 4750 rpm for 30 min. After centrifuge, the supernatant volume was measured. ORC was obtained through the difference between the initial volume of oil and the recovered volume (Amza, Amadou, Kamara & Zhu, 2011).
Determination of the Emulsifying Capacity (EmC). This was defined as the amount of fat that can be emulsified in a gram of sample. We added 20 mL of distilled water to 1 g of flour, agitating vigorously, and then 7 ml of corn oil were added and agitated; this mixture was centrifuged for 1 h at 3000 rpm. To determine the emulsifying capacity, the emulsified layer was measured with respect to total volume (Kaur, Kaushal & Sandhu, 2013).
Thermal characterization
This technique permits measuring the energy supplied to a substance (sample) and to a reference material in function of time or temperature, while the substance and the reference material are subjected to a controlled heating program. Thermal characterization was conducted with a differential scanning calorimeter DSC NETZSCH 214 Polyma, following ASTM E794 standard (standard test method for fusion and crystallization) as adapted parameter. We weighed 10 mg ± 0.5 of each flour with no prior treatment. The heating rate was performed at 5 °C.min-1 from 0°C to 200°C in nitrogen atmosphere, programmed with the equipment's internal control system (ASTM, E794).
IR vibrational analysis
Fourier Transform Infrared (FTIR) spectroscopy is an optical characterization technique through which the principal functional groups of the quinoa, amaranth, and chia flours were determined, within a range of wavenumbers comprised from 4000 to 400 cm-1, corresponding to the spectral range of the mid-infrared (MIR). These measurements were made on an IR spectrophotometer (Prestige 21 Shimadzu).
Structural characterization
X-ray diffraction (XRD) is a useful technique to identify the amorphous or crystalline structure of a sample. Quinoa, amaranth, and chia flours were analyzed in a diffractometer (Bruker D8-Advance) equipped with a tube with CuK anode, emitting radiation of , a detector with voltage of 40 KV, and current of 40 mA. The measurements were made with an angle ranged from 3 - 60°, where each 3 s measures 0.02° and the average time of measurement for each sample is 2 h and 30 min.
SEM morphological characterization
Microstructure characterization images were obtained from a scanning electron microscope (SEM) (JSM-6610LV, JEOL Ltd. Japan). Samples were mounted on SEM aluminum stubs and then coated with gold/palladium (60:40) in cathodic pulverization (Edwards S150). Samples were systematically observed with 3000-5000 X magnification.
Statistical analysis
For proximal and functional analysis, use the Analysis of variance (ANOVA) and significant correlations were performed on the data adopting the least significant difference (LSD) and Pearson correlation analysis procedure, respectively, to test the statistical significance of the differences between means at a P < 0.05 confidence level. Data were processed using Statgraphics Plus v. 5.01 (StatPoint, Inc., Herndon, Virginia, USA).
Results
Table 1, presents the proximal comparison among the quinoa, amaranth, and chia flours.
Figure 1, shows photographs of longitudinal cuts of quinoa, amaranth, and chia seeds, along with the lugol indicator that stains the starch granules purple.

Figure 1 Identification of starch through lugol stain of the a) quinoa, b) amaranth, and c) chia seed
Figure 2, shows photographs of longitudinal cuts of quinoa, amaranth, and chia seeds at 3X magnification with the Sudan III indicator, which stains in red the spherosomes that lodge the fats.

Figure 2 Identification of fats through Sudan III staining ofthe a) quinoa, b) amaranth, and c) chia seeds
Figure 3, shows photographs of longitudinal cuts of quinoa, amaranth, and chia seeds with the biuret indicator, which stains protein structures blue.

Figure 3 Identification of proteins through biuret staining of the a) quinoa, b) amaranth, and c) chia seeds.
The values obtained from the functional tests are shown in Table 2, whose results provide information on the interaction between the flours and water and the values obtained for the WRC, EmC, ORC and the EmC for quinoa, amaranth, and chia flours.
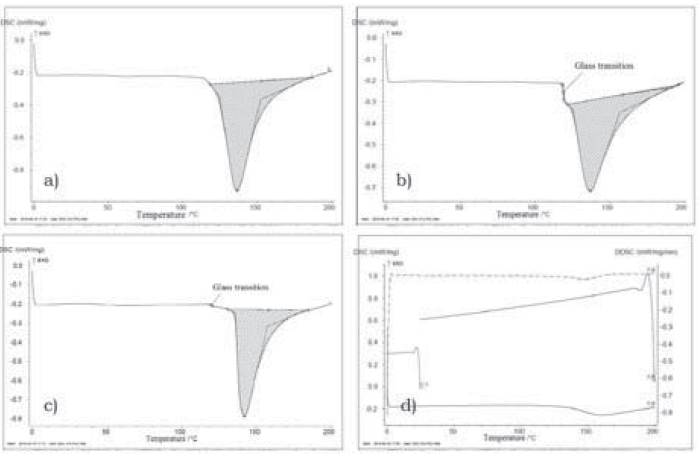
Figure 4, presents the differential scanning calorimetry (DSC) thermogram for the flours studied.

Figure 4 Differential scanning calorimetry (DSC) thermograms for a) quinoa flour, b) amaranth flour, c) chia flour, and d) Second scan.
Table 3, summarizes peak temperatures (Tp), change in specific heat (ACp), obtained from the thermograms for quinoa, amaranth, and chia flours.
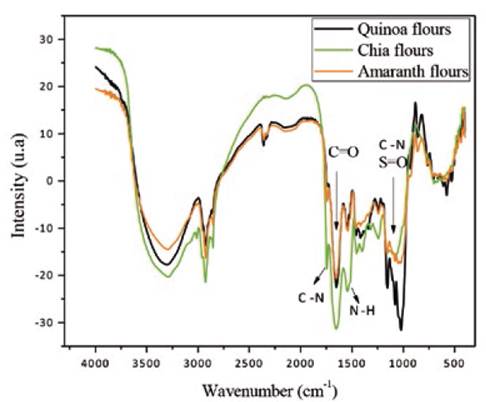
Seeking to identify the principal functional groups and their differences in the flours studied, transmission spectra were obtained in the mid-region of the infrared range for quinoa, amaranth, and chia flours. These are shown in Figure 5 and Table 4.
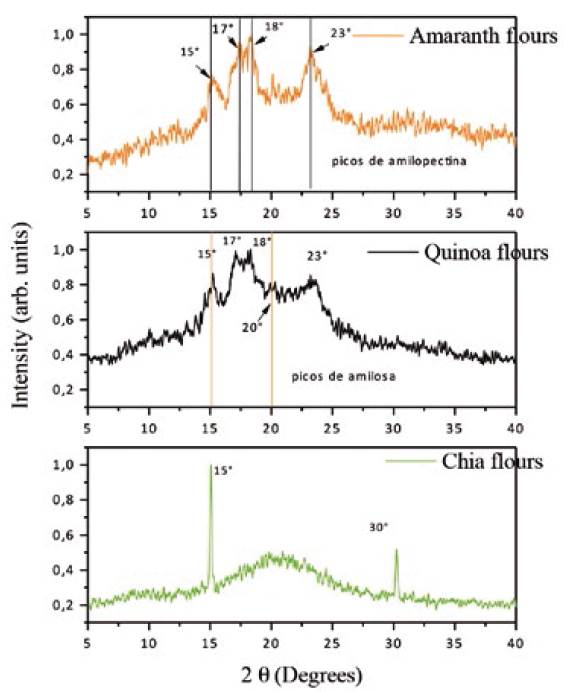
X-ray diffraction patterns obtained for the quinoa, amaranth, and chia flours are presented in Figure 6.
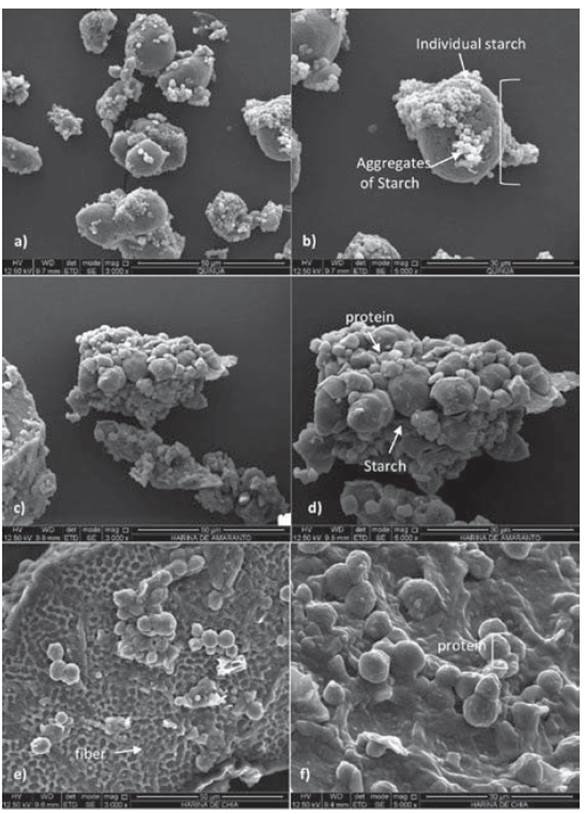
Figure 7, presents the images provided through the SEM technique through which it was possible to evaluate the particle morphology of the studied samples.
Discussion
Proximal analysis
Samples of the three flours exhibited significant differences in protein and fiber content, with the highest percentages presented by chia. These values are quite close to those obtained by Rai, Kaur & Singh (2014). Likewise, high fat content of the three flours is observed, compared to cereals and legumes. The quinoa and amaranth flours had high carbohydrate content and did not show statistically significant differences between them through the proximal analysis. Chia flour showed statistically significant differences in protein and fiber with respect to the quinoa and amaranth flour and the nutritional balance of chia is highlighted in all its components (Table 1)( Ramos-Diaz, Kirjoranta & Tenitz, 2013).
Optical analysis
Note that for quinoa and amaranth, the starch is lodged in the central part, denominated perisperm, and occupies much of the seed, which explains the higher levels of carbohydrates than in the chia seed. The chia seed (Figure 1c) does not show starch granules, hence, the value of carbohydrates obtained through proximate analysis refers to another type of carbohydrate. Note a large protein body, biomolecules that determined the significant differences found through the proximal analysis between the quinoa and amaranth seeds with respect to the chia seed.
Figures 2a and 2b show the spherosomes that lodge in the bran fraction of the quinoa and amaranth seeds. The percentage of bran fraction (cotyledons and coating) is higher in the amaranth and quinoa seeds compared to cereals, like wheat and corn, which explains the higher levels of fat. Chia seeds (Figure 2c) show high contents of large spherosomes distributed throughout the seed, evidenced in greater amounts than in quinoa and amaranth. However, in the proximal analysis, the proportions of fat are quite similar for the three flours; this can be explained because flour is a sub-product of the extraction of fat from the seeds. These images (Figure 3a, b) demonstrate that in the quinoa and amaranth seeds, protein lodges in the embryo and around the cotyledons in large proportion. In the chia seed, the protein also lodges around the cotyledons and the embryo, however, the difference in proportion with respect to quinoa and amaranth lies in that the embryo structure is large (Figure 3c).
Functional analysis
Note that chia flour showed significant differences in its functional properties such as SC, WAC, and WRC, with higher values than quinoa and amaranth (table 2). Also note that for the three flours, WRC is significantly higher than WAC, indicating that the material retains almost all the water absorbed (Martín-Pedrosa, Gomez-Fernandez, Varela & Guillamon, 2016). From the results corresponding to SC, high values are observed for the three flours, compared to those of some flours from legumes, like chickpeas and white beams that range between 1 and 2.5 ml.g-1. Likewise, it is observed that chia triplicates its SC with respect to quinoa and amaranth flours, which may be explained due to high content of fiber that influences on the volume gain from the high absorption of water. The SC from the chia could be attributed to its proteins and because their proportion is higher than in the other flours. For all samples, the percentage of solubility is low, which demonstrates the capacity these flours have to imbibe in water without dissolving the proteins. WRC for quinoa and amaranth is low, similar to chickpeas, lentils, soy, canola, and bean flours that range between 2.10 and 3.5 g.g-1; chia presents high WRC, similar to that of broccoli and pumpkin flours at 14 and 13 g.g-1, respectively (Dhinda, Lakshmi, Prakash & Dasappa, 2012).
WAC for quinoa and amaranth flours show mean values of 1.259 and 1.628 g.g-1, respectively, below other flours, like common beans 3 g.g-1 and green beans 2.1 g.g-1, while chia flour showed higher WAC than beans Cannavalia (5.1 g.g-1), reported with the highest hydrophilic trend (Aguilera, Estrella, Benitez, Esteban & Martín, 2011). It is worth highlighting the role of WRC on the texture of meat products, conferring in them properties of consistency, viscosity, and adhesion, which is why chia meal could be used to prepare meat products, like sausages or meat substitutes and improve the functional capacity of quinoa and amaranth when mixed with them. WRC and WAC is due mainly to the nature of hydrophilic chain proteins and to the fiber; these two functional properties are important in processes, like extrusion, where the material is subjected to hydration to obtain emulsions with good consistency. Differences in the functional capacities of quinoa, amaranth, and chia flours, depend on the content and distribution of macromolecules in the matrix, mainly starch that traps water and gelatinizes, as well as water absorption by the nutritional fiber and dissociation of proteins. This gives way to higher exposure of the polar groups in the peptide chains, thus, increasing fixation of the water molecules.
Note that the ORC is similar for the three flours and high compared to that reported for other flours of legumes, like chickpeas, lentils, and beans that range from 0.95 to 1.20 ml.g-1. ORC variations are determined by the presence of amino acid non-polar side chains that bond to the oil hydrocarbon side chains (Vasishtha & Srivastava, 2013).
ORC is important for conservation of aromas, to improve palatability, and increase the mean life of confectionery products, donuts, pancakes, pastries, as well as meat products, and soups. Quinoa, amaranth, and chia flours had intermediate EmC (11.9, 12.8, and 14.6%, respectively) compared to lentil with EmC at 47%, but similar to that of chickpea at 12%. This functional behavior is attributed to the globular nature of the flour proteins and the low solubility they have presented (Indrani, Swetha, Soumya, Rajiv & Rao, 2011). Similarly, EmC is related to the content of nutritional fiber and to the proportion in which the fiber fractions are present in each of the flours, as shown in the proximal analysis.
Thermal characterization
We observe a change in enthalpy (ΔΗ) associated to first-order thermal transitions (crystallization of fat, water and sugars; gelatinization of starches; denaturalization of proteins, etc.), represented by a pronounced endothermal peak over the thermogram base line. In this process, peak temperature (Tp) is the temperature that registers the highest heat absorption values and where there is loss of structure or crystallinity (Figure 4). The three flours had very close Tp amongst each other and similar to the Tp found for corn meal rich in amylose (Zhang, Chen, Zhang, Zhong, Luo, Xu & Guo, 2016); however, if compared to chickpea, kidney bean, and bean flours among others, with Tp ranged from 49 to 66°C, it is considered that the Tp found is high (Umaña, Lopera & Gallardo, 2013) (Table 3). Upon completing the endothermal process, the system returns to a state in which no changes are evident in the phase or in the composition of the sample. Then, a second scan was run at temperatures without changing the sample, as shown in Figure 4d, where the endothermal peak repeats, but this time with lower intensity, which is why it may be inferred that it is an irreversible degradation process. Likewise, noted that for amaranth and chia flour samples there is a change in specific heat without latent heat, denominated glass transition (Tg), at temperatures above 100°C; which indicates that the flours have a wide range of thermal stability and is consistent with the low moisture contents in the flours.
Structural characterization
Fourier Transform Infrared (FTIR) spectroscopy
We observe two bands between 2850 and 1933 cm-1 attributed to vibrational modes of stretching of the C-H bond of CH2 and CH3 groups -principally of carbon chains, like aldehydes, ketones for the three samples (Abugoch, Tapia, Villamán, Yazdani & Díaz, 2011). Both intense bands at 1657 and 1549 cm-1 can be attributed to amide I and amide II, respectively. These two bands are associated to combinations of vibration modes of the amino groups of the amino acids in the protein structures and are particularly important because they reflect the modifications of the structure of the secondary protein. The quinoa flour showed differences regarding the composition in the region comprised between 1000 and 1250 cm-1 (vibrational modes of C-N and S=O groups), probably due to traces of saponin or sulfate groups appertaining to the structure of their amino acids. Similarly, chia revealed differences in its composition between 1400 and 1700 cm-1 (vibrational modes of C=O, C-N, N-H groups) due to the content and nature of its fatty acids and proteins.
X-ray diffraction (XRD)
It is to note a starch diffraction pattern in the quinoa flour and the amaranth flour, given that starch has semi-crystalline structure and appears in high proportion in both (Prieto-Méndez, Prieto-García, Bello-Pérez & Román-Gutiérrez, 2010). Diffractograms for quinoa and amaranth flours show peaks in values of 2Θ at 15°, 23° and a double peak at 17° and 18°, which correspond to the amylopectin chains (type A polymorph). There are also few coincidences with amylose peaks (Guantian & Fan, 2017). This also agrees with what was found by Salgado-Cruz, Ramírez-Miranda, Díaz-Ramírez, Alamilla-Beltran & Calderon-Domínguez (2017), for pita breads enriched with chia mucilage. This diffraction pattern is related to the low gelatinization and the minimum loss of crystallinity, in addition to the starch permanence in its native form even at temperatures around 100°C, as observed in DSC (Salgado-Cruz et al., 2017). Diffractogram for chia shows a single widened peak, characteristic of amorphous material, given that the flour does not contain starch. Besides, two well-defined peaks are identified for the chia flour at 15° and 30°, which correspond to calcium and magnesium, respectively.
Microstructure characterization
Figures 7 a,b, 7 c,d, and 7 e,f correspond to quinoa, amaranth, and chia flours, respectively. In Figures 7 a and 7 b of quinoa flour, it is observed that the highest contents in flour are the starches of polygon form with the sizes of approximately 1.3 μm, which are grouped to form larger aggregates. Some aggregates and individual granules have been dispersed as a result of the milling process. In the Figures 7c and 7d of the amaranth flour, aggregates of starch without a determined form of the individual granulate are also observed. Besides, a protein matrix surrounding the granules of starch is noticed, which is not seen in the quinoa. This same protein-starch organization was reported for sorghum flour and is associated with low starch digestibility. The morphology of the chia flour in Figures 7e and 7f shows polygonal structures characteristic to fibrillary structures such as cellulose and hemicellulose. Agglomerated spherical structures corresponding to protein structures are also observed (Hasmadi, 2014).
Conclusions
The results obtained from the optical analysis allowed identifying biomolecules like starch, proteins, and fats and their distribution in quinoa, amaranth, and chia seeds. Chia flour had a high functional capacity with WRC, WAC, and SC values three times higher than the values found for quinoa and amaranth flours. The spectra obtained through DSC indicated a broad thermal stability range with loss of structure and crystallinity at temperatures above 100°C for all flours assessed. FTIR analysis permitted establishing structural differences in fat and proteins in chia, quinoa, and amaranth flours. X-ray dispersion patterns identified the type of starch for quinoa and amaranth flours (type A) and two crystalline peaks for chia flour, which corresponds to calcium and magnesium. Scanning electron microscopy images allowed observing aggregate starches in quinoa flour, the complex protein structure surrounding the starches in amaranth flour, and fiber as well as protein structure in chia flour.


