


 English (pdf)
 Article in xml format
 Article references
 Send this article by e-mail
 Cited by SciELO
  Cited by Google
  Similars in
SciELO
Similars in
SciELO  Similars in Google
 Permalink
Introduction
Sugarcane stem borers are key pests that depress sugarcane yield and sugar quality in sugarcane-producing countries. The Diatraea complex (Lepidoptera: Crambidae) is recognized as severe sugarcane pests in Venezuela. Stalk tunneling by Diatraea spp. larvae decreases water and nutrients uptake resulting in the death of upper stalk pieces, lodging, and access of pathogens through tunnel openings (Dinardo-Miranda, Dos Anjos, Da Costa & Fracasso. 2012). The use of biological control by parasitoids such as Cotesia flavipes, Lydella mínense and Trichogramma spp. in integrated pest management programs has been a strategy used in many countries. However, another method has been the use of resistant genotypes to sugarcane borers (Pfannenstiel & Meagher, 1991). A study carried out by Demetrio, Zonetti & Munhoz (2008), established the damage caused by Diatraea spp. naturally infested in eight sugarcane varieties, and found a distinctive behavior between genotypes. Conversely, Portela, Pádua, Castelo Branco, Barbosa & Silva (2011) also assessed infestation intensity in five sugarcane varieties, not finding differences between them; however, the authors worked in a very low infested area. Moreover, Legaspi, Legaspi, Irvine, Johnson, Meagher & Rozeff (1999), contrasted damage estimates by stalks borers and sugar quality of two important varieties in the lower Rio Grande valley in Texas; the cultivar NCo 310 showed greater mean percentages of bored internodes (19.4 %) than the cultivar CP70-321 (10.9 %). Basically, resistant genotype selection to pests in diverse environments represents an ideal way to optimize progress in sugarcane breeding programs (White, Viator, Dufrene, Dalley, Richard Jr. & Tew, 2008).
Additionally, the use of diverse statistical techniques specifically adjusted to study the genotype by environment interactions (GEI) for host plant resistance has been proved. These techniques include joint regression (JR), additive main effects and multiplicative interaction (AMMI) analyses, and site regression model (SREG) (Rea, Sousa-Vieira, Díaz, Ramón, Briceño, George, & Balzano-Nogueira, 2016; Yan & Falk, 2002). The AMMI model and GGE Biplot have been used to analyze the GEI and recognize genotypes with stable resistance to Puccinia graminis f. sp. tritici in Triticum aestivum (Gitonga, Ojwang, Macharia, & Njau, 2016) and Orobanche spp. in Vicia faba (Rubiales, Flores, Emeran, Kharrat, Amri, Rojas-Molina & Sillero, 2014). GEI is important for the development and evaluation of stable pest resistant varieties. Therefore, the aim of this study was (i) to evaluate a sugarcane genotype group to damage caused by Diatraea spp. in diverse environments, and (ii) to establish the interrelationship between the damage caused by Diatraea and yield components in sugarcane.
Materials and methods
Study site
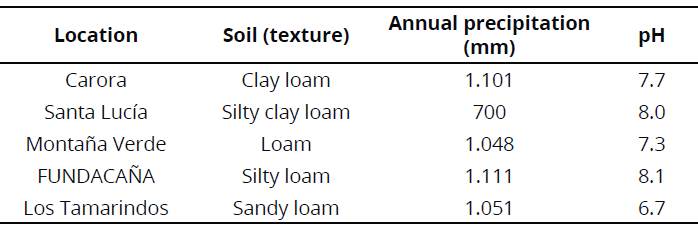
To carry out this research data from test fields located in plots from the Venezuelan Sugarcane Breeding Program at Instituto Nacional de Investigaciones Agrícolas (INIA) were used. The genotypes were planted in a completely randomized block design with three replicates; experimental units had a dimension of 45 m2 (3 rows of 10 m with separation of 1.5 m). All genotypes were evaluated at five locations: Carora and Montaña Verde in Lara State; Santa Lucía and FUNDACAÑA in Yaracuy State; and Los Tamarindos in Aragua State. All were of three crop-years of age (plant crop, first and second ratoon). In addition, main soil types and precipitation characteristics of the five Venezuelan locations assessed are shown in Table 1.
Plant material
The experimental material evaluated included the following genotypes: V91-1, V91-2, V91-6, V91-8, V91-15, V98-62, V98-86, V98-120, V99-117, V99-190, V99-203, V99-208, V99-213, V99-217, V99-236, V99-245, V00-50 and three control checks: B80-408, C323-68 and CP74-2005.
Sampling and variables measured
Plots were managed conventionally and following common local practices. Numbers of stalks per meter (NSM) were counted within each plot. A sample of ten stems was randomly taken from each plot and stem diameter was measured using a Vernier. These samples were pressed and the juice was examined for sucrose content (Pol % cane). The % of apparent purity (PA) and fiber content (FIB) were analyzed by the standard method of Meade & Chen (1977). The sugarcane was flamed and then cut by hand. All three rows were harvested to measure cane yield (TCH). Moreover, damage caused by Diatraea was estimated by infestation intensity (II) and index of damage (ID) using the methodology designed by Yépez & Linares (1987). To calculate II, ten stems were randomly cut by genotypes and repetition. Numbers of stems perforated and total internodes were counted. Index of damage was estimated by counting total number of whole stems and perforated stems. This have allowed us to calculate the indices using Equations 1 and 2.
Intensity of Infestation (II):
 Equation 1
Index of damage (ID):
 Equation 2
Statistical analysis
Data for % intensity of infestation (II) was approached to normal distribution by procedures of square root transformation. AMMI and site regression models were applied. AMMI model incorporates the additive parameters of a conventional variance analysis with multiplicative parameters of a principal component analysis. The Gollob test was conducted to establish the significance of each principal component (Asfaw, Alemayehu, Gurum & Atnaf, 2009). The SREG GGE is a multiplicative model that assimilates the main effects of genotypes plus the environment interaction which are the two primary factors for genotype selection (Yan & Tinker, 2006). GGE biplots use the primary and secondary effects from SREG analysis and are effective in mega-environment analysis, test environments, and genotypes evaluation (Ukalski & Klisz, 2016; Yan, Kang, Ma, Woods & Cornelius, 2007). In addition, a Spearman's correlation and principal component analysis were conducted to determine possible associations among damage caused by Diatraea, cane yield and yield components. All statistical analyses were carried out using the software Infogen (Balzarini & Di Renzo, 2016).
Equation 3 gives the AMMI model.
 Equation 3
Equation 4 gives the site regression model (SREG).
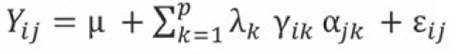 Equation 4
Where:
Yij: mean yield of genotype i in environment j
μ: grand mean
g i : main effect of genotype i (i = 1, 2. g)
e j : main effect of environment j (j = 1, 2. e)
λ k : proper value of the k corresponding axis of the principal component
ƴ ik : genotype own unit vectors associated to λa.
αjk environmental own unit vectors associated to λ k
ε ij . residual associated with genotype i in environment j
p: number of axes of the principal components considered in the AMMI and SREG models.
Results
AMMI analysis for intensity of infestation (II) percentage
The AMMI analysis of variance for II of 20 su garcane genotypes tested for five environments showed that 62.44 % of the sum of squares (SS) for treatments was accountable to genotypes (G), 4.88 % to environments (E) and 32.47 % to GEI effects (Table 2). A large SS for G denoted that the genotypes were diverse with large contrasts to the means, causing most of the variations in the level of their Diatraea reactions. The small proportion of SS for E revealed that change in environmental means was not very high. The two first principal components (PCA-1 and PCA-2) estimated 37.6 % and 31.4 % of the SS interaction. Mean square (MS) for both PCA-1 and PCA-2 were significant at P< .01 level and cumulatively provided 69.00 % of the total interaction.
Table 2 AMMI analysis for intensity of infestation (II) of 20 sugarcane genotypes across five environments
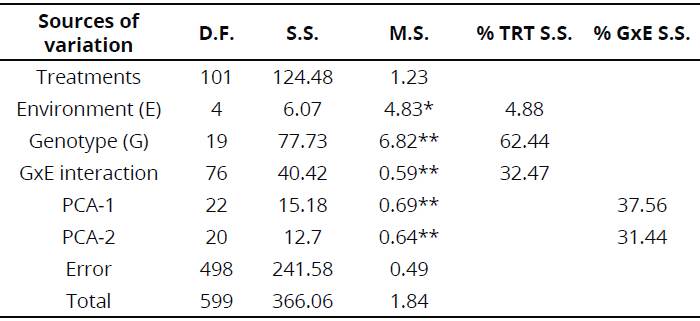
**; * Significant at Ρ < .01 and P < .01, respectively; D.F. = Degree of freedom; S.S. = Sum of squares; M.S. = Mean squares; PCA = Principal component analysis.
Mean values of II for the genotype studied fluctuated from 1.33 (V99-117) to 12.29 (CP74-2005) for locations La Pastora and Santa Lucía, respectively. Genotype CP74-2005 registered the highest % II (8.97) over other locations, followed by V91-8 (9.97) and V98-120 (8.91). Genotype V99-217 had the lowest damage caused by sugarcane borers in all locations (Table 3).
Table 3 Mean for % intensity of infestation (II) of 20 sugarcane genotypes in five locations
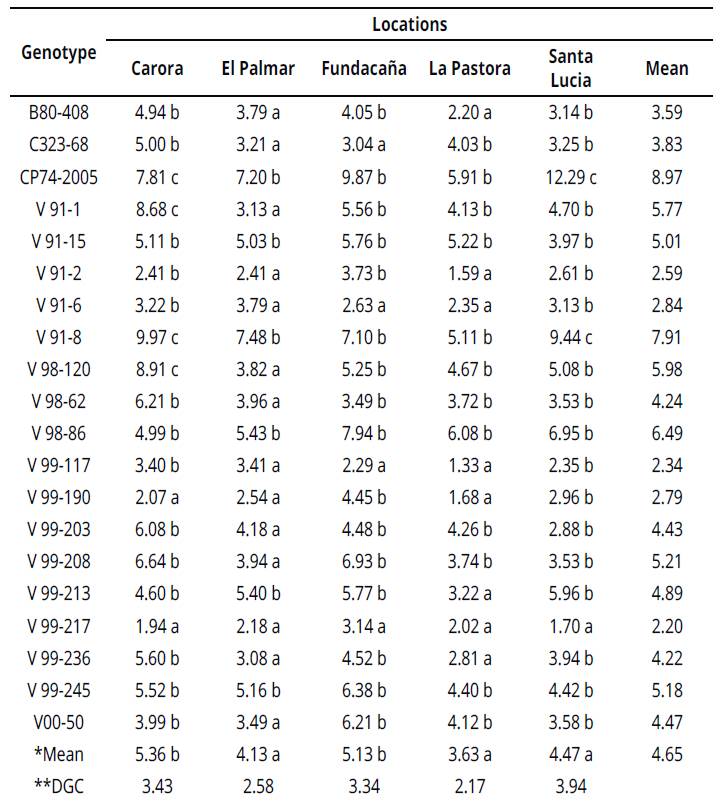
*Mean values sharing at least one similar letter are not significantly different at 1% significance level.
**Test Di Rienzo, Guzmán and Casanoves (DGC) (Balzarini & Di Renzo, 2016). Untransformed data.
Genotypes and environment stability
An AMMI-2 biplot analysis was carried out by using genotypic and environmental scores of the first two AMMI components explaining 69 % of the GEI variation (Figure 1).
Genotypes CP74-2005 and V91-8 had a positive interaction with Santa Lucia environment, hence showed major damage by Diatraea. V98-120 and V91-1 displayed positive interaction with Carora environment. Genotypes C323-68, V99-236 and V91-6 were near the origin of the axis, therefore, these were more stable or less affected by Diatraea across environments. Environments Santa Lucia and Carora contributed mostly to the GxE interaction, because they were positioned far from the origin in the AMMI2 biplot. Locations El Palmar and Fundacaña showed acute angles between them in the biplot, which implies that performance of genotypes in both locations was similar; otherwise, both locations exhibited obtuse angle with environments Carora and Santa Lucia.
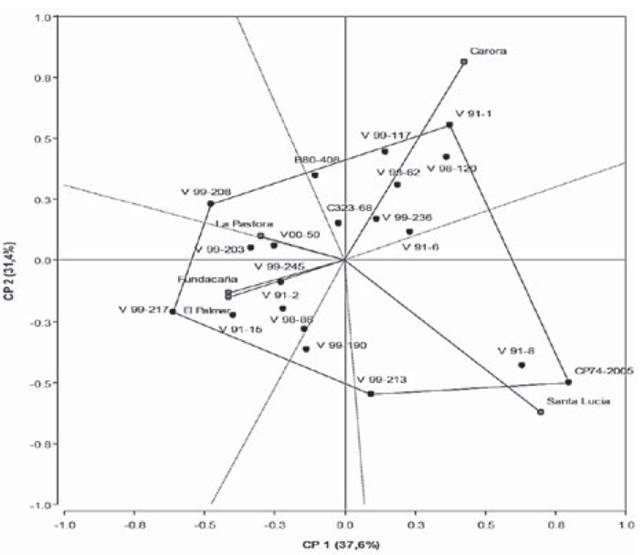
Figure 1 AMMI2 model for % intensity of infestation (II) of 20 sugarcane genotypes in five locations
When fitting the GGE biplot, the first two principal components (PC) obtained by singular value decomposition, explained 88.4 % (PCA-1 = 76.6 % and PCA-2 = 11.8 %) of the total GGE variation in sugarcane borer damage (II). In this sense, the biplot GGE (Figure 2), classified the environments into two mega-environments.
This revealed that no unique genotype had the highest damage by Diatraea in all environments. The first ME-1 grouped the locations Carora, Santa Lucia and Pastora. The vertex genotypes for this ME-1 were CP 742005, V90-86 and V91-1 which were the most affected by sugarcane borers. ME-2 was formed by the locations El Palmar and Fundacaña and the vertex genotype was V91-15.
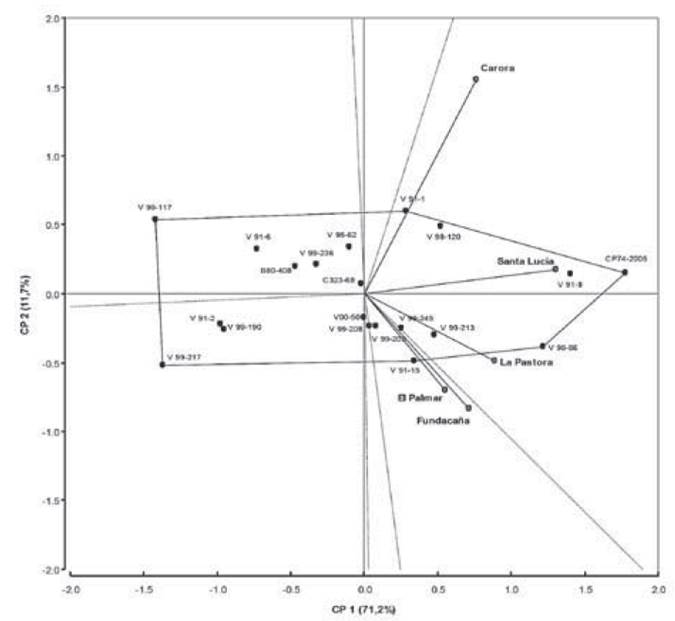
The genotypes V00-50, V99-236 and V99-203 were detected within the polygon (left side) and nearer to the plot origin and hence, were less responsive (stables) than the vertex genotypes (right side). Otherwise, genotypes V99-217, V99-117 and V99-190 had the lowest % II and placed far from the origin to the left side (2.2 % 2.3 %, and 2.8 % respectively). However, only V99-190 displayed high stability and cane yield (TCH) across locations (Table 4).
Table 4 Means and ranks of Diatraea damage andyield components in 20 sugarcane genotypes grown in five locations
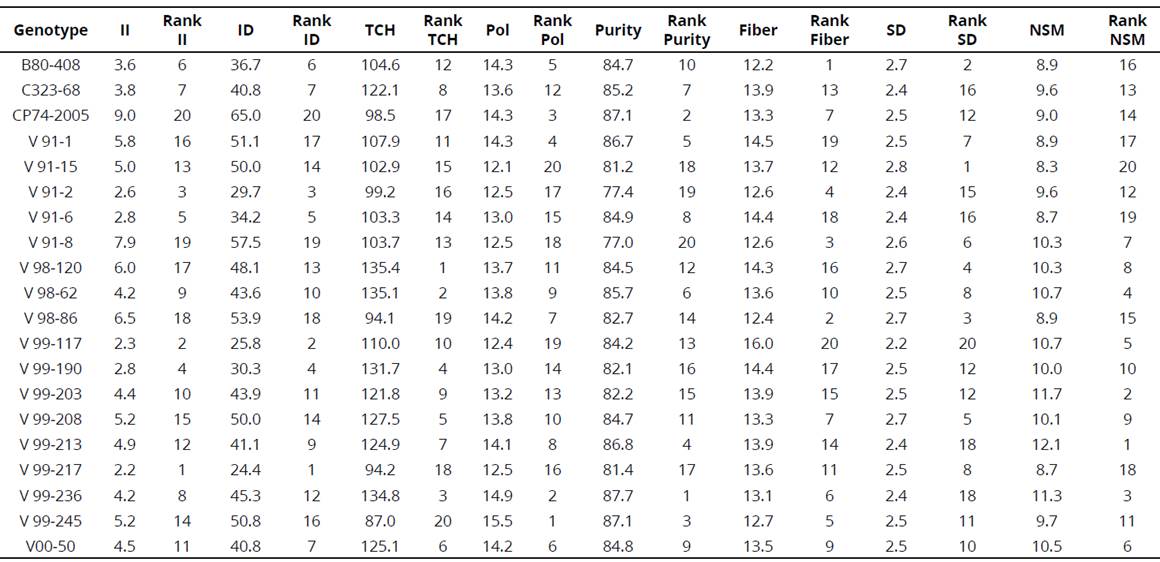
II= % Intensity of infestation; ID=lndex of damage; TCH=Ton of cane.ha-1; Pol= Pol % cane; Purity=% purity; Fiber=% fiber; SD=Stalk diameter; NSM=number of millable stalks per linear meter. Lower Rank values indicate higher resistance.
GGE biplot analysis also exhibited that environments Carora, Santa Lucía and Fundacaña had longer vectors than other environments indicating that they were more discriminatory of the genetic variability of genotypes. On the other hand, El Palmar and La Pastora had smaller vec tors revealing that they were less discriminative of genotypes.
Interrelationships among traits
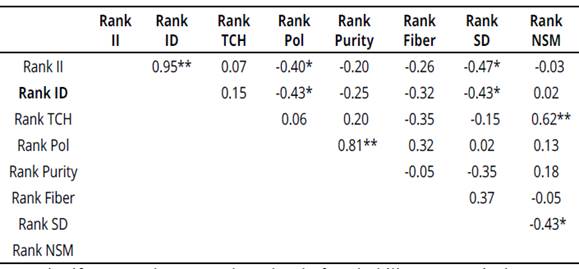
Principal component analyses of the correlation matrix and Spearman's correlation for ranking eight traits (II, ID, TCH, Pol, Purity, Fiber, SD, NSM) are presented in Figure 3 and Table 5.
Across twenty genotypes tested, ID and II were positively correlated (an acute angle) which implies that one of these indexes can be used to evaluate damage caused by cane borers. These
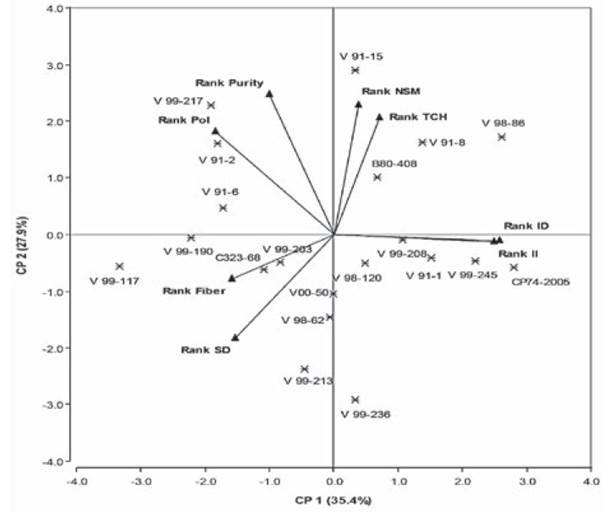
Figure 3 Interrelationships between the damage caused by Diatrea saccharalis and yield components in five locations
Discussion
The biplot analysis using genotypic and environmental scores of the first two AMMI components explained 69 % of the GEI variation. Genotypes and environments that fall into the same sector interact positively, but negatively if they fall into opposite sectors. Genotypes placed near the plot origin were less responsive than genotypes far from it (Yan & Tinker, 2006). The angle between the vectors of genotype i and environment j tells us something about its nature: the interaction is positive for acute angles, negligible for right angles, and negative for obtuse angles (Rea et al., 2016).
Positive interaction of genotypes CP74-2005 and V91-8 with Santa Lucia environment showed major damage by Diatraea; this suggests that damage caused by sugarcane borers seems to be worse when these genotypes are grown in this environment.
GGE biplot for % II shows that polygon view of biplot has been used to recognize Which-Won-Where patterns of multi-environment trials which are important for studying the possible presence of different mega-environments (ME) in a region (Yan, Hunt, Sheng & Szlavnics, 2000).
Regarding the fitting of the GGE biplot, the first two principal components (PC) obtained by singular value decomposition explained 88.4 % of total GGE variation in sugarcane borer damage (II). This suggested that these two principal components were enough to explain the phenotypic variation on damage caused by sugarcane borers and allow adequate conclusions (Yan & Tinker, 2006). The polygon is constructed by joining the vertices of the genotypes that are extreme from the biplot origin such that all other genotypes are contained in the polygon (Yan et al., 2007). Genotypes situated at the vertices of the polygon contributed mostly to the interaction, i.e. those with the highest (right side) or lowest (left side) % II (Yan & Falk, 2002).
The lines traced perpendicularly to each side of the polygon form location groups of similar behavior called mega-environments (ME). According to Rea et al. (2016) who evaluated twenty genotypes in eight locations for cane yield using GGE biplot, agree with our results, as they also found grouping into two mega-environments.
Relations between PCA correlation matrix and Spearman's correlation to eight traits help appreciate the relationships between traits and identifies traits that are positively or negatively associated, traits that are unnecessarily measured, and traits that can be used in indirect selection for another trait (Yan & Tinker, 2006).
The association for cane yield with biochemi cal traits, namely, Pol % cane and % purity were found non-significant, which indicated that these characters are independent (Ahmed & Ahmed, 2012). Therefore, simultaneous improvement on these traits might be possible.
NSM and TCH were positively correlated. High and positive correlation between NSM and cane yield was recognized previously by Kamat & Singh (2002). CP74-2005, a commercial variety, had the highest II and ID which was also corroborated in previous biplots, however, this variety would not be planted by farmers. None of the genotypes was completely resistant to sugarcane borer, i.e. this is an indication of the challenge that sugarcane breeding programs have regarding insect resis tance (Dinardo-Miranda et al., 2012).
Conclusion
This research established that there was no need to test the genotypes assessed for sugarcane borer damage in five locations, because only two mega-environments were sufficient. This should reduce testing costs and time.
The genotypes most recommended for their stability, good yield and low damage for Diatraea spp. across environments were V99-236, V00-50, and V99-190.
The cultivar CP74-2005 was the most affected by the damage caused by sugarcane stem borers through localities, which indicated that producers should avoid planting it.
Intensity of infestation (II) and index of damage (ID) were highly associated which implies that any of these could be used to measure Diatraea damage. Moreover, high infestation intensity (II) and index of damage (ID) caused by Diatraea spp. affected negatively the Pol % sugarcane of the genotypes.

