


 English (pdf)
 Article in xml format
 Article references
 Send this article by e-mail
 Cited by SciELO
  Cited by Google
  Similars in
SciELO
Similars in
SciELO  Similars in Google
 Permalink
Introduction
Leaf area index (LAI) valúes are used to determine sowing time (so that the highest leaf area coincides with the highest availability of solar radiation), when to apply pesticides, plant spacing, fertilization (Favarin et al., 2002), weed control, water use, soil erosion (Wilhelm et al., 2000). These factors directly impact growth and development parameters in agricultural crops (Benincasa, 1988; Bignami and Rossini, 1996).
Various methods are used to estimate LAI (Kvet and Marsall, 1971), and they are destructive and non-destructive. In some cases, destructive methods impose limitations on the number of treatment effects that can be evaluated, especially where only a limited number of plants is available (Lopes et al., 2007). Some methods and examples of how they are applied are cited in the literature, including the leaf disk method (Lopes et al., 2007), automatic planimeter (Mielke et al., 1995), leaf weight (Monteiro et al., 2005) and the gravimetric method (Norman and Campbell, 1989). Non- destructive methods include those that estimate leaf dimensions (Partelli et al., 2006), leaf areas using regression models (Moreira-Filho et al., 2007; Coelho-Filho et al., 2005) and those that use digital images and software for analysis. Methods involving the use of digital images can be destructive (if the leaves are removed from the plant) or non-destructive (if digital images of the leaves are captured without removal from the plant). Some software packages can be downloaded free of charge, but this does not apply to the leaf area meter (standard method), which entails importing equipment at high cost, which can be an insurmountable barrier to conducting research projects. The use of digital imaging and dedicated software has been documented for various crops, including acid lime (SIARCS, Coelho-Filho et al., 2005); coffee (SIARCS, Tavares-Júnior et al., 2002); nasturtium (Sigma Scan Pro v. 5.0, Lopes et al., 2007) and soybean (Spring, Adami et al., 2007).
Few studies have been conducted on forage crops, resulting in a gap in our knowledge of this field. Therefore, the aim of this study was to perform a comparison, using white and black oats, of two methods: (1) leaf areas measured based on digital images processed using ImageJ software, and (2) the standard method of estimating leaf area using a leaf area meter (LI-COR 3100).
Material and methods
The trial was carried out in the experimental greenhouse at the Pato Branco Campus of the Parana Federal Technological University (UTFPR, PB) in Pato Branco, Parana, Brazil. Two oat genotypes were used: white oat cultivar UTF Iguaçu and black oat cultivar Renascem. Seeds were sown manually on April 2, 2008, in 2 x 4-meter plots, at a density of 300 viable seeds per square meter. Leaf area was estimated in the Biochemistry and Plant Physiology laboratory at UTFPR-PB using the free software ImageJ and also using a leaf area meter (LI-COR 3100, 1996).
Five evaluations were carried out, the first at twenty-seven days after sowing and subsequently every seven days on the following dates: April 29 (beginning of tillering); May 6 (full tillering); May 13 (beginning of elongation); May 20 (stem elongation) and May 27 (end of elongation). The variable estimated by both methods was leaf area per plant. On each evaluation date, one plant was sampled from each experimental unit, giving a total of six plants per treatment.
After collecting the plants, the leaves were removed (destruction that can be avoided using ImageJ) and identified, placing the leaf blades on a sheet of A4 paper bearing a totally black rectangle 3 x 15 cm (45 cm2) used to calibrate the software. All leaves were then photographed using a digital camera (7.2-megapixel resolution), and the photos processed to obtain the area using ImageJ software. The average distance between camera and leaf was 50 cm.
Instructions for evaluating leaf area: (1) take a photograph of the leaf with the camera horizontal, the leaf totally flat on the worksurface and with a scale; (2) open the image in ImageJ: File > Open; remove superfluous objects: mage > Crop; set the scale: Analyze > Set Scale; (5) set the contrast: Image > Type > 8-Bite Image > Adjust > Threshold; (6) Compute the area: Analyze > Analyze Particles. After photographic processing, the leaves were evaluated using the leaf area meter (LI-COR LI 3100, 1996).
The experiment was carried out in a completely randomized design with six replications. Statistical analysis was carried out in Excel® using equations to compute the number of leaves evaluated (N), arithmetic mean, standard deviation (SD), value of the intercept and regression equation slope for full and reduced regression, the correlation coefficient (r) and the determination coefficient (R2). Tabular and computed values were also compared using the ‘t’- and ‘F’-tests and coefficient of variation, and the equation parameters tested at 1% error probability (Yamane, 1969).
Results and discussion
The total number of leaves evaluated for black oats was 224 and for white oats 258. There was homogeneity of variances for all evaluations of the two cultivars (F-test) (Yamane, 1969). In addition, the estimated means for leaf area did not differ for most evaluations (t-test). A significant difference was detected only in the first black oat and in the second white oat evaluations. This may have been due to an insufficient number of leaves (not very likely) or the natural roughness of the leaves (more likely, since the leaf area meter needs to be pressed against the leaf keeping it flat, whereas to take the photos their natural surface roughness is unaffected). On evaluating the entire set of leaves for both oat cultivars, no significant difference was found between the methods tested.
In terms of the coefficient of variation, despite the high values obtained, the magnitudes are similar when methods tested are compared for the same evaluation date. For the black oat cultivar, the coefficient of variation ranged from 44.3 to 71.6 (Table 1), and for the white oat cultivar from 31.8 to 79.2 (Table 2). These high values can be ascribed to the variability in the size of oat leaves under each of the methods tested.
Table 1 Leaf area estímate statistics (cm2) for black oats using a leaf area meter (LI-COR 3100) and ImageJ software*. UTFPR (2008).
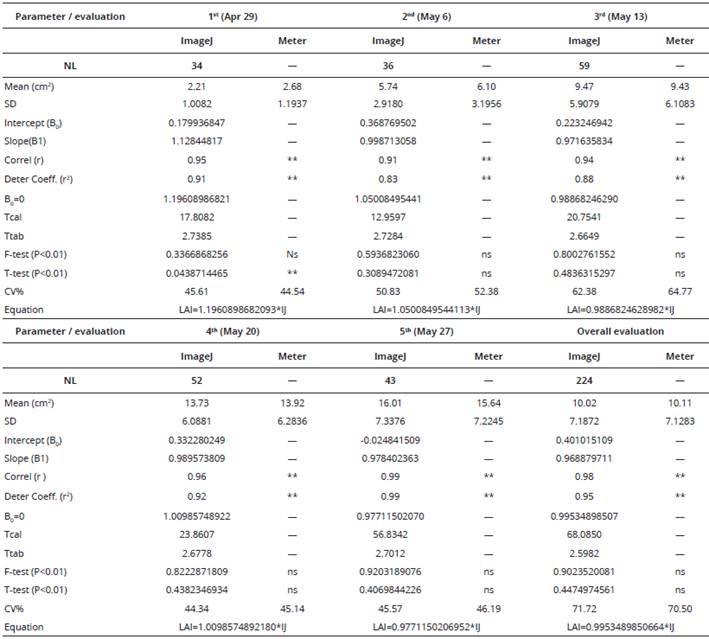
*number of leaves (NL), standard deviation (SD), mean, full equation intercept (Intercept (B0), Slope (B1), Pearson correlation coefficient (r), determination coefficient (r2), straight line slope coefficient where B0=0 (B0=0), T calculated (Tcal) and T tabulated (Ttab) statistical value, F- and t-test probability (P<0.01), percentage coefficient of variation (CV%) and reduced equation. ns and ** = not significant and significant at 1% probability.
Table 2 Leaf area estímate statistics (cm2) for white oats using a leaf area meter (LI-COR 3100) and ImageJ software*. UTFPR (2008).
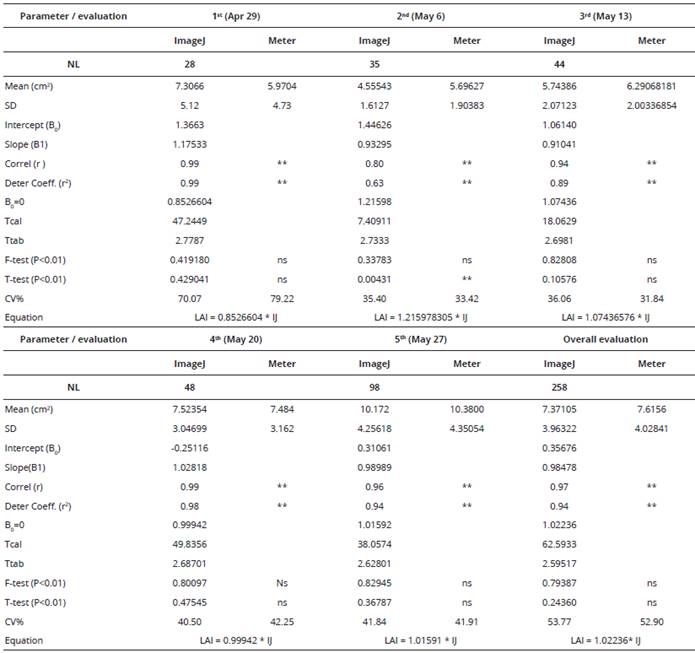
*number of leaves (NL), standard deviation (SD), mean, full equation intercept (Intercept (B0)), Slope (B1), Pearson correlation coefficient (r), determination coefficient (r2), straight line slope coefficient where B0=0 (B0=0), T calculated (Tcal) and T tabulated (Ttab) statistical value, F- and t-test probability (p<0.01), percentage coefficient of variation (CV%) and reduced equation.
ns and ** = not significant and significant at 1% probability.
Most of the values for the Pearson correlation coefficient and determination coefficient in the equation were higher than 0.90 (P < 0.01), denoting a good data fit for linear regression. Although some values ranged from 0.62 to 0.89, all were significant (Tables 1 and 2). On testing the parameter in the first-degree equation, it was found that the computed values were higher than the tabular values, denoting a significant fit for the parameter (P < 0.01). Non-rejection of the assumptions relating to the F- and t-tests indicates that the variances are homogeneous, even though the means of the values did not differ from one another, showing that both methods behave in the same way with regard to the estimated variances and means for the treatments.
The morphology of the leaves contributed in practice to the efficiency of the methods, since the leaves are relatively smooth and unifoliate, preventing superimposition and reducing estimation error problems. Leaf handling problems can impair the comparative accuracy of the estimates made, inducing errors and introducing differences not due inherently to the individual methods used. When using the leaf area meter, the operator should be aware of some operating errors. When passing the leaf through the Meter, it must not be folded or superimposed, which could lead to underestimating leaf area. The same applies to digital image capture; if photograph quality is poor, it should be retaken or even discarded. This can be caused by the angle of the photograph.
Some studies recommend using ImageJ in the agrarian sciences. This is the case in Gomes-Filho et al. (2006), in a study validating the scoring method for quantifying physiological blemishes in papaya. ImageJ can be used to speeds up fruit classification and standardization for commercial purposes. Sequential evaluations at different times can result in different states of roughness, inducing significant variability in the leaves, but this phenomenon was not observed for oat leaves.
Using the t-test, it was observed that the means of the leaf area estimates for both methods showed no significant differences, indicating that both methods provide valid leaf area estimates. Furthermore, it also indicates that morphological characteristics and leaf handling did not affect leaf area estimates. The leaf handling involved in using the leaf area meter on species with leaflets, such as soybean and common bean, requires care to avoid superimposition and consequent underestimation of leaf area. Using ImageJ software, this can be verified directly on the image which can be discarded if not deemed adequate. In addition, this method can be used non-destructively by capturing the digital image directly from the plant, without removing the leaves.
Lino et al. (2008) report that ImageJ is fairly widely used in medical practices and research because the software is versatile and can be accurately used in various operating systems (Windows, Linux and Mac/Os). ImageJ is also open source so that the classification system can be adapted to recognize shape, volume, color and in some cases impairment. These authors used ImageJ to classify limes and tomatoes, concluding that limes can be classified according to size and tomatoes according to color.
Estimating leaf area in common bean, Jesus- Junior et al. (2001) compared two methods: using the LAI2000 leaf area meter and measuring the leaf’s central axis. The correlation between the two methods was found to be higher than 0.97. Comparing this to our findings, the correlation and determination coefficients were, for the most part, higher than 0.90 and all results were significant at 1% error probability. Comparing non-destructive (alternative) methods with ImageJ software as an alternativa method for estimating leaf area in oats destructive (conventional) methods for estimating leaf area, Tewolde et al. (2005) found the correlation between the two methods to be higher than 0.66.
The results in Figures 1 and 2 show that ImageJ produced results similar to those obtained using the leaf area meter. Lino et al. (2008) reported that the accuracy obtained using electronic systems was within one gram for fruit classification by weight and one millimeter for classification by diameter. The authors concluded that the methods tested were influenced by the row spacing, since they involved placing the equipment on the soil between rows. For this reason, the authors recommended taking precautions to minimize variations in the values obtained compared to the conventional method.
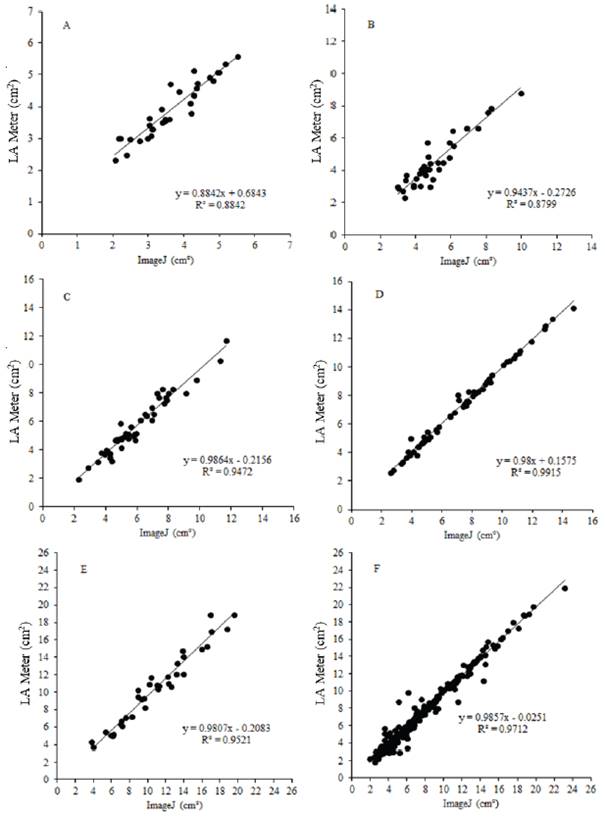
Figure 1 Regression analysis of black oat leaf area as a function of the five evaluation times: Apr 29/2008 (A); May 6/2008 (B); May 13/2008 (C); May 20/2008 (D); May 27/2008 (E) and grouping all leaf area data (F) for the Renascem cultivar estimated by the leaf area meter and IMAGEJ® software. UTFPR (2008)
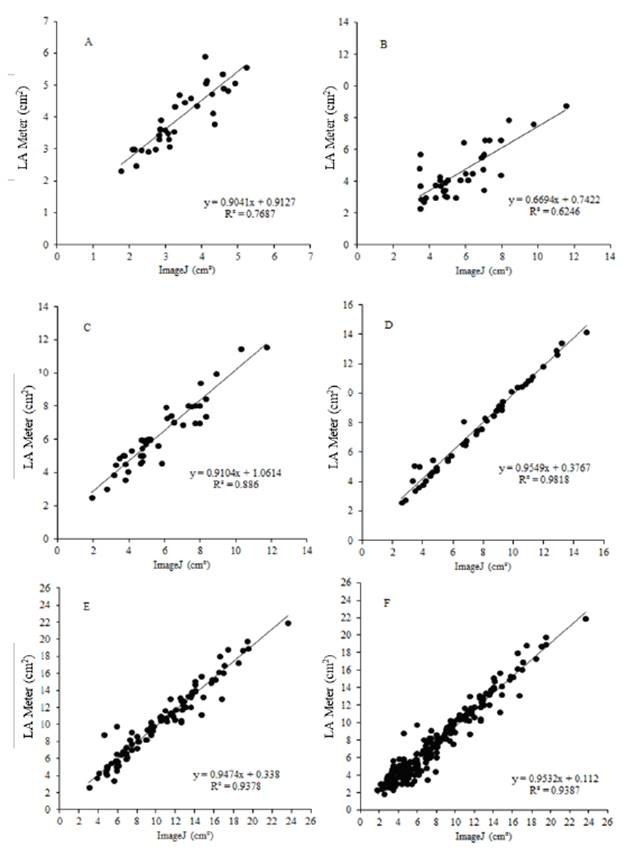
Figure 2 Regression analysis of oat leaf area as a function of the five evaluation times: Apr 29/2008 (A); May 6/2008 (B); May 13/2008 (C); May 20/2008 (D); May 27/2008 (E) and grouping all leaf area data (F) for the white oat cultivar UTF Iguaçú estimated by the leaf area meter and IMAGEJ® software. UTFPR (2008)
Comparing three methods for estimating leaf area in palisade grass, Sbrissia and Silva (2008) detected variations for height and time of year for the direct, destructive method, and did not recommend the use of a meter for collecting LAI data for simulation purposes. Furthermore, in this case the determination coefficient for the methods tested ranged from 0.22 to 0.859. An efficient alternative for estimating leaf area (using ImageJ) was implemented in cucumber and tomato (Blanco and Folegatti, 2003) and saved on both time and labor. Along similar lines, Ramirez and Zullo Jr. (2010) analyzed the leaf area index parameter in a coffee crop using Quickbird satellite orbital images and concluded that the use of high-resolution imaging is a promising method for determining LAI.
Advances in technology mean that digital imaging techniques can now be used for assessing plant leaf area. They are easy to use, fast, economical and non-destructive, and quality research can be conducted at lower cost, lower labor intensity and to an accuracy equivalent to methods involving the use of a leaf area meter. The data presented herein show that estimating leaf area in white and black oat crops can be done simply and produce quality results compatible with the research objectives.

