


 Inglês (pdf)
 Artigo em XML
 Referências do artigo
 Enviar este artigo por email
 Citado por SciELO
  Citado por Google
  Similares em
SciELO
Similares em
SciELO  Similares em Google
 Permalink
Introduction
The domestic even-toed ungulates have played pivotal roles for human beings in different perspectives such as the source of meat, milk, fibre production, beasts of burden for transport in agricultural/rural oriented community, even religious gods and goddesses since the very early times of the civilized World, Nowadays, some tame even-toed ungulates are now employed as animal models in biomedical studies to genetically consider the foundation of intricate characteristics (Barazandeh et al,, 2019), to produce transgenic peptide drugs and to generate some particular kind of antibody presenting peculiar benefits in disparate medicinal and biotechnological utilizations (Barazandeh et al,, 2016).
One of the most important domestic even- toed ungulates is the dromedary, Domestication of dromedaries occurred nearly 3000 years ago and are most abundant in the dry climate of Africa, particularly in the barren lowlands of Eastern Africa (Burger, 2016), Almost 150,000 dromedaries exist in the desert areas (South and Central) of Irán; this is 0,56% of the world dromedary population and 3,8% of the Asian dromedary population (Barazandeh et al,, 2019), Various technological reportages illustrate the merit of dromedary adapting to the ecological status of dry and semidry areas (Barazandeh et al,, 2019), In these poor regions, this animal can have not only good performance but also can help to develop the ecosystem, Dromedaries are fine meat producers especially in regions where the performance of other animals is noxiously affected by the climate (Barazandeh et al,, 2016), Because of these capabilities, dromedary plays a momentous socio-economical role in the agriculture and tribal systems of dry and semidry areas of the tropical countries in Asia and Africa (Meymandi et al,, 2015).
Due to the arid conditions prevailing in the geography of Iran and the impossibility of breeding other animals in desertic climate, dromedaries are important livestock to farmers in rural areas, a main supply of animal protein (Kadim et al,, 2008), In Kerman, more than 11000 dromedaries (Meymandi et al,, 2015) are bred (Figure 1), Due to the small geographical distance among populations of Kerman province, gene flow is feasible.
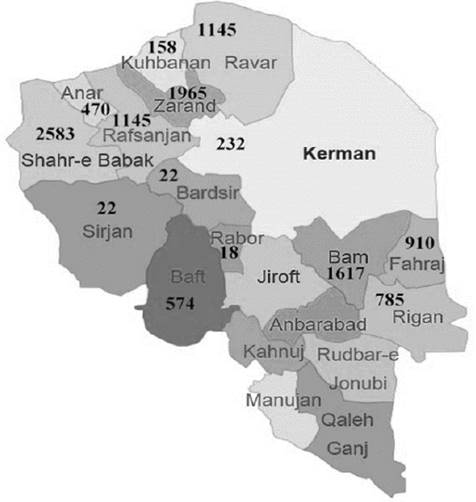
Figure 1 Dispersión map of dromedaries in different cities of Kerman province. Numbers show dromedaries in each city.
Estimating genetic parameters is the headmost step towards administrating the genetic resources for their conservation and tolerable usage (Ebrahimi et al,, 2015), The agglomeration of inbreeding and the detriment of genetic diversity is an issue for livestock conservation (Mohammadabadi et al,, 2010a), Inbreeding enhances the danger to surrogate a rare recessive genetic disease and diminish the population fitness (Mohammadi et al,, 2009), Populations with premier genetic diversity have more opportunity to survive under new environmental compression and stress (Markert et al,, 2010), Therewith, plenary exploration of the breed specifications is necessary for the impressive management of genetic resources in farm animal (Norouzy et al,, 2005).
The utilization of molecular genetics has significant benefits (Shamsalddini et al,, 2016) like the genotyping of individuals for particular genetic loci (Javanmard et al,, 2008; Mousavizadeh et al,, 2009), Short tándem repeats known as microsatellites are broadly applied as molecular markers of selection for genetic researches for their high grade of polymorphism because of the existence of different and various alleles at each locus, simple identification, and dispensation throughout the genome (Mohammadabadi et al,, 2010b; Mohammadifar et al,, 2009), Nowadays, microsatellite markers are a useful tool for studying genetic diversity within and between populations or mapping quantitative trait loci mappings.
Microsatellite markers have been widely applied in domestic animal species, as cattle, sheep, goat and dromedary (Askari et al,, 2008; Ghasemi et al,, 2010; Meymandi et al,, 2015; Vajed Ebrahimi et al,, 2016), It has been demonstrated that microsatellites in dromedaries are extremely polymorphous, and adequate informative markers exist to perform diversity investigation (Mburu et al,, 2003; Schuiz et al,, 2010), Microsatellites are reiterative DNA sequences that are arbitrarily dispensed overall eukaryotic genomes. Their superfluity in the genome, great levels of polymorphism, Mendelian manner of inheritance and high-throughput potency enable microsatellites markers to be an advantageous gadget for recognition of inherited illness, filiation testing, forensic medicine, genetic diversity and population peruses in plenty species (Zajc et al., 1997). They are also significant genetic gadgets for animal breeding and quantitative trait locus analysis. The obligation of resolving the genetic associations of domestic dromedary breeds is so much formidable because of diverse provenances and considerable gene flow between breeds.
The study of native breeds is essential for the conservation of genetic resources in livestock. Unfortunately, dromedaries in the north of Kerman province were not studied using molecular markers, especially microsatellites until now, hence the aim of this study, was to investigate the molecular characterization of dromedaries in the north of Kerman province, Iran, using eight microsatellite markers.
Materials and methods
A total of 81 blood samples were collected randomly from five dromedary populations, namely, Shahr-e Babak (n=21), Nogh (n=11), Shams Abad (n=28), Shamshir Abad (n=14) and Sahra-e Jahad (n=7). The number of samples was selected based on the availability of animals for sampling. These dromedaries have extensive biodiversity and are distributed in different geographical regions of Kerman province. DNA was extracted using the salting-out method (Abadi et al., 2009).
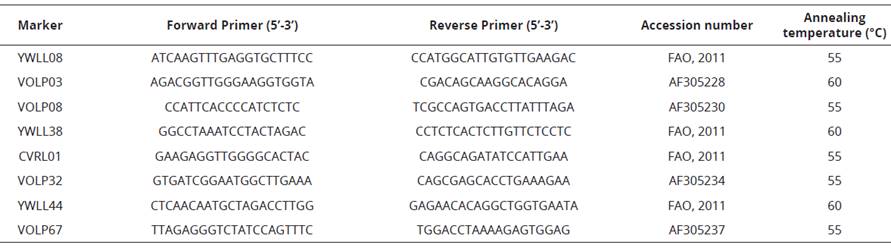
A total of eight microsatellite autosomal markers from unconserved genome were used in this study (Table 1). Microsatellite markers were chosen based on polymorphic information content (PIC) and heterozygosis values reported in earlier studies (Lang et al., 1996; Obreque et al., 1998). The PCR reaction was accomplished in a total volume of 25 mL using 30 ng of genomic DNA, 0.37 mL MgCl2, 0.3 mL dNTPs, 1.5 mL PCR Buffer (10x), 1 mL of each primer and 0.16 mL of Taq polymerase. Negative controls were included. The amplification was carried out using a denaturation at 95 °C for 5 min followed by 35 cycles of denaturation at 95 °C for 30 s, annealing (55-60 °C) for 30 s, extension at 72 °C for 30 s and a final extension for 5 min at 72 °C. Then, 4 mL of the amplified product was mixed with 1 volume of formamide loading dye and denatured at 95 °C for 5 min and separated on an 8% polyacrylamide gel for 14 hours. Gels were silver stained and the bands were visually observed on the gels.
Discrimination of the microsatellite alleles was determined by comparison with an adjacent DNA ladder. The size of alleles, allele types and kind of genotypes were determined by Excel software. The Pop-Gene32 Software (Yeh et al., 1999) was used for estimating Hardy-Weinberg equilibrium, allele frequencies, the mean number of alleles per locus, observed heterozygosis (Ho), expected heterozygosis (He), Nm (number of migrants per generation) and Shannon index for each locus (Yeh et al., 1999). The Nm (gene flow) estimated from Fst = 0.25(1 - Fst)/Fst. A Shannon index criterion is very useful for the measurement of genetic diversity of the loci that have high polymorphism, like microsatellite marker. The AMOVA (Analysis of Molecular Variance) was calculated by the GeneAlex 6.41 (Peakall and Smouse, 2006).
As sample sizes are often uneven across combinations of population and locus, the number of alleles sampled to determine allelic richness (AR) is standardized to the smallest number of individuals sampled across all combinations of locus and population multiplied by the ploidy level of the species. As a component of genetic diversity, allelic richness is also important in conservation genetics. In this study, the AR was analyzed using the FSTAT software (Goudet, 1995).
The genetic relationships among dromedaries in the north of Kerman province were analysed using three different approaches based on allele frequencies at microsatellite loci: pair-wise FST was used to establish genetic distances among the breeds under genetic drift, which is the main factor promoting genetic differentiation between the breeds; the hierarchical F statistics were used to estimate gene flow (Slatkin and Barton 1989), and the genetic distance between the breeds was calculated according to Nei’s genetic distance (Nei 1972).
The former was analysed using the GeneAlex program, version 6,41 and the latter relationships were calculated by Pop-Gene32 Software, Phylogenetic trees were constructed using neighbour-joining (NJ) clustering from Nei’s distance method, The principal component analysis (PCA) was performed using the prcomp function in R software (R Core Team, 2011).
The PCA for the Iranian dromedaries data set was calculated on GRM (Genomic Relationship Matrix), Similarities among individuals were assessed using the GRM, following van Raden’s (2008) method, This GRM was also subsequently fed to the R function “hclust” for clustering purposes, At each replication of the clustering algorithm, the two most similar individuals were joined, and distances between these newly merged individuals and each of the old individuals were computed by UPGMA (unweighted pair group method with arithmetic mean) method (Sneath and Sokal, 1973) implemented in R language (R Core Team, 2014).
Results
The allele and genotype frequencies of eight microsatellite loci were determined in five Kerman native camel populations, The main characteristics and diversity parameter values from these microsatellites are presented in Table 2, A total of 78 alleles were detected among 81 studied animals, The markers for the entire population showed a very high number of alleles per marker, ranging from 4 (VOLP67) to 21 (CVRL01), The average alíele number of polymorphic loci was 9,7 allele per locus, The lowest and the highest effective alleles ranged from 3,11 (VOLP67) to 14,97 (CVRL01) among the populations, In all loci analysed, the greater proportion of expected heterozygotes (He) was detected at the CVRL01 locus (0,939) whereas the smallest was presented by the VOLP67 locus (0,683), The highest and lowest Shannon indices were observed in the CVRL01 locus (2,82) and VOLP67 locus (1,24), respectively, These values seem quite reasonable in comparison to the allele numbers of these two loci.
Table 2 The criteria diversity of all animals.
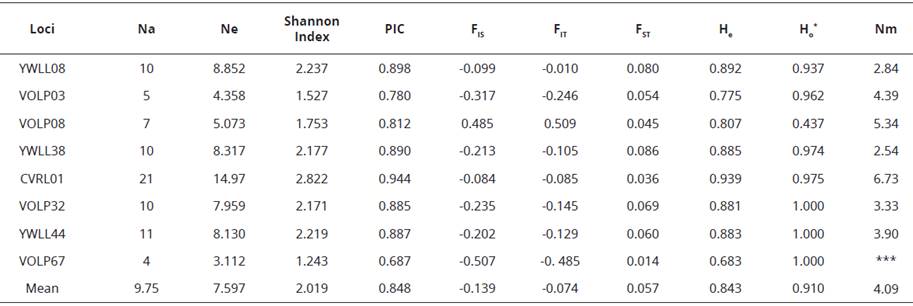
*All breeds examined, Na: Observed number of alleles; Ne: Effective number of alleles, PIC: Polymorphic Information Content, He: Expected Heterozygosis, Ho: Observed Heterozygosis, Nm: The number of migrants per generation (gene flow). FIS (inbreeding coefficient) is the proportion of the variance in the subpopulation contained in an individual, FIT is the inbreeding coefficient of an individual (I) relative to the total (T) population, and FST is the proportion of the total genetic variance contained in a subpopulation (the S subscript) relative to the total genetic variance (the T subscript).
Table 3 depicts various genetic parameters estimated for five populations based on 8 polymorphic markers, The results indicated that the six loci in the Sahra-e Jahad population, two loci in the Shamshir Abad population, two loci in the Shahr-e Babak population and four loci in the Nogh population were not in H-W equilibrium (p<0,05), For expected heterozygosity, the minimum value of 0,778 was observed in the Sahra-e Jahad and the máximum of 0,847 in the Nogh population.
Table 3 Sample size, allele diversity (the mean number of observed alleles per locus), allelic richness (AR), observed heterozygosity (Ho), expected heterozygosity (He) and P values of populations across all loci.
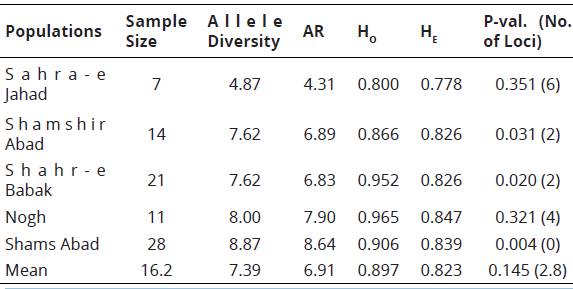
aNumber of locus showing departure from Hardy-Weinberg equilibrium (P<0.05).
The mean observed heterozygosity (Ho) for Sahra-e Jahad (0,8), Shamshir Abad (0,866), Shahr-e Babak (0,952), Nogh (0,965) and Shams Abad (0,906) was more than the mean expected heterozygosity (He), The number of alleles per polymorphic locus ranged from 3 to 9 in the Sahra-e Jahad population, 4 to 16 in the Shamshir Abad population, 4 to 11 in the Shahr-e Babak population, 4 to 13 in the Nogh population and 4 to 18 in Shams Abad population, The allelic richness (AR) for each population ranged from 4,31 (Sahra-e Jahad) to 8,64 (Shams Abad), with a mean of 6,91.
The mean pairwise FgT estimates, Nei’s genetic distances and Nm valúes between five populations are summarized in Table 4. All pairwise FgT valúes were significantly positive (P<0.01), and ranged from 0.016 (ghahr-e Babak and ghams Abad) to 0.37 (ghamshir Abad and gahra-e Jahad). The number of migrants per generation (Nm) varied from 6.49 for the ghamshir Abad and gahra-e Jahad to 15.8 for the ghahr-e Babak and ghams Abad populations, indicating high gene flow between these two populations. Recent droughts and changes in the environment have led to intensify population decline and to increase the rate of inbreeding between ghahr-e Babak and ghams Abad populations. The largest Nei’s distance (0.568) was between ghahr-e Babak and gahra-e Jahad populations and the lowest genetic distance (0.114) was observed between the Nogh and ghams Abad populations (Figure 2; Table 4).
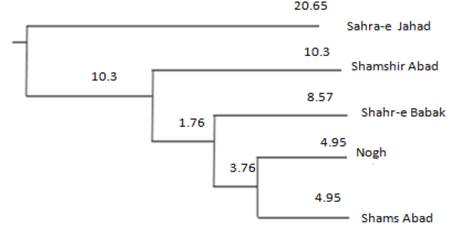
Figure 2 The neighbour joining (NJ) tree of Nei's genetic distance representing genetic relationships of five populations of dromedaries in north of Kerman. Values along the branches represent bootstrap support in percent from 1000 replications of resample loci.
Table 4 Nei's genetic distance, mean F^ estimates, and migrants per generation values between each pair of 5 Kerman's dromedary populations.
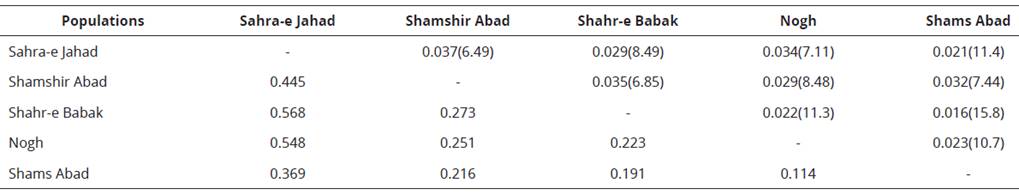
* Above the diagonal, FST values and Nm (between bracket) values; below the diagonal, genetic distance values are given.
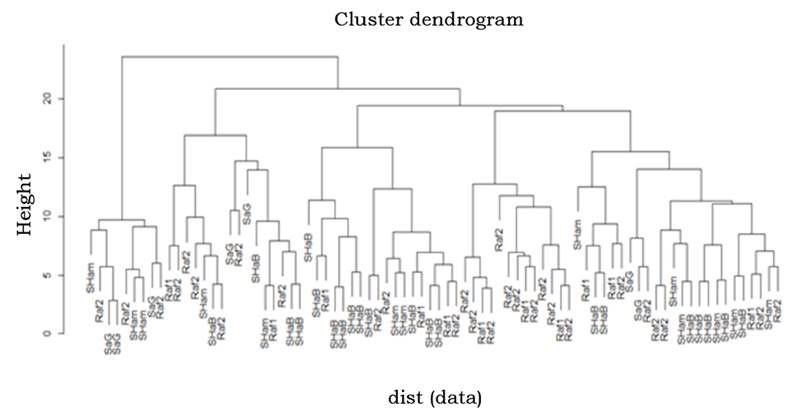
The relative placement of breeds in the NJ tree showed that Nogh and ghams Abad shared a common node, and the position of ghahr-e Babak was closer to these two populations, while gahra-e Jahad dromedaries formed a distinct group and joined the last in the dendrogram. This result was in line with the close geographical distribution of these populations. The hierarchical clustering and principal component analysis could well reflect discrete genetic characteristics among the dromedaries of Kerman and agreed with the NJ graph (Figure 3 and 4). Principal component analysis indicated that all samples could be mainly regrouped into three main clusters and the most suitable number of genetic groups in the dataset was explained. Results of the hierarchical clustering of individuals are in the dendrogram shown in Figure 4. Cluster analysis revealed a typical triangular relationship among the five populations from three continents, with the first dimension grouped with the ghahr-e Babak, Nogh and ghams Abad populations, and the second dimension included ghamshir Abab population and finally, the third cluster involved gahra-e Jahad population. The separated clusters indicated that the chosen samples were powerful to explore the genomic characteristics of these five populations.
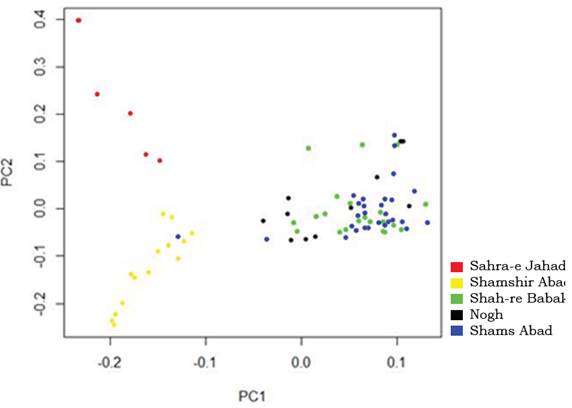
Figure 3 The individuáis clustering base on principal components analysis. The proportion of total variation explained by first and second principal components, were 61.38 and 21.9 %, respectively.
Discussion
Genetic diversity and population structure of 81 dromedaries in the north of Kerman province representing five different phenotypes (gahra-e Jahad, ghamshir Abad, ghahr-e Babak, Nogh and ghams Abad) were assessed, aiming to detect potential accordance between population genetic structure and breeding strategies. The results have shown the presence of high diversity within each population, expressed in the mean values of 9.75 alleles per locus and 0.843 for expected heterozygosis (Table 2).
Mahmoud et al. (2013) studied the genetic polymorphism in the Majaheem population of dromedaries in the Kingdom of gaudi Arabia using sixteen microsatellite markers and reported that the mean expected heterozygosity is 0.652, the mean observed heterozygosity is 0.665, and the Polymorphic Information Content (PIC) valúes range from 0,340 to 0,768 with a mean of 0,590, Mburu et al, (2003) assessing Kenyan dromedary breeds (Somali, Turkana, Rendille, Gabbra) and dromedary from Pakistán and the Arabian Peninsula (Saudi Arabia, United Arab Emirates) úsing 14 microsatellite markers concluded that expected heterozygosity ranges from 0,51 to 0,61, These results are consistent with the results of the present study, Based on the Shannon index PIC and heterozygosis, VOLP67 and CVRL01 loci indicated the least and the most diverse, respectively, These amounts seem quite reasonable in comparison to the allele numbers of these two loci.
Polymorphic information content (PIC) is a measure of the informativeness of the marker, ranging from 0 to 1 and a locus with a PIC value close to 1 has many alleles that are desirable for genetic diversity studies, Universally the markers demonstrate PIC values lower than 0,5, which connote a mildly informative locus has 0.5>PIC>0.25 and the rest of them are highly informative and for them PIC >0,5 (Botstein et al, 1980), The markers that have been used in studies showed genetic variability and indicate the usefulness of PIC markers in future studies, However, the CVRL01 marker showed high polymorphism in all populations indicating a great potential for parental testing and population-based genetic studies.
At individual loci, Fis estimates overall dromedary populations ranged between -0,507 (the locus VOLP67) to 0,485 (the locus VOLP08), In a study, the within-population inbreeding estimates (Fis) 0,173 for Kachchhi to 0,417 for Kharai, which represents the nonrandom union of gametes and deviation from Hardy-Weinberg equilibrium. The Fst values for each locus are very close and levels of apparent breed differentiation were moderate, Multilocus Fst values indicate that approximately 5,7% of the total genetic variation was explained by population differences, with the remaining 94,3% corresponding to differences among individuals.
The heterozygosity level of a microsatellite marker varies from species to species and sometimes among different breeds of the same species (Mburu et al., 2003; Vijh et al., 2007; Guichoux et al., 2011; Mahmoud et al., 2019).
All populations, except the Shams Abad, showed a significant deviation from HWE at more than one locus. For Shahr-e Babak, Shamshir Abad, Nogh and Sahra-e Jahad populations, HE values were generally lower than the HO values, indicating deviations from the Hardy- Weinberg equilibrium. According to the results of this study, increased heterozygosity is one of the main factors of deviation from HWE. In addition, uncontrolled mating, lack of control in the exchange of genetic material in different areas and the limited number of samples could also affect the deviation of the populations from HWE. Deviation from HWE is being observed in some dromedary populations (Mahmoud et al., 2013; Vijh et al., 2007). In addition, grater genetic homogeneity and bottlenecks associated with calamitous events such as economic depression could be observed at a certain degree of non- conformity to Hardy-Weinberg equilibrium as expected (Zajc et al., 1997).
The AMOVA analysis detected that from total genetic diversity; only 6% were due to differentiation among populations, while the remaining 94% corresponded to differences among individuáis within each population. However, for this level of genetic differentiation (6%), some gene flow among populations studied still seems to exist. The máximum and minimum of inter-population diversity, which is calculated as average intended heterozygosis in all loci for every population, were obtained from Nogh (0.84) and Sahra-e Jahad (0.77) populations, respectively. Genetic diversity could be originated from various production systems and ecological conditions in which dromedaries in the north of Kerman have been historically preserved.
Animals from the Shams Abad population exhibited higher values for allele diversity and allelic richness than other populations. The Shams Abad population had a lower inbreeding coefficient and superior results of genetic diversity and richness. The Sahra-e Jahad showed the lowest average allele number, allelic richness as well as the lowest heterozygosis, showing a considerable reduction in inter-population variation and extensive inbreeding. In addition, the low diversity in this population could be due to the reduction of the breed in its native region and the small sample size.
Regardless of the low population structure, dromedaries in the north of Kerman corridor exhibit high genetic diversity (HE = 0.823) comparable to some extent to that of Saudi Arabian (HE=0.652; (Mahmoud et al., 2013)), southern African (HE=0.604; (Nolte et al., 2005)) and Pakistani (hE=0.640; (Schulz et al., 2010)) dromedaries.
Four populations of Saudi Arabian dromedaries displayed a considerable amount of genetic variation mainly due to a high level of crossbreeding (Mahmoud et al,, 2013), Abdussamad et al, (2015) studying five Nigeria dromedary populations (75 samples), found a high genetic diversity, which could be explained by continuous gene flow with other populations, Adequate genetic variation within a population is necessary to avoid inbreeding depression and its consequences, The frequency of a spontaneous mutation or recessive trait will be relatively high as the degree of homozygosis increases.
Populations with high genetic variation are more likely to maintain genes and characteristics that are recessive but can be useful if the selection pressure changes, Regarding the Nei’s distance values between population pairs, the lowest was obtained between the Nogh and Shams Abad populations (0,114) and the máximum between the Shahr-e Babak and Sahra-e Jahad populations (0,568), It should be noted that the geographical locations of the dromedaries in Shahr-e Babak and Sahra-e Jahad populations are far from each other and migration among populations is less likely to occur, Egyptian dromedaries (four breeds) showed low genetic distances due to the fact that they originated from a common ancestor (Mahrous et al,, 2011).
The proportions of the total variation, which have been explained by the first and second principal components, were equal to 61,38 and 21,9 % respectively, The results derived from the PCA were in agreement with the NJ graph and hierarchical clustering of individuals, A similarity of geographical distribution was in accordance with founded genetic relationships in this study, Individuals of three populations of Nogh, Shams Abad and Shahr-e Babak have evidently grouped in the same cluster, This genetic similarity has good accordance with geographical distribution and three populations have been bred in the North-West areas of Kerman (Figure 1), Therefore, these populations can also participate in similar conservation strategy, Since the adaptability of dromedaries in the north of Kerman province with their environments is the product of long-term selection pressures and cannot be attributed to recent times, admixed dromedary should also be considered in the conservation strategies, An appropriate conservation strategy should be able to maintain maximum genetic diversity in the global gene pool while maintaining within breed diversity to reduce inbreeding and preserve genetically differentiated groups (Talle et al,, 2005), In general, close genetic composition and similar environments indicate that similar and related conservation programs can be applied for these populations, However, control of crossbreeding, breeding stations development and improvement of recording system are in situ strategies to conserve these populations.
Conclusions
Understanding the relationships among and within populations is an important step to find relevant conservation strategies, The results derived from pair-wise FST, genetic distance, NJ tree, hclust and PCA were used to explore the genetic closeness among the populations, The results indicated that in the first level of clustering, Shahr-e Babak, Nogh and Shams Abad populations shared the same cluster, On the other hand, Shamshir Abad and Sahra-e Jahad populations have created distinct groups, A similarity of geographical distribution was in good accordance with founded genetic relationships in this study, The data analysis revealed that there is a good amount of heterozygosis in the studied populations, which can be exploited by developing conservation strategies and suitable breeding plans, Due to the small number of dromedaries, efforts need to be made to preserve the germplasm by declaring them as heritage animals.

