


 English (pdf)
 Article in xml format
 Article references
 Send this article by e-mail
 Cited by SciELO
  Cited by Google
  Similars in
SciELO
Similars in
SciELO  Similars in Google
 Permalink
Introduction
Stevia (Stevia rebaudiana Bertoni) is an herbaceous plant and belongs to the Asteraceae (Compositae) family, native of South America. It grows wild as a perennial shrub in the subtropical area of the Upper Parana (Paraguay) and adjacent areas of Brazil, at altitudes of 200-500 m above sea level (Moraes et al., 2013), in sandy soils near streams on the edges of marshland, acid infertile sand or muck soils (Benhmimou et al. 2018). Guarani indians already used it since pre- Columbian times as a sweetener and medicine, but it wasn’t until the 19th century that the rest of the world also discovered its benefits (Lemus-Mondaca et al., 2012). Stevia is gaining attention due to its sweetening power. There is an increasing demand for natural substitute sweeteners (Hastoy et al., 2019). Steviol glycosides (SGs) are the chemical compounds responsible for the sweet taste. SGs are mainly accumulated in leaves (Serfaty et al., 2013), and quality depends on its SGs content and composition. Stevioside (Stev) and rebaudioside A (Reb A) are the most important SGs (Ceunen & Geuns, 2013). Stev is usually the major sweetener (4 % to 13 %) followed by Reb A (2 % to 4 %), expressed as a percentage of dry weight leaf (dWL). Stev has bitter aftertaste, while Reb A is without bitterness and sweetness is 1.6-1.8 times higher than Stev (Montoro et al., 2013). The Reb A to Stev ratio, which is usually about 0.5 or less in wild populations, is the accepted measure of sweetness quality (Pal et al., 2015). SGs concentration in stevia depends on different variables, such as the cultivar, plant age, development stage, growing conditions and agronomic practices (Hastoy et al., 2019; Pal et al., 2015). Stevia can be grown well in a wide range of conditions. In areas where frosts are sharp and frequent, it is cultivated as an annual crop. By now, the crop has been introduced to many countries. China is the largest stevia grower in the world (Hastoy et al., 2019).
Very little is known about the nutrient requirements of stevia. Knowledge of nutrient uptake is extremely important in order to plan fertilisation and to match nutrient availability with crop requirements (Angelini & Tavarini 2014). Nitrogen (N), phosphorus (P) and potassium (K) are the most relevant macronutrients for plant growth and development. N is usually considered the most important limiting factor, after water, for crop yields. It is important to know not only the total N requirement, but also the dynamics of N uptake, in order to achieve the maximum N use efficiency. Excess N can reduce yield and quality of crop produce, increase inputs and cause groundwater contamination (Castellanos et al. 2012). Calcium (Ca), magnesium (Mg), and sulfur (S) are essential plant nutrients. They are called secondary nutrients because plants require them in smaller quantities than N, P and K. Nutrient uptake and partitioning are strongly influenced by the development stages of plants.
Stevia is still relatively unknown in Europe, where it is mainly grown in the Mediterranean basin in areas close to the coast, under mild temperatures. Agronomic studies on stevia conducted in Europe are scarce. In inland areas of the Mediterranean basin, where frost can occur during the winter, previous studies are almost scarce. Therefore, it is necessary to study some essential aspects of its cultivation.
Thus, the main objective of this research was to evaluate yield, quality, and nutrient requirements of stevia under continental Mediterranean climatic conditions, according to planting density and harvest regime.
Materials and methods
Location, climate and soil characteristics of the experimental site
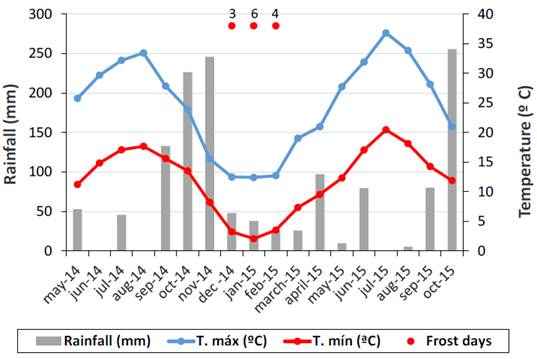
The experiment was conducted at a farm located at the middle west of Spain (40°10’15’’ N and 5° 39’72’’ W; altitude 96 m above sea level. Data on monthly air temperatures and rainfall registered during the experiment are reported in Figure 1, and were obtained from the weather station located at the experimental farm. The soil texture was sandy loam (4.3 % clay, 26.2 % silt, 69.5 % sand), with low electrical conductivity (0.027 mmhos cm-2) and acidic in reaction (pH 5.86). The contents of organic matter (2.27 %) and available P (15.0 ppm), K (234.6 ppm), Ca (601.1 ppm) and Mg (121.0 ppm) were adequate, while the content of available nitrogen (<10 ppm) was low.
Layouts of experiments, plant material and crop management
The field experiment was carried out during two growing seasons (2014 and 2015). Three-months old seedlings obtained from Criolla variety were transplanted into the field at the end of May 2014. The experimental design consisted of a split-plot with three replications, where the planting density (PD) was the main plot, formed by six rows 0.75 m apart and 10 m long. Three PDs were studied (5.0, 7.5 and 10 plants m-2). In 2014, the subplot was the harvest date (HD). In 2014, sampling was carried out along the vegetative cycle to evaluate the biomass yield and partitioning, the SGs content and composition in leaves, and the nutrient content and accumulation according to PD and HD. On each HD, six consecutive plants, different from those previously sampled, were randomly collected from every plot. All plants were mowed at the end of the growing season. In 2015, each main plot was divided into three subplots, corresponding to three different harvest regimes (HRs), designed taking into account the results of 2014: one cut before flowering at 115 days after sprouting (HR1); two cuts at 90 days interval (HR„); 3 cuts at 60 days interval (HR3). Plants were mowed at 10 cm above the ground. Harvested plants were transported to the laboratory, where leaves were separated from plants by hand, dried at 103 °C for three days, weighed and grinded through a 1 mm mesh sieve. Total biomass refers to the aboveground biomass. The harvest index (HI) was calculated by dividing leaf yield with total biomass. The crop was fertilised every year at the rate of 200, 100 and 150 kg ha-1 of N, P^, K2O, respectively. The complete doses of P and K and a half of N were applied at the beginning of the vegetative period. The rest of the N was incorporated as top dressing in two equal splits at 45 and 90 days after transplanting (DAP) or sprouting (DAS) in 2014 and 2015, respectively. Supplementary irrigation was applied through furrow method during the dry season to maintain the soil under non limiting water conditions. Weeds were eliminated by hand as often as necessary. Data were expressed on dried weight (dW) basis.
Analysis of steviol glycosides
Concentrations of SGs and their composition were determined by LC- MS (310-MS TQ, Agilent) using a Nucleodur 100-3 NH2-RP column (250 mm x 2.0 mm) (from Macherey & Nagel). Mobile phase consisted of a mixture of acetonitrile/water (80:20, v/v), pH 5.0 adjusted with acetic acid. For glycosides extraction, around 0.5 g of dried leaf, ground through 1 mm sieve, were placed in 250 mL Erlenmeyer flasks filled with 50 mL of aqueous EtOH 70 % (w/w), shaking for 30 min at 70 °C, cooled to room temperature and adjusted to 100 mL with pure water. Before injection, solutions were diluted 1/200 with pure water, homogenized and filtered through a 0.2 |im polyethersulfone syringe filter. Quantification was performed using a standard of pure stevioside and rebaudioside A (LGC Standards, Wesel, Germany).
Determination of nutrient content and uptake
An elemental analyser (Leco TruSpec CHNS) was used to determine the concentration of N and S, based on Dumas method. P, K, Ca, and Mg were analysed by inductively coupled plasma-optical emission spectrometry. A microwave digestion system was used to digest the samples for the analysis. Data were expressed on dried weight (dW) basis. Total biomass refers to the aboveground biomass. The nutrient uptake (NU) was calculated by multiplying nutrient concentration by biomass yield (kg ha-1). The NU referred to kilograms per tonne of leaf (NUL) was determined by dividing the NU (kg ha-1) by the leaf yield (t ha-1). The nutrient harvest index (NHI) was calculated by dividing the leaf nutrient uptake by the total biomass uptake, in order to evaluate the mineral nutrient partitioning.
Results
Stevia growth and SGs accumulation during the vegetative period
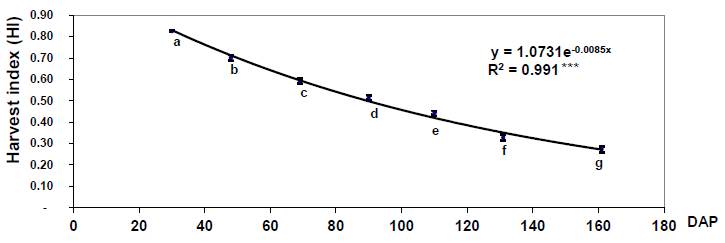
In the first year, biomass and SGs yields were not significantly influenced by the PD during the vegetative stage. Biomass accumulation and partitioning during the vegetative stage are shown in Figure 2. The average leaf yield increased significantly until at 110 DAP. It was 3.300 kg ha-1. On that date, higher leaf yield was achieved at higher PD, although without significant differences. Indeed, the leaf yield achieved by PD3 was 7.5 % and 14.6 % higher than the obtained by PD2 and PD respectively. From 110 DAP onwards, the leaf yield decreased slightly. The total biomass yield rose up until 161 DAP, because the stems yield continued to increase after 110 DAP, although at a slower rate. The HI varied significantly along the vegetative period, showing an exponential decrease (Figure 3). SGs concentration and yield were not influenced by the PD either (Figure 4). SGs concentration decreased sharply from 69 DAP (11.4 %) to 110 DAP (8.3 %). The SGs yield increased significantly until 130 DAP, reaching 291 kg ha-1. The Reb A to Stev ratio was around 0.35, except from 110 to 130 DAP, in which it increased until 0.71 (data not presented).
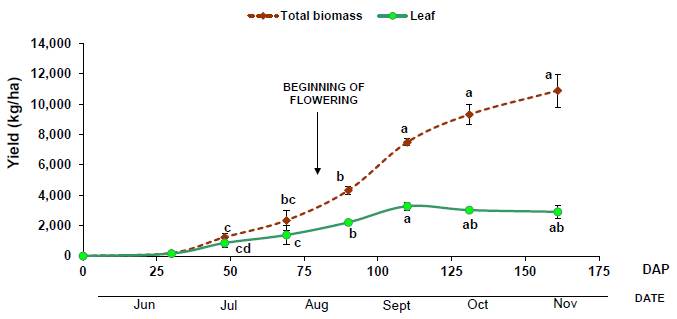
Figure 2. Biomass accumulation and partitioning during the vegetative stage in 2014. PD was not considered due to the lack of significant differences; average values are represented. Vertical bars represent standard error of the mean (±). Different letters mean statistically significant difference for P < 0.05
PD was not considered due to the lack of significant differences; average values are represented. Vertical bars represent standard error of the mean (±). Different letters mean significant statistically difference for P < 0.05.
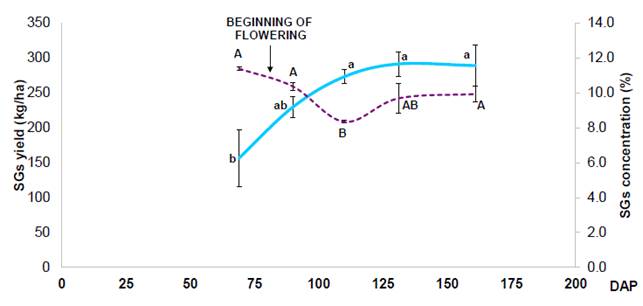
Figure 4. SGs concentration (...) and yieLd (-) during 2014. PD was not taken into account due to the Lack of significant differences; average vaLues are represented. Vertical bars represent standard error of the mean (±). Different Lowercase Letters and capitaL Letters mean significant differences of SG yield and content, respectively, between harvest dates for P < 0.05. Data prior to 69 DAP were not considered due to the low Leaf and SGs yields in those earLy dates.
Dynamics of nutrient content and accumulation
Results of dynamics of nutrient concentration and accumulation during the vegetative period are shown in Figures 5 and 6, respectively. The N concentration was always higher in leaves than in stems, and it decreased significantly over time both in leaves and stems. The P concentration was quite similar in leaves and stems, with a relatively narrow range, although significant differences were found over time. The K concentration in leaves during the vegetative period was quite stable. However, in stems, the K concentration decreased strongly from 69 DAP to 131 DAP, stabilizing thereafter. The K concentration was higher in stems than in leaves until 110 DAP, being lower later. In leaves, the Ca concentration did not vary significantly over time. In contrast, significant differences over time were found in stems. Mg followed a similar trend than Ca. The S concentration in leaves and stems decreased significantly. The accumulation of N, Ca, Mg in the total biomass increased until 110 DAP, and continued to increase slightly after that date for P, K and S.
Yield and quality according to planting density and harvest regime
Biomass yield and partitioning and SGs content and composition in leaves of stevia according to planting density and harvest regime in 2015 are shown in Table 1. Both PD and HR had significant influence on yield and partitioning in 2015, but interactions were not significant. Higher yields (biomass and SGs) were obtained at higher PD. The lowest HI was achieved with PD3. Concentrations of SGs were similar for all PDs, around 11.0 %. Higher yields (biomass and SGs) were achieved with HR2, with a significantly lower HI. In HR2, the HI was higher in the first cut than in the second one. In HR3 the highest HI was achieved in the first cut, while the lowest one was reached in the last cut. The average SGs concentration was higher at lower number of cuts of the HR, being significant differences. The highest SGs concentration was reached with HRj (12.2 %). The Reb A to Stev ratio was 0.32, on average, without significant differences. The average leaf and SGs yields were 4.973 and 544 kg ha-1, respectively. Nevertheless, around 6.000 and 650 kg ha-1 were achieved with HR2 and PD3, respectively.
Table 1 Biomass yield and partitioning and SGs concentration and composition in leaves of stevia according to planting density and harvest regime in 2015
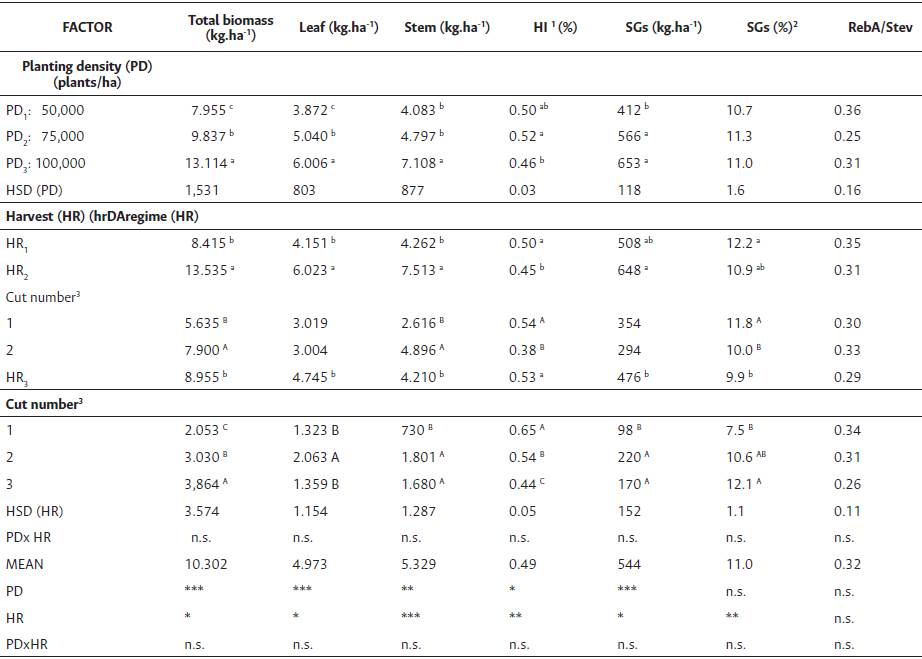
1HI: Harvest index = Leaf/Total biomass; 2Average value; 3Cut number factor was analysed separately for HR2 and HR3; n.s.: not significant; Different letters in the same column and for each factor mean statistically significant differences according Tukey´s test for P < 0.05. HSD: critical value for comparison. n.s.: not significant; significant at *p < 0.05;**p < 0.01; *** p < 0.001.
Nutrient content and uptake according to planting density and harvest regime
Results of nutrient concentration, uptake and partitioning are shown in Tables 2, 3, and 4, respectively. The nutrient content was influenced by HR, but not by PD. Interactions were not significant. N, Ca and Mg concentrations were higher in leaves than in stems. P, K and S concentrations were similar in leaves and stems. In leaves, the N content in HR2 and HR3 was significantly higher in the first cut. Tota2 nutrient uptake for each element (Table 3) was influenced by PD and HR, but interactions were not significant. NUs were higher at higher PD and with HR2. The average uptake of N, P, K, Ca, Mg and S were 175.4, 23.7, 293.6, 70.7, 26.1, and 18.1 kg ha-1. NUL was not significantly influenced by the PD. The average NUL of N, P, K, Ca, Mg and S were 35.6, 4.8, 59.9, 14.2, 5.2, and 3.7 kg t-1 of leaf, respectively. NHI of N, Ca, and Mg were significantly lower with HR3 (Table 4). NHI of P, K, and S did not vary according to HR. PD influenced significantly the NHI of Ca and Mg, being lower at higher PD. The average NHIs were 0.61, 0.54, 0.47, 0.67, 0.73, and 0.43 for N, P, K, Ca, Mg, and S.
Table 2 Average concentration of nutrients in leaves and stems of stevia according to planting density and harvest regime in 2015
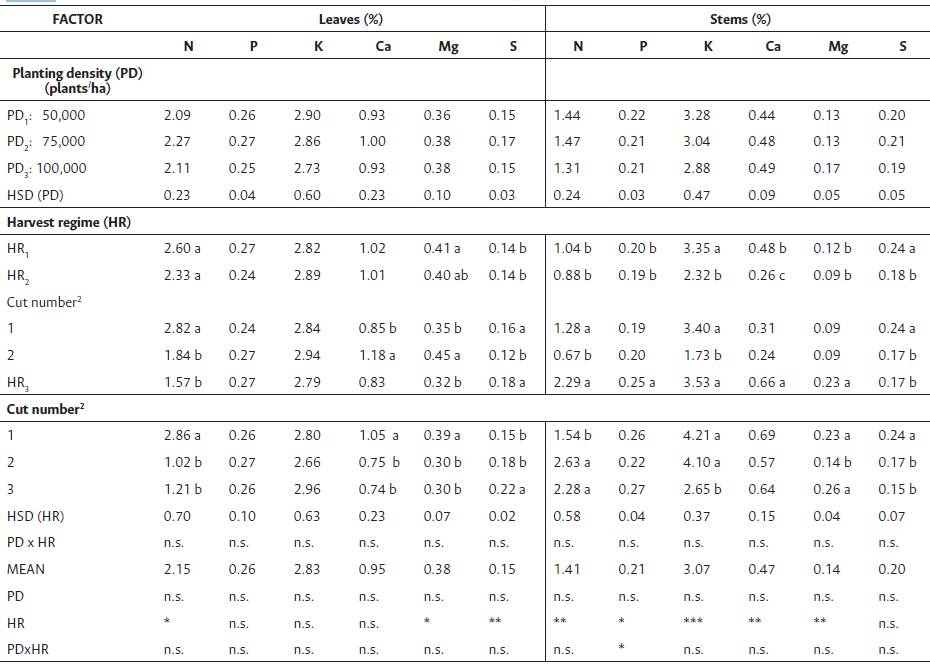
Different letters in the same column and for each factor mean statistically significant differences according to Tukey´s test for P < 0.05. 2Cut number factor was analysed separately for HR2 and HR3. HSD: critical value for comparison. n.s.: not significant; significant at *p < 0.05;**p < 0.01; *** p < 0.001.
Table 3 Mineral nutrient uptake by stevia according to planting density and harvest regime in 2015
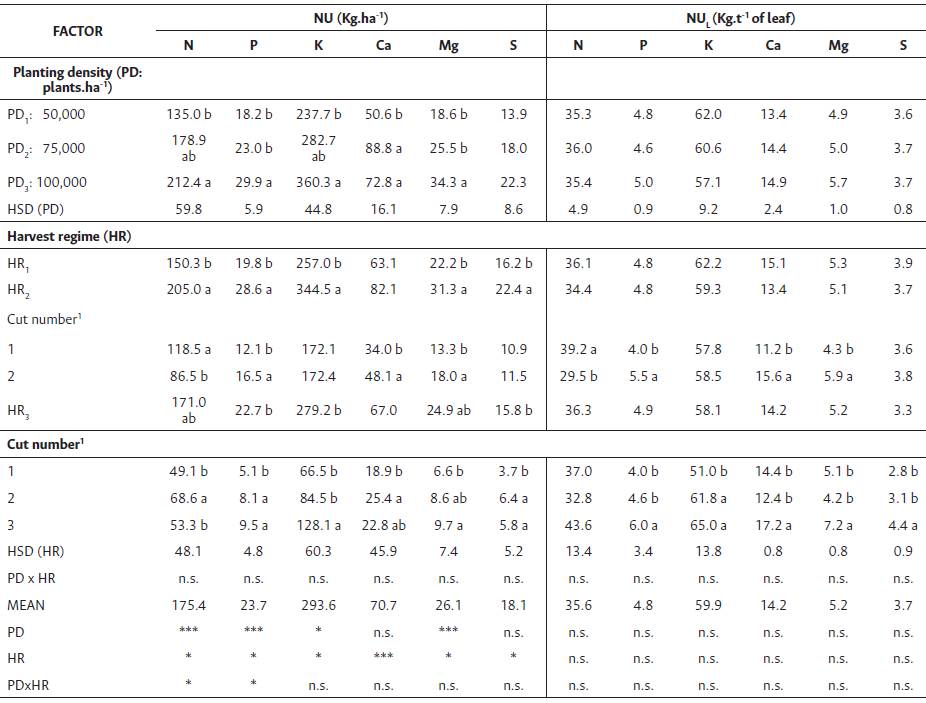
Different letters in the same column and for each factor mean statistically significant differences according to Tukey´s test for P < 0.05. 1Cut number factor was analysed separately for HR2 and HR3. HSD: critical value for comparison. n.s.: not significant; significant at *p < 0.05;**p < 0.01; *** p < 0.001.
Discussion
Stevia growth and SGs accumulation during the vegetative period
In 2014, the growth of stevia was not significantly influenced by the PD. It should be noted that in 2014 the vegetative period (transplanted at the end of May) was shorter than in 2015 (sprouting in early April.). The leaf yield increased until the end of flowering, and later it tended to decrease slightly (Figure 2), which was also observed by Serfaty et al. (2013). This was probably due to unfavorable weather conditions for stevia growing during this period (Figure 1), which caused defoliation of the older leaves due to senescence, which was also reported by Pal et al. (2015). The average temperature decreased sharply from mid September (15 °C) to November. Furthermore, relatively high precipitations were recorded from that date. The highest leaf yield achieved in 2014 (3.300 kg ha-1) was similar to that obtained by Andolfi et al. (2006) in the first year of planting under Mediterranean conditions. The average HI decreased exponentially along the vegetative period (Figure 3), which can be explained due to physiological reasons, as explained by Jarma et al. (2005). At first, the plant inverts to strengthen its photosynthetic ability, increasing the yield of leaves at a higher rate than that of stems. Then, there is a greater migration of substances produced by photosynthesis towards the stems, starting the HI decrease. It should be noted that flowering started at 80 DAP, before achieving the highest leaf yield (Figure 2), as reported by Gomes et al. (2018). As can be observed in Figure 4, the SGs content decreased sharply during flowering, which was also reported by others (Gomes et al., 2018; Pal et al., 2015). The SGs content before flowering (11.4 %) was consistent with the literature. The leaf highest SGs yield is usually reported to be reached between the flower bud state and the beginning of flowering, because later there is a translocation of photosynthates to the reproductive parts (Angelini & Tavarini, 2014; Ceunen & Geuns, 2013). However, the SGs yield continued to increase until 130 DAP (Figure 4), due to the strong increase of the leaf yield during that period (Figure 2). Therefore, the best quality and the highest yield were not obtained under the same crop management, which is in line with that reported by Pal et al. (2015).
Dynamics of nutrient content and accumulation
The N concentration decreased throughout the vegetative stage in leaves and stems (Figure 5), which is a consequence of a dilution effect (Jarrel & Beverly, 1981). N fertilization applied at top dressing did not increase the N content, in contrast to reports by others (Caires & Milla, 2016). Flowering, which is usually associated with nutrient content changes (Eshghi & Tafazoli, 2008), also did not show influence on N concentration. The N accumulation in the total biomass and in leaves was higher when the highest leaf yield was achieved, at 110 DAP. From that date, the total N accumulation barely change. Indeed, the N accumulation in leaves decreased significantly, due to the slight loss of leaf and the decrease in N concentration. Weather conditions from mid September (110 DAP) began to be unfavorable for stevia growth in this region (Figure 1), as explained above, leading to leaf senescence, causing N remobilization and leaf fall. Although N is the element predominantly remobilized during leaf senescence, other elements are reported to be remobilized, although less efficiently than N (Havé et al., 2017). From 110 DAP only N and S concentrations decreased in leaves. In stems, the sharp decrease of the K concentration could be explained due to a dilution effect, because the stem yield increased at a high rate during that period. In comparison with the results obtained by Benhmimou et al. (2018) in Morocco at 85 DAP with a similar fertilisation rate, the N and K concentrations of dry leaf determined in our work at that date were quite higher, but levels of P were similar, which could due to the low K concentration (20.3 ppm) and high pH (8.15) of soil in the Moroccan work. In comparison with results obtained by Angelini and Tavarini (2014) during the first year under Mediterranean conditions, in our work the concentration of N and K in leaves and stems was slightly higher, but the P concentration was similar. It should be noted that higher biomass yield was obtain in the Italian work in the first year.
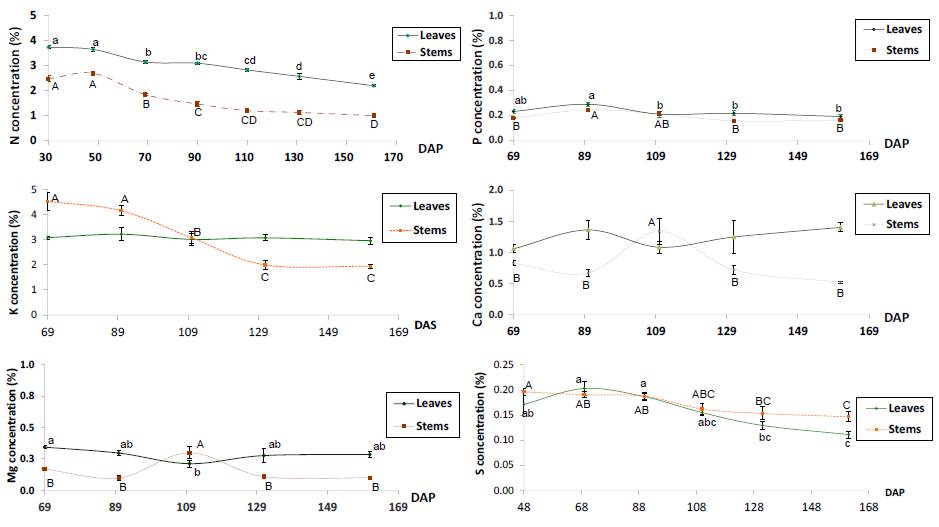
Figure 5. Dynamics of nutrients concentration (N, P, K, Ca, Mg, S) in leaves and stems of stevia in 2014. Vertical bars represent standard error of the mean (±). Different upper and lowercase letters mean significant statistically difference (P < 0.05) for stems and leaves, respectively.
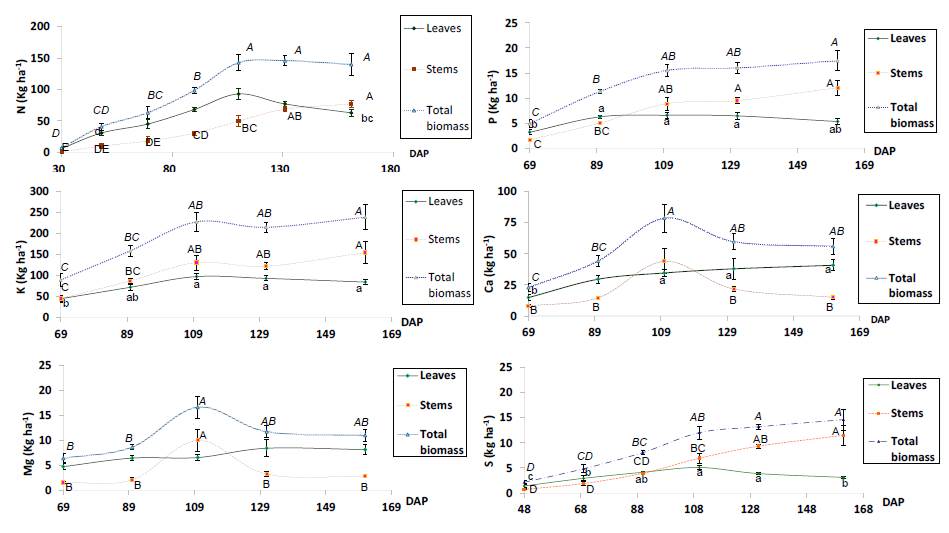
Figure 6. Dynamics of accumulation of N, P, K, Ca, Mg, S in leaves and stems of stevia in 2014. Vertical bars represent standard error of the mean (±). Different capital letters in italics, capital letters and lowercase letters mean significant statistically difference (P < 0.05) for total biomass, stems and leaves, respectively.
Yield and quality according to planting density and harvest regime
In 2015, the PD had significant influence on yield, unlike in the first year. It could be explained because of the longer vegetative period of 2015, as explained above, and because different harvest regimes were studied in 2015. Different authors have also reported higher leaf and SGs yield at higher PD. Serfaty et al. (2013) and Gomes et al. (2018) obtained the highest yield with 10.0 and 16.7 plants m-2, respectively. Angelini and Tavarini achieved high yields (around 8.600 kg leaf ha-1 and 1200 kg SGsha-1 on average) in the first year of planting under Mediterranean conditions, with only one cut per year at around 120 DAP, and using 5.0 plants m-2. However, in the second year of their experimentation, yields strongly declined due to frost damage during winter. In Table 1, it is evident that the lowest HI was achieved by the highest PD, as reported by Gomes et al. (2018). It was probably a consequence of the higher aboveground competition for light among plants at higher plant density, which has been described for other crops, such as maize (Zhai et al., 2018) or amaranth (Jarma et al., 2010). It should be noted that the stem yield was quite higher with PD3. The HI decreased significantly in the successive cuts of HR2 and HR3, which could be due to the stimulation of sprouting secondary stems, and also because a shorter day length under these conditions. HR has been studied in stevia under different conditions, with heterogeneous results. Higher yields have been obtained with two cuts per year (Andolfi et al., 2016, Pal et al., 2015), but also with only one (Moraes et al., 2013; Serfaty et al., 2013), which can be explained due to the different environmental conditions and stevia varieties of those studies. In our study, highest yields were achieved with HR2. However, the average daily accumulation rate of leaf biomass and SGs of HRj (36.1 kg leaf ha-1 and 4.4 kg SG ha-1) was higher than those of HR2 (33.5 kg leaf ha-1 and 3.6 kg SG ha-1) and HR3 (26.3 kg leaf ha-1 and 2.6 kg SG ha-1). Obviously, the cutting of stems causes a shock to the plant, stopping the photosynthesis and the growth. HR also had significant influence on the SG content and, therefore, on the leaf quality. It should be highlighted the relatively high leaf yield achieved in all harvest dates of HR„ and HR3. However, Pal et al. (2013) obtained more than 80 percent of the yearly leaf yield in the first cut, because of insufficient day length from the first harvest date to the second one. The average SG concentration was lower at higher number of cuts per year of the HR. The fact that the lowest SGs concentration was recorded in the first cut of HR3, could be explained because it was carried out in early June, when temperatures were still mild. It should be noted that in 2015 plants started the vegetative activity (sprouting from rhizomes) around two months before than in the 2014 (transplanting).
Nutrient content and uptake at harvest according to planting density and harvest regime
The dry biomass yield increased with the planting density and achieved the highest values with HR2 (Table 1), which partially explains the highest mineral NU determined for those cases, as the NU is the result of the dry matter yield per the nutrient concentration. The NU estimated by Brandle et al. (1998) of 105-23-180 kg ha-1 of NPK, for a moderate stevia biomass yield of 7500 kg.ha-1 under Canadian conditions, were lower than that reported in this work for N and K, and similar for P. The NP fertilization recommendations (300-100 kg ha-1) of Benhmimou et al. (2018) is higher, but a similar K fertilization rate (240 kg ha-1) was proposed. Angelini and Tavarini (2014) achieved an average leaf yield of around 8600 kg ha-1, and determined a nutrient uptakes of 196.7, 33.7, 344.0 kg ha-1 of NPK. A similar NPK uptake was obtained in this work with HR2 (205.0, 28.6, 344.5 kg ha-1 of NPK), although the leaf yield (6000 kg ha-1) was 30 % lower than that reported by Angelini and Tavarini (2014). Then, the NUL determined in the Italian work were lower than those calculated in this work. It can be explained because the NPK concentrations were higher in our case, both in leaves and stems. The average results of NHI (Table 4) indicate that N, Ca, and Mg, are mainly located in leaves. On the contrary, S is mainly located in stems. Both K and P are almost evenly located within both organs. Thus, about 61 %, 54 %, 47 %, 67 %, 73 %, and 43 % of the N, P, K, Ca, Mg, and S nutrient uptake were removed from the soil by leaves. These values should be useful for fertilizer recommendations.
Table 4 Nutrient harvest index (NHI) of stevia according to planting densities and harvest regimes in 2015
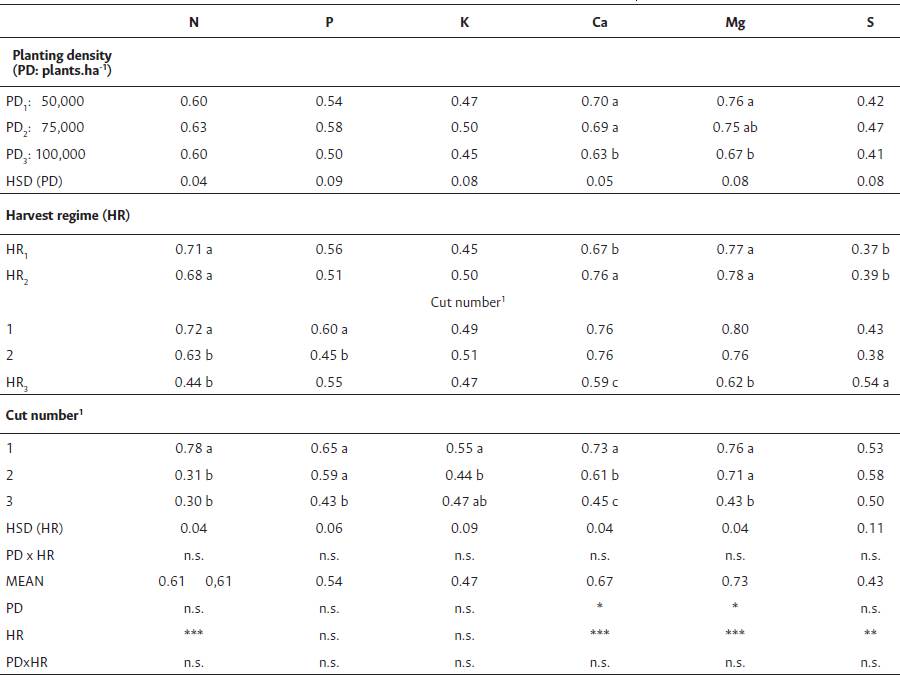
Different letters in the same column and for each factor mean statistically significant differences according to Tukey’s test for P < 0.05. 1Cut number factor was analysed separately for HR2 and HR3. HSD: critical value for comparison. n.s.: not significant; significant at *p < 0.05;**p < 0.01; *** p < 0.001.
Conclusion
Stevia showed great potential when grown under a continental Mediterranean climate. The best quality and the highest yields were not obtained under the same crop management. The highest yield was obtained with the highest PD (10 plants m-2) and two cuts per year. The leaf yield was superior at higher planting densities for two-years plants. Increasing the number of cuts during the growing period decreased the SGs concentration in the leaves. The best quality was determined with one cut before flowering. The mineral concentration in leaves and stems was not significantly influenced by the PD. It is noteworthy that the NUl was not affected by any of the factors studied. About 61 %, 54 %, 47 %, 67 %, 73 %, and 43 % of the N, P, K, Ca, Mg, and S nutrient uptake were removed from the soil by leaves. Potassium requirement for stevia cultivation is relatively high. These results will be useful for stevia crop management and fertilization strategies, especially for inland Mediterranean areas.

