


 English (pdf)
 Article in xml format
 Article references
 Send this article by e-mail
 Cited by SciELO
  Cited by Google
  Similars in
SciELO
Similars in
SciELO  Similars in Google
 Permalink
Introduction
Rice is a staple food for half of the world’s population, which is projected to grow from 7.7 billion in 2019 to 9.7 billion in 2050 (UN, 2019). According to the FAO (2018), rice is the predominant daily source of nourishment for more than 1.6 billion people around the world, making up 16.5 % of the global caloric daily intake in Asia, Latin America and Africa. Facing the challenge of population growth and cropland reduction, the only way to solve this problem is to improve the yield of major cereal crops such as rice, wheat, and corn. Hybrid rice technology could offer a great opportunity for increasing food production of rice-growing countries (Yousuf & Alim, 2020). Good hybrids have the potential for yielding 15-30 % more than the best inbred variety grown under similar conditions (Tiwari et al., 2011).
Genotype-environment interaction (GEI) refers to the different ranking of genotypes across environments as a criterion to complement the selection process and recommend a genotype for a target environment (Gauch, 2006; Katsura et al.2016, . Plant breeders perform multi-environment trials (MET) to select favorable genotypes based on both mean yield and performance stability; to determine whether the test environments are homogeneous, they should be divided into various mega-environments (Yan, 2019; Katsura et al., 2016; Gauch, 2006).
There are various methods for describing the effects of GEI along with identifying and recommending adapted and stable genotypes in breeding programs. The conventional methods are grouped in parametric (univariate and multivariate) and nonparametric approaches based on different strategies. The univariate parametric strategy includes the methods that are based on variance components and joint regression. The combined variance analysis is the most common method used for the identification of GEI in repeated multi- environment trials (Lin & Binns, 1988).
One of the difficulties in cultivar assessment is the establishment of reasonable standards, generally provided by the check varieties, and substituted by the maximum response parameter in the Lin and Binns model (1988), which is mainly used to assay stability when experimental structure is lacking.
Yan et al. (2000) modified the standard additive main effects and multiplicative interactions model (AMMI), by grouping graphically the G and GEI effects in a multiplicative manner, using the analysis of the principal components through the site regression model (SREG) under the GGE biplot. Such a graphic is constructed by the first two symmetrically scaled principal components (PC1 and PC2) derived from singular value decomposition of environment- centered MET data. The GGE biplot displays G plus GEI of a MET in a way that facilitates visual cultivar evaluation (adaptability and stability) and mega-environment identification. Three important aspects allow to identify the grouping of genotypes and environments with similar performances, the interrelationships between test environments and the interrelationships between genotypes for adaptability and stability (Yan, 2019).
Recent studies describe the predicting efficiency of AMMI and GGE biplots by using the genotype average yield, the relationship between genotypes and the evaluation of the environments (Acevedo et al., 2021; Acevedo et al., 2019; Rebolledo et al., 2018; Haider et al., 2017; Akter et al., 2015). Nevertheless, few publications are available in Venezuela and Latin America on rice hybrid GEI research. The objective of this study was to determine the GEI magnitude, to group similar environments, and to identify the adaptability and stability of rice hybrids and varieties with the Lin and Binns and GGE biplot SREG models, using experimental data from paddy yield (t ha-1) at six sites located in the main Venezuelan rice-producing areas.
Materials and methods
The genotypes evaluated were part of the nursery introduced from Hybrid Rice Consortium for Latin America (in Spanish HIAAL), based at the International Center for Tropical Agriculture (in Spanish CIAT) and from the Danac Foundation in Venezuela. The trials consisted of ten genotypes, discriminated into six hybrids and four check varieties (table 1), selected upon their agronomic performance in Venezuela.
Table 1 Genetic materiaLs of the HIAAL rice hybrid nursery for Venezuela
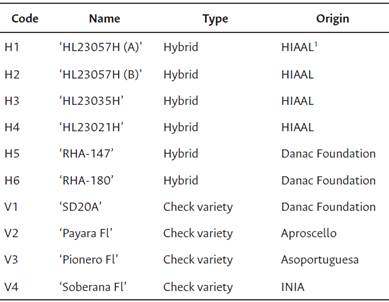
1HIAAL: Hybrid Rice Consortium for Latin America
The experiments were planted in a randomized complete block design (RCBD) with three replicates. Plot size consisted of 8 rows of 5 m length with a row-to-row distance of 0.30 m (effective harvest area of 9 m2).
Trials were planted during the dry season (November-April) of the 2015-2016 cropping season, in six environments located in the most important rice-growing regions of Venezuela (table 2). Dried seeds were sowed using a 40 and 100 kg ha-1 seed density for hybrids and varieties, respectively. During all crop growth stages, standard agronomic practices were followed in each location. The trait evaluated was grain yield expressed in tons per hectare (t ha-1) at 12 % moisture.
Table 2 Agroclimatic characteristics of the selected locations for studying genotype x-environment interaction (GE) of rice hybrids and varieties in Venezuela, annual average mean values 2015-2016
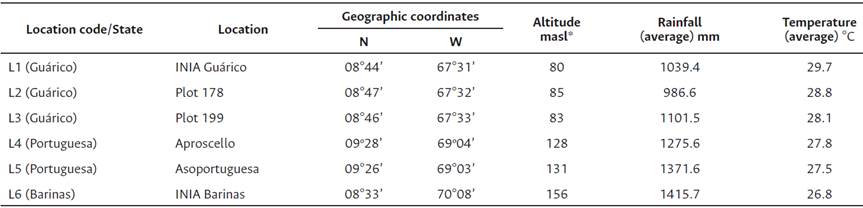
Source: National Institute for Agricultural Research (INIA) - Agro-Meteorology. http://agrometeorologia.inia.gob.ve/index.php *masl = meters above sea level.
Statistical analysis
Individual and combined analysis of variance (ANOVA) among locations were performed based on the average grain yield data per plot, considering genotype (G) effects as fixed, while genotype-environment interaction (GE) effects were considered random. As for the source of genotype variation, comprising hybrids and varieties, a decomposition of treatments’ degrees of freedom was performed through orthogonal contrasts.
The “better parent or useful heterosis” for grain yield of each hybrid cultivar was calculated as follows:
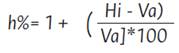
where h% refer to useful heterosis, mean hybrid yield and mean yield of the variety with the best performance, respectively.
Biometric models for phenotypic adaptability and stability
The statistic representing stability and adaptability for Linn and Binns was calculated using the following equation:
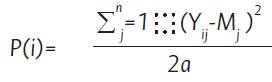
The superiority index P(i) was estimated taking the sum of squares of the differences between the genotype of interest (Y ij ) and the maximum response genotype of each environment (Mj); (a) refers to the number of environments considered, and represents the mean square of the combined G and GE effects. Because it is estimated with respect to the maximum response, it represents the adaptability in a general sense. The stable genotype is the one with the lowest P i index.
The model corresponds to that proposed by Yan et al. (2000). The biplot was constructed by using the first principal component analysis (PCA) with the site regression model (SREG), according to the following linear model:
Where Yij corresponds to the average genotype yield of the i (i = 1...10) genotype in the j (j = 1...6) environment; μ is the general media; b. is the effect of the j environment;  represents the first principal component (PC1);
  represents the second principal component (PC2);
  and
and  are the auto values associated to PC1 and PC2, respectively;
  and
and  are the autovectors of genotype i for the first and second principal component, respectively;
  and
and  are the autovectors of the environment j for the first and second principal component, respectively; and
  is the experimental error associated with the genotype i in the environment j. The GGE biplot analysis was carried out using the Agricolae library of the R program (R Foundation for Statistical Computing, 2014).
Results
Combined analysis of variance among locations
The combined ANOVA for grain yield detected significant differences (p < 0.05) for genotypes (hybrids and varieties), locations and genotype x location interaction (GLI), showing the variability between genotypes and locations, as well as the influence of the environment over the genes that determine grain yield of rice genotypes, with a proportion on the total treatment variation of 19 % for genotypes, 65 % for the locations and 15 % for GLI.
The doubling of the degrees of freedom of genotypes in varieties and hybrids, and the contrast hybrids vs. varieties through orthogonal matrices, showed significant differences (p < 0.05) between hybrids and locations. This suggests that hybrids cannot be recommended for all locations due to their high variability. The average grain yield was 7.70, 7.26 and 7.44 t ha-1 for varieties, hybrids, and average general trials, respectively, with a variation coefficient of 14.35 %.
Yield means per cultivar per location (t ha-1) and the overall mean (Table 3) showed that cultivars with the best performance per location were the hybrids ‘RHA-180’ in the locations L2, L5, and L6, the varieties 'Soberana Fl’ and ‘SD20A’ in L1 and L3, respectively, and the hybrid HIAAL ‘HL23057H (B)’ in L4, while ‘RHA-147’ and ‘HL23021H’ had the worst performances. The locations with the highest yield means were L6, L2, L3, in decreasing order, and L5 with the lesser means.
Table 3 G rain yield means (t.ha-1), standard heterosis and Lin and Binns superiority index of 10 rice cultivars in six Venezuelan locations
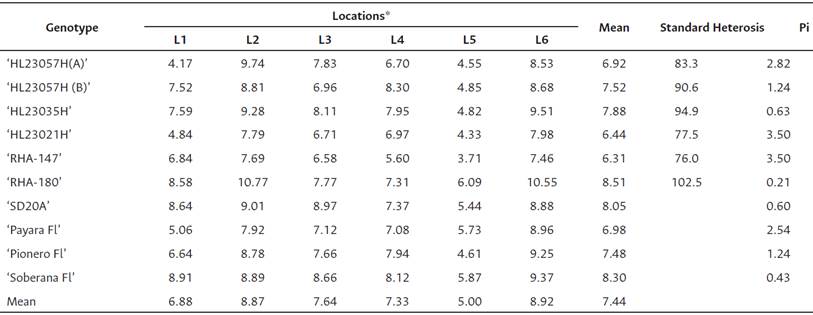
*L1, L2, L3, L4, L5 and L6: INIA Guárico, Plot 178 (Guárico), Plot 199 (Guárico), Aproscello (Portuguesa), Asoportuguesa (Portuguesa) and (INIA Barinas), respectively. Pi Superiority index of the i-th cultivar.
Standard or useful heterosis (Table 3) was calculated for all hybrids using the best check variety, 'Soberana Fl’, as reference. Only the genotype ‘RHA- 180’ showed non-significant 2.5 % hybrid vigor. In general, all the hybrids showed positive, low, and non-significant heterosis.
Lin and Binns model (P i )
The statistic P, known as the superiority index of Lin and Binns (1988), is very useful to identify stable and adapted cultivars (Table 3). The average performance of each genotype in the different locations and the index P i displayed a high correlation of -0.98**, showing the possibility of identifying adapted and stable genotypes. The hybrid ‘RHA-180’ and the variety ‘Soberana FL’ showed the lowest indices, followed by the hybrid HIAAL ‘HL23025H’, indicating that such genotypes are the most adapted and stable. HIAAL hybrids ‘HLT23021H’, ‘HL23057H (B)’ and ‘RHA-147’ had the highest scores on the index, exhibiting low adaptability and stability in trial environments.
(b) SREG model using the GGE biplot
In the GGE biplot, the polygon is formed by the union of line segments between the genotypes further from the graph origin located at the vertices, known as the “winner genotypes”. These genotypes represent the best or worst average performances in one, several, or all tested locations.
Analysis for mega environments. The GGE biplot model allows the grouping of related locations, as well as the identification of genotypes for a specific environment or a group of environments. In this analysis, the GGE biplot “which won where” (figure 1) also showed that the first principal component axis (IPCA 1) captured the highest proportion of genotypic effect (64.56 %), while the second principal component axis (IPCA 2) showed the 17.59 % of the GLI, adding 82.15 % of the total variability, with high significance.
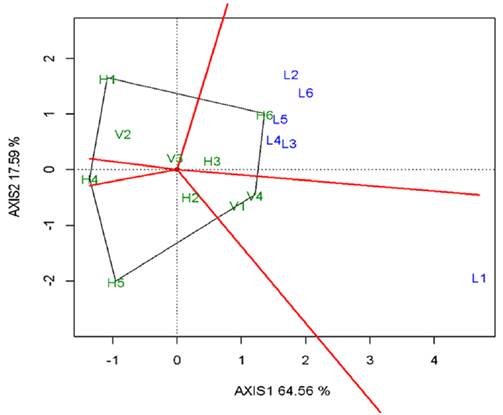
Figure 1 GGE biplot “which won where” based on rice grain yield (t. ha-1) of hybrids (H) and varieties (V) genotypes at six Venezuelan locations (L).
The perpendicular lines by the polygon sides (red lines), passing through the GGE biplot origin (figure 1), allocated the ten genotypes and the six trial locations in five sectors. Sector 1 contained the ‘RHA-180’ (H6) and ‘HL23035H’ (H3) hybrids, with H6 as the ‘winning genotype’ with the best grain yield and the best response to environmental changes, followed by the H3 hybrid. Sector 2 grouped the varieties ‘Soberana Fl’ (V4) and ‘SD20A’ (V1), with V4 being the “winning genotype”, followed by V1 with an outstanding performance. The variety ‘Pionero Fl’ (V3), near to the origin, yielded a moderate performance at all testing localities. The remaining sectors did not group localities, while the genotypes ‘RHA-147’, ‘HL23021H’, ‘HL23057H (A)’ and ‘Payara Fl’ (H5, H4, H1, and V2, respectively) were considered to have poor performance in all the localities.
The analysis allowed the identification of two mega-environments, the first one with the ‘Soberana Fl’ (V4) as ‘winning genotype’ and grouped L1 (INIA Guárico), while the second one grouped the rest of the locations, having the hybrid ‘RHA-180’ (H6) as ‘winning genotype’.
Genotype stability evaluation
The axis passing by the origin of the GGE biplot and identified with an arrow and a circle is known as the average environment coordinate (AEC) and is defined by the mean value of the IPCA1 and IPCA 2 scores for all the localities (figure 2).
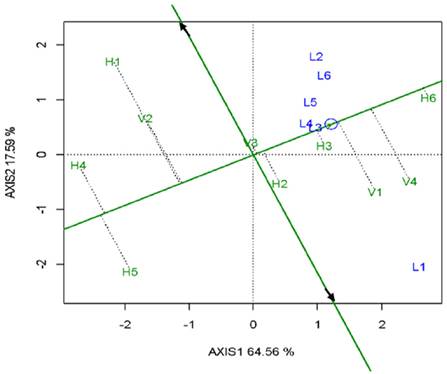
Figure 2 GGE Biplot “Average means - stability” of rice hybrids (H) and varieties (V) genotypes in six localities (L) of Venezuela.
The line perpendicular to the AEC that crosses the origin of the biplot (identified with a double arrow) allows to infer that genotypes located to the right would be those with better average performances, whereas the genotypes to the left presented the worse performances. Besides, the projection up and down over AEC in both directions shows the stability of these genotypes, being the most stable genotype the one that is less projected from the EAM.
Rice genotypes with superior average performance based on the general mean for grain yield were ‘RHA-180’ (H6), followed by 'Soberana Fl’ (V4) and ‘SD20A’ (V1), and the hybrids ‘HL23035H’ (H3) and ‘HL23057H(B)’ (H2), in decreasing order; while the materials showing superior performance when compared to the mean of the AEC were V1, V4 and H6, in increasing order. The hybrid ‘RHA-180’ was the most stable, presenting the lowest vector in relation to the AEC, followed by ‘HL23035H’ (H3) and ‘HL23057H(B)’ (H2), both HIAAL. Those results agree with the Lin and Binns analysis by identifying the same genotypes with the lowest superiority indexes , and classifying them as the best adapted and most stable.
The remaining genotypes ‘RHA-147’, ‘HL23021H’, ‘HL23057H(A)’ and ‘Payara FL’ (H5, H4, H1, and V2, respectively), exhibited a below-average yield performance compared to the general average mean, proving to be more unstable and with higher GEI. The variety ‘Pionero Fl’ (V3) presented a moderate performance in all the localities and high phenotypic stability among the evaluated varieties, with ‘Payara Fl’ (V2) being the genotype with the lowest grain yield and the most unstable
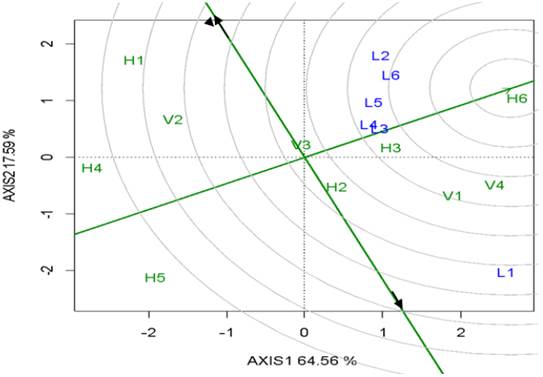
Classification of the “ideal genotype” based on stability and grain yield
The “ideal genotype” is that “ideotype” that presents a similar or superior yield when compared to the AEC, together with a high stability. In figure 3, the “ideal cultivar” was the ‘RHA-180’ (H6) hybrid, because it showed superior yield to the AEC and high stability, locating itself near the center of the concentric circles. Furthermore, the genotypes located near the ideal genotype are considered “good genotypes”, as in the case of the variety ‘Soberana Fl’ and the hybrid ‘HL23035H’.
Evaluation of locations and identification of the ideal test location
In the GGE biplot (figure 4), the locality that best discriminated genotypes is the one showing a great magnitude vector, whereas the representability is presented by the lesser angle (acute angle) in relation to the AEC. In this case, L1 (INIA Guárico) was the locality that best discriminated the genotypes, while L3 (Plot 133) and L4 (Aproscello) were the most representative locations. The localities are situated in different rice- producing areas in the country and present unique agro-climatic characteristics as well as different crop management technologies.
Discussion
Significant GLI has also been detected by other researchers (Acevedo et al., 2019; Ponnuswamy et al., 2018; Huang et al., 2017; Yuan 2017), representing a challenge to rice breeders because it affects the recommendation of releasing such cultivars. Therefore, more detailed studies are required on the genotype adaptability and stability, as well as for the trial locations.
In this study, hybrids showed low magnitude heterosis. Accordingly, Tiwari et al. (2011) pointed out that hybrid cultivar success depends upon the hybrid vigor magnitude, which should be between 15 to 20 % above the yield of the best conventional variety used. Heterosis estimates are highly affected by the environment, mainly the location and planting season, among others (Yuan 2017; Huang et al., 2017). As shown in this study, in Latin America, check varieties tend to outperform hybrids, which is attributed to superior adaptability (FLAR, 2014).
In Latin America, rice hybrid technology has had strategic importance in research and development in recent years, mainly in adaptability studies as reported by Blanco et al. (2015), Gaklik et al. (2015), and Álvarez et al. (2008). Nevertheless, there are no detailed studies about hybrid adaptability and stability.
According to the methodology of the superiority index of Lin and Binns, the smaller the index magnitude is, the lower the deviation regarding the maximum productivity in each environment will be. So, it can be inferred that the highest stability and adaptability are associated with high productivity of the hybrid ‘RHA-180’ and the variety 'Soberana Fl’.
The GGE biplot analysis showed high variability as compared to that reported by Ponnuswamy et al. (2018) and Haider et al. (2017). Additionally, both components IPCA1 and IPCA2 showed high significance.
The environments grouped in a sector having a winning genotype, with variations among groups greater than within them, were considered as mega- environments (Yan & Kang, 2003).
Mega-environments are formed when different genotypes become adapted to diverse groups of environments and the variation among groups is greater than within them (Yan, 2019). So, two mega- environments were identified, the first one with the 'Soberana FL’ as the 'winning genotype’ and the locality L1 (INIA Guárico); this environment also formed a different mega-environment in a previous elite rice lines yield assay in Venezuela (Acevedo et al., 2019). The second mega-environment reunited the localities L2, L3, L4, L5, and L6, having as winning genotype the hybrid 'RHA-180’.
Therefore, it is recommended to consider both mega-environments in detailed adaptability studies, in order to develop and validate new rice cultivars (hybrids and varieties) in the country.
Both models coincide in identifying the 'RHA- 180’ hybrid as the most adapted and stable, but disagree with Acevedo et al. (2019), who pointed out the high stability of 'Soberana FL’, the so-called “ideal genotype”, in assays between rice elite lines, and confirmed the instability of 'SD-20A’. In general, stability and adaptability work involving cultivars (hybrids and varieties) agree in indicating better adaptation and stability of the varieties, possibly attributed to greater plasticity derived from their genetic constitution. However, stable hybrids were developed from stable parents, but stable parents do not necessarily generate stable hybrids (Saidaiah et al., 2010; Acevedo et al., 2019).
The properties of discrimination and representativeness of the tested environments should be offered by the “ideal location” with the aim to contribute to increase selection efficiency and cultivar recommendation (Yan, 2019). In this study, it was not possible to identify the “ideal locality”, L1 (INIA Guárico) was the most discriminating locality, while L3 (Plot 199) and L4 (Aproscello) were the most representative ones. However, we consider more important that the two mega-environments identified are considered as test locations for the evaluation and selection of hybrids and varieties since these localities are in different rice-producing areas in the country and present unique agro-climatic characteristics as well as different crop management.
In this sense, another aspect to be considered is that the agro-climatic factors have lesser importance in the SREG model proposed by Yan et al. (2000), because the principal effect of the genotype and the GEI are considered together. Therefore, the adaptative capacity of the genotypes at the time of crop selection and the building of the mega- environments is more important than the agro- climatic conditions (Rebolledo et al., 2018).
In the localities L5 and L6, the genotypes responded in a similar fashion and no genetic differences were observed; therefore, they are not recommended as testing environments to select rice genotypes. Similar results were obtained by Acevedo et al. (2010) in the L6 locality (INIA Barinas), which contributed little to the interaction, and, in consequence, the genotypes presented similar performances. The discrimination capacity of genotypes and localities is related to the composition of the assayed genotypes; likewise, the presence of GEI could complicate the identification of ideal testing localities (Yan et al., 2000).
In the GGE biplot (figures 1 and 3), it is also possible to observe that the locations L2, L3, L4, L5, and L6 were grouped by presenting low angle and were highly correlated, suggesting that these localities provided redundant information about the genotypes, in contrast to locality L1. These results show that the use of fewer testing locations can reduce costs, decrease testing environments, and increase the efficiency of genetic breeding. However, it is recommended to carry out the tests in as many environments as possible and for several years to obtain more reliable information.
Conclusions
The grain yield of rice hybrids and varieties was highly influenced by the genotype, testing localities, and the interaction among them, the latter showing a 15 % magnitude above the total variability, according to the analysis. The hybrids ‘RHA-180’ (H6) and ‘HL23025H’ (H3) presented adaptability and stability for grain yield, whereas the hybrid ‘RHA-180’ turned out to be the “ideal genotype”. The varieties ‘Soberana Fl’ and ‘SD-20A’ presented high average performance, superior to the general mean in all testing localities, and intermediate stability. The Lin and Binns and SREG models used agreed to identify the hybrid ‘RHA-180’ and the variety ‘Soberana FL’ as the most adapted. The SREG-GGE biplot model was effective for grouping localities and identifying the best stability cultivars in each mega-environment. Plot 199 was identified as the most representative, while INIA Guárico discriminated best for testing rice hybrids and varieties. The GGE biplot model was more effective and informative for analysis and assessment of the genotype by environment interaction.

