Introduction
From an agricultural point of view, quality describes specific physical properties or conditions of fruits and vegetables. These properties can be observed through equipment that evaluates the quality conditions within the life cycle. Incorporating a consumer perspective complements the basic agricultural definition to match their expectations for the product during the moment of purchase or consumption. Throughout their experience, consumers gather multisensory information from food about sensory parameters that facilitate its assessment (Dijksterhuis, 2016; Roque et al., 2018; Varela and Ares, 2012). Consumers’ capacity to evaluate the products through visual features is helpful as retail moves to digital channels. During the COVID-19 pandemic, the shift to E-commerce increased due to the need for social distancing and avoiding physical spaces where incidental touch occurs. Afterwards, the use of digital channels remained because of the preference for convenience and improved digital technologies and channels (Westbrook and Angus, 2023).
Although its share is the lowest compared to other channels (i.e., super and hipper markets, traditional grocery retailers, discounters, and convenience stores), E-commerce has had unprecedented growth (Lahouasnia et al., 2020). Because of the high demand this channel is facing, there are challenges in E-commerce to retain the consumers that begin to use it, as they demand “fresh” food, meaning ready- to-eat food (Schaefer, 2021). Thus, understanding consumers’ expectations in the decision-making environment (e.g., an app, web page, or store) becomes a key component for the success of food providers. This research aimed to determine the fruit image that best represents that it is ready to eat.
In practical terms, our study provides a tool that chooses an image with the highest likelihood of matching consumers’ appetite for fruit. Retailers can use this information to communicate that it is ready to eat. Additionally, if the product provider, the supply chain, and the distribution channels know the expected fruit attributes for consumption, they can better predict and manage harvest periods, transportation, and fruit exhibitions.
Fresh fruit quality
Quality is a perceptual construct related to the degree of excellence of fresh fruit characteristics based on its use (Abbott, 1999), leading to consumers’ satisfaction (Harker et al., 2003). The quality of fresh fruit is defined in terms of physical characteristics and sensory properties (Abbott, 1999). Nutritional values, chemical components, physical properties, and functional features represent the physical characteristics. This information is gathered through technologies that characterize the electromagnetic (optical properties, fluorescence, delayed light emission, x-ray, and magnetic resonance), mechanical (firmness and deformation tests, and impact), and electrochemical (concentration of volatiles) properties of food.
The design of all these technical evaluations attempts to imitate the human perception of expected quality (Abbott, 1999). Thus, human perception of sensory properties is an antecedent of the expected product quality attributes, as it establishes sensory specifications that are systematically evaluated through physical attributes (Meilgaard et al., 2016). These technical evaluations can set thresholds for sensory attributes that predict consumers’ acceptance (Meilgaard et al., 2016).
Visual quality features include size, shape, color, gloss, and freedom from defects and decay (Kader, 2002). This research focused on visual quality because it is the one that prevails during a purchase experience, especially if a business hopes to grow through online commerce. Instrumental and perceptual evaluations of quality are complementary perspectives, where the first is defined or redefined by the latter as consumers’ expectations change (Péneau, 2006). Fruit quality is associated with the physiological and sensory degradation of the fruit due to natural or artificial processing; it does not include defects related to external issues such as a fungal attack, insect or bird bites, mechanical damage, frost, and sunburn (Leemans and Kleynen, 2008). Perceived quality, associated with the fruit’s lifecycle, involves the concepts of freshness and ripeness. However, both terms are often used ambiguously and interchangeably.
Freshness
Consumers think of freshness as the overall quality of fruit, given the observed sensory characteristics (Péneau, 2006; Péneau et al., 2007). Although freshness is a concept that defines consumers’ perception of quality, its meaning is ambiguous (Dan et al., 2015) and not differentiated from the idea of ripeness. Freshness is associated with how green or not yet ready-to-eat is a fruit (Leemans and Kleynen, 2008). Other authors define freshness through the opposite idea by observing the natural appearance of bruises and other damages on fruit texture as it ages (Moltó and Blasco, 2008; Nagata and Tallada, 2008). Freshness is also determined through the fruit’s firmness; however, technical processes to store fruit can preserve their appearance and texture as these degrade through time (Redgwell and Fischer, 2002), leading an “old” fruit to look as recently harvested, but taste rancid.
Ripeness
Ripeness occurs when the fruit reaches its physiological maturity (Mendoza and Aguilera, 2004), on a scale from green to damaged. Mature fruit is completely developed and has reached its full growth; thus, harvest must take place in the mature stage before ripening (Kader, 2002). The ripening process consists of the darkening of color and softness of the texture (Díaz, 2008; Leemans and Kleynen, 2008; Mendoza and Aguilera, 2004; Moltó and Blasco, 2008; Nagata and Tallada, 2008). It occurs from the latter stages of growth until the plant looks old (Kader, 2002). Fully ripe fruit is considered ready to eat, and overripe fruit is bad (Ramprabhu and Nandhini, 2014). At a fully ripe stage, fruit exhibit the best attributes for consumption through its aroma, sweetness, and juiciness. As fruits mature and ripen, starch transforms into sugar, and cell walls become more soluble, softening the fruit (Kader, 2002); these changes mean it is ready to eat.
The human eye can detect the ripening process because, during this process, fruits lose water, decreasing weight and size (Burbano and Daza, 2012; Luo et al., 2020). The loss of lipids is what explains the loss of water. Because lipids constitute the cell membranes, they protect the fruit from losing water during the early stages and bring a waxy appearance (Kader, 2002). Consumers can also observe the change in colors due to the loss of chlorophyll (green color), the development of carotenoids (yellow and orange colors), and anthocyanin (fruit-specific colors: red, blue, purple) (Kader, 2002). Ripeness is the ideal stage of consumption. At this point, consumers use their previous experience and knowledge about fruit to evaluate if it is ready for intake because it appears to have its best taste and nutritional value.
Understanding concepts like freshness and ripeness from a consumer perspective represents a challenge to assess agricultural products’ quality (Luo et al., 2020). Moreover, consumers’ convenience expectations for fresh food are related to the idea that it was recently prepared (Schaefer, 2021). In other words, if consumers were asked to evaluate fruit’s freshness or ripeness, these concepts would be difficult for them to understand, they must judge through sensory evaluations if the fruit is ready to eat or if it is too old and the optimum moment for consumption has already passed.
Materials and methods
Participants
In total, there were 240 participants, all of them university students from a Colombian private institution. Their average age was 20 years, 44 % were males, and most of them (95 %) were regular fresh fruit consumers. Among the selected fruit, participants rated lulo and banana as their favorites (88 %). These were followed by avocado, with 71 % preference. Only 28 % of the participants chose guava as their favorite.
Materials
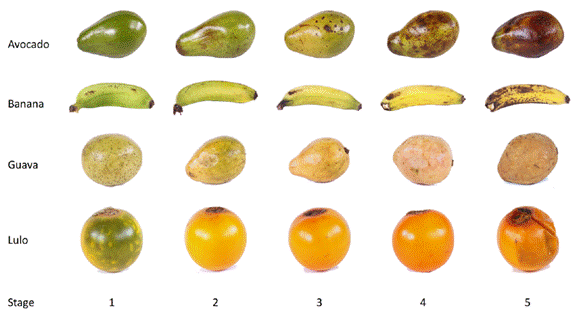
Fruits used for the study were purchased at the local market based on the varieties at harvest time at that moment. Pictures of each type of fruit were taken from the side at five different degradation stages for a total of 20 images (5 x 4). Figure 1 shows the stimuli used in the experiments: avocado (Lorena Papelillo), banana (Cavendish Valery), guava (Cotorrera), and lulo (Solanum quitoense). Each column shows a different degradation stage ordered from newest to oldest, from left to right.
A digital SLR camera (Canon EOS) placed on a stabilized tripod was used. Pictures were taken following standard conditions: white background, white-controlled artificial light, equal distance between the camera lens and the fruit, and stable temperature (22° C). The questionnaires for the study used these fruit images as stimuli, and were administered in a controlled environment using calibrated computer displays.
Method: experimental design
This is a within-subjects experimental design approved by the ethics committee of the institution where the study took place (project number CA0113213). The subjects participated voluntarily, and they were able to abandon the study if, for any reason, they did not want to continue. Responses do not contain identifiers, and matching any response to a particular subject is impossible. Subjects responded to an online survey administered in a computer laboratory with calibrated computer displays.
The survey was divided into ten sections: a consent section, four sections that assessed the ideal fruit-image for “now” (one section for each fruit), four sections that assessed the concept of an “old” fruit (one section for each fruit), and a last section where the participants were asked for demographic information. The evaluation of “now” and “old” used a two-alternative forced choice (2AFC) method. While a pair of images with different degradation stages was displayed, the participant chose the alternative that they best considered as ready to eat. This assessment was accompanied by the question “which of the two fruits do you choose to consume now?” Subjects used a computer mouse to select the image.
Similarly, for choosing the image of a fruit that is already too old to eat, subjects chose between a pair of images responding to the question “which of the two fruit alternatives do you consider to be the oldest?” Each section had ten pairs of images corresponding to the combination of five elements, and each picture represented the fruit in one stage of its life cycle. Within each section, the order of presentation of each pair of combinatory alternatives was randomized. The survey had a total of 80 2AFC questions: 10 image pairs (five stages in pairs) x 4 fruits (avocado, lulo, guava, and banana) x 2 quality perceptions (now and old). Subjects took about 10 minutes to respond to the survey.
Results
Descriptive statistics
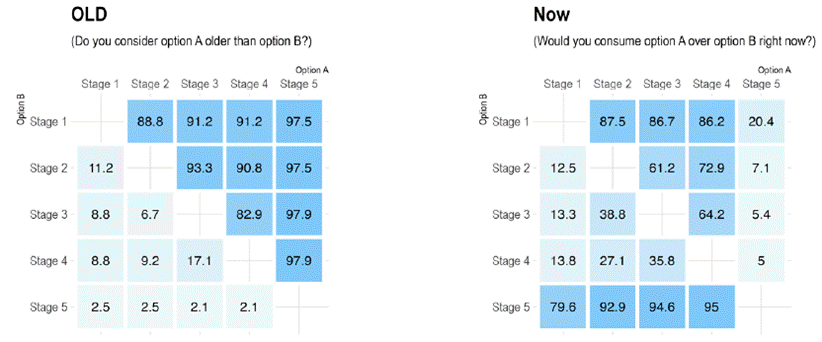
Figures 2 - 4 present the responses to the two questions about the fruit image that was considered the oldest (“old”) and the one that was chosen to be ready to eat now (“now”). Each cell represents the percentage of participants favoring each option. Figure 2 shows the responses for avocado. Regarding the option “old”, 72.1 % of the participants considered stage 3 older than stage 2, and the other 27.9 % perceived the contrary (stage 2 older than stage 3). More than 94 % of the participants’ choice for the old stage coincided with the fruit’s actual stage.
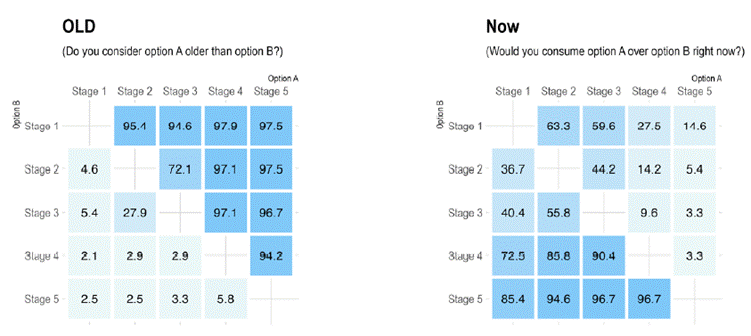
Figure 2 Observed preferences for pairwise comparisons of avocado stages for the “old” and “now” approaches (in %).
The right-hand side of Figure 2 presents the answers to the “now” question; it shows that stage 5 was preferred over stage 1 by 14.6 % of the participants. In this case, it is not easy to determine which stage the participants prefer. Choosing the image that is better for consumption seems to be a complex task.
The results for banana (Figure 3) and lulo (Figure 5) are similar for the “old” question. For guava (Figure 4), the percentage of the participants’ choices that coincide with the fruit’s actual stage was lower than for the other three. The results about which fruit image they would eat “now” show this is a complex question for all fruit types, and it is not easy to determine which stage is preferred and, thus, which picture should be selected.
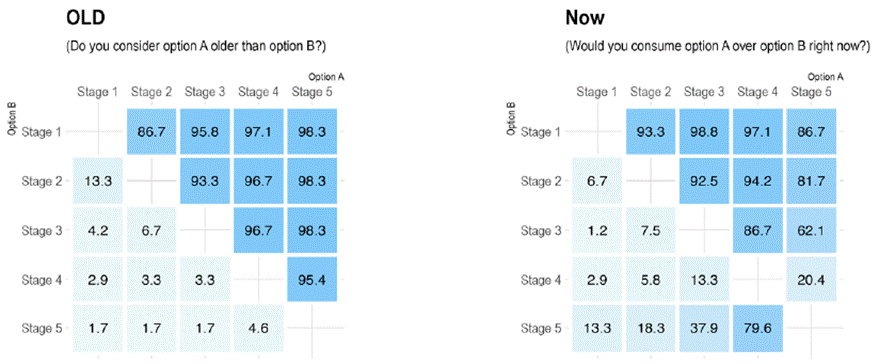
Figure 3 Observed preferences for pairwise comparisons of banana stages for the “old” and “now” approaches (in %).
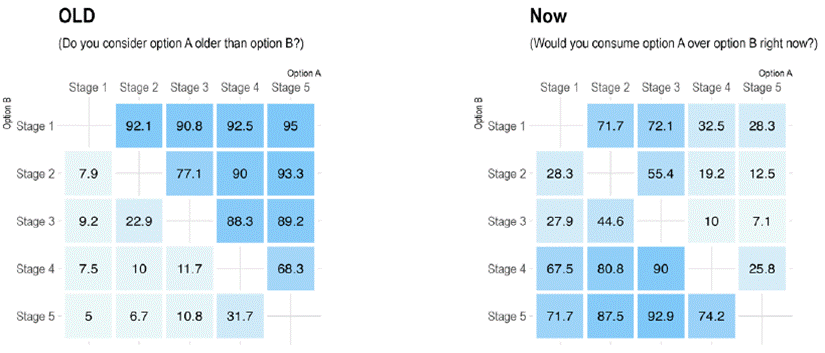
Figure 4 Observed preferences for pairwise comparisons of guava stages for the “old” and “now” approaches (in %).
The model
The Bradley-Terry model (BT) (Bradley and Terry, 1952) is a psychometric model for estimating the likelihood of each item in a set to be favored over the others based on repeated pairwise comparisons of the items. The chance that item is favored over object j (P (i > j) in the BT model ( 1) is expressed as:
Where positive-valued parameters α i and α j reflect the strength of item i and j, respectively. Thus, the s in the BT model are known as the object’s parameters of abilities. These as correspond to the latent variable that measures how an object is favored over another. This latent variable allows to sort the objects and estimate the distance between them regarding their likelihood of being favored.
An alternative parametrization of the BT model is to set λk = "log"( αk). This leads to the logit-linear form ( 2):
The k parameters of the BT model can be estimated using maximum likelihood estimators (MLE). Assuming that the outcome of each comparison is independent [^] (in this study, the order of comparison was randomized to assure this assumption is met), the log-likelihood of the BT model becomes:
where wij denotes the number of times that i is favored over j and nij = wij + wji is the number of comparisons between i and j. Note that wii = 0 .
It is common to restrict the parameter space to simplify the problem, for example, through setting an αi as a baseline (αi = 1). In this case, there are five items (k = 5), and thus five as.
The best match to “now” and “old”
The BT model is a perfect tool to make sense of the collected data. By using the model, a latent variable that allows to choose the right picture for each fruit can be estimated if the objective is to find the fruit that matches a desirable question. Table 1 presents the BT model’s estimated parameters for avocado and for each question. In the estimations, the λ for stage 1 was set as the baseline category, i.e., log-ability of 0. For the “old” question, all stages were more likely to be selected as older than stage 1. Furthermore, the log of the odds ratios shows that individual preferences coincided with the fruits’ actual stage.
Table 1 Estimated odds ratios for choosing the different avocado stages with respect to stage 1

1OR = Odds ratio, CI = Confidence interval.
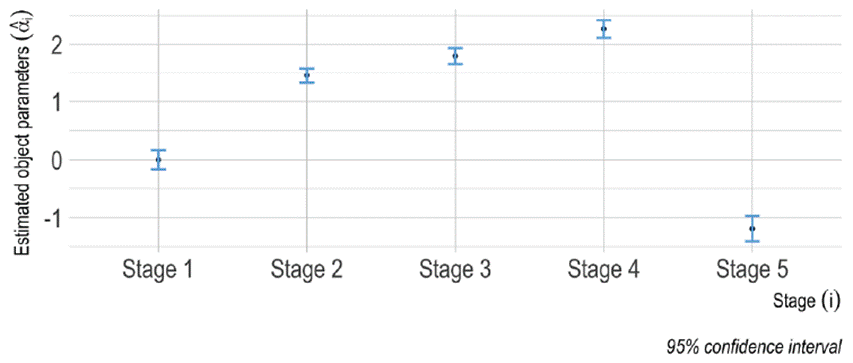
Table 1 also shows the results for the “now” question. In this case, stage 4 is less likely to be chosen to be eaten now than stage 1, and the same occurs with stage 5. On the contrary, a fruit in stages 2 and 3 is more likely to be chosen for consumption (now) than a fruit in stage 1. Figure 6 presents the estimated object parameters for the “now” question and the five avocado stages and their respective confidence intervals using quasi-standard errors (see Firth and De Menezes (2004) for detail on this technique). This approach to calculating the confidence interval corrects the one in Table 1 by considering the possibility of multiple pairwise comparisons (Firth and De Menezes, 2004).
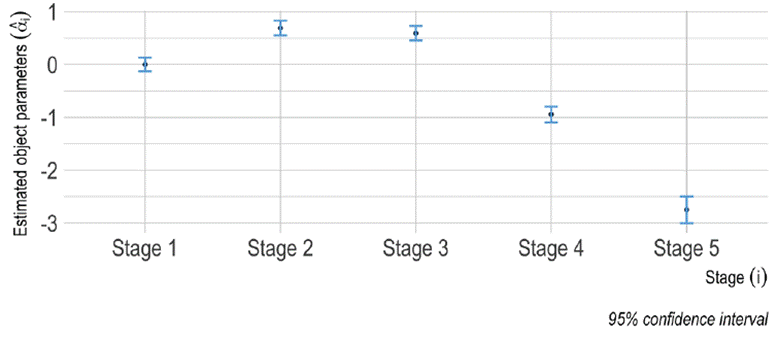
Figure 6 Maximum likelihood estimated parameters and their intervals for the BT model: avocado and “now” approach (intervals based on quasi-standard errors).
The results present an inverted U-shape. Participants choose stage 1 over stages 4 and 5. Moreover, they preferred stage 2 over the other four stages. In other words, the stage 2 image was most likely to be selected to be eaten right away than the other stages (estimated object parameters for banana, guava, and lulo are provided as supplementary material). The results for the “old” question are similar to the results for avocado. For the “new” questions, the results are different. For banana and lulo, stage 4 was preferred to eat now over the other stages (Figures 7 and 8). For guava, the preferred stage was the third (Figure 9).
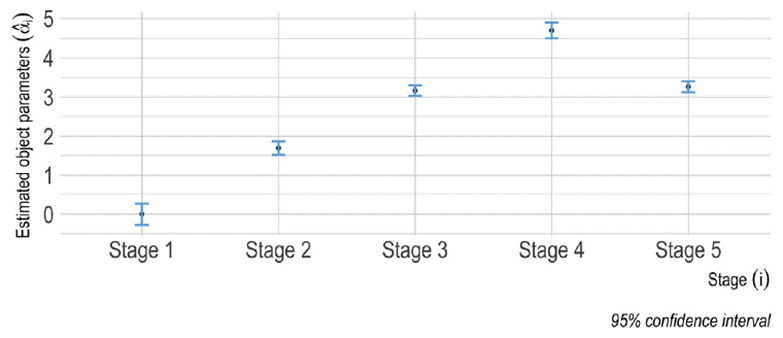
Figure 7 Maximum likelihood estimated parameters and their intervals for the BT model: banana and “now” approach (intervals based on quasi-standard errors).
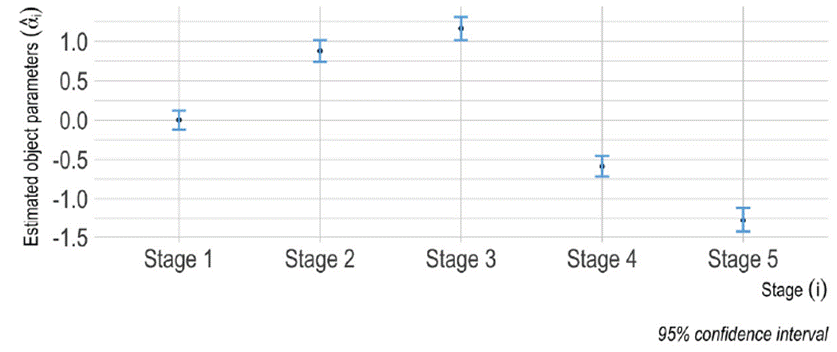
Figure 8 Maximum likelihood estimated parameters and their intervals for the BT model: guava and “now” approach (intervals based on quasi-standard errors).
Discussion
Conducting consumers’ sensory evaluations of fruit and understanding their expectations on fruit’s attributes is a frequent practice (Péneau et al., 2007a). Experts or machines can evaluate technical quality attributes like chemical composition or texture (Redgwell and Fischer, 2002) aiming to imitate the human perception of expected fruit quality (Abbott, 1999). Moreover, if sensory attributes that predict the consumers’ acceptance (Meilgaard et al., 2016) are known, organizations in the production process can calibrate the apparatus that makes the technical assessment (Varela and Ares, 2012), anticipating the quality characteristics of the fruit. The expected quality characteristics can also be transferred to the distribution channels and communication strategies.
However, perceived quality concepts like freshness and ripeness are complex ideas for consumers to evaluate. Defining quality through consumers’ evaluations of specific freshness or ripeness attributes is a troublesome idea because it is a subjective impression (Luo et al., 2020) and because these will vary from one fruit to another. For example, fresh and ready-to-eat passion fruit is associated with its mouthfeel (Deliza et al., 2005). Regarding apples, individuals associate the term fresh with unripe, green flavors, and hard, juicy, and crispy texture (Fillion and Kilcast, 2002; Jaeger et al., 1998; Péneau, 2006; Péneau et al., 2006). Quality also varies for long-life products, like carrots, compared to short- life products, like strawberries (Péneau et al., 2007).
In terms of methods, it was proposed here to evaluate the perceived quality by approaching consumers’ appetite for four types of fruit using the idea of “too old to eat” and “I would eat it now.” The appetite or preference for consumption shows to what extent consumers believe they can eat the fruit at a specific stage. This assumes that a ready-to- eat fruit exhibits the best conditions, is completely developed, and has reached its full growth (Mendoza and Aguilera, 2004; Ramprabhu and Nandhini, 2014). Thus, this research used meaningful consumer ideas to determine the preferred fruit image when they decide it is ready to eat (Alonso et al., 2017), an alternative and complement to technical methods to determine fruit’s quality.
These results show that consumers easily judge the idea of an old fruit (unsuitable for consumption), which helps them decide about whether having the fruit. Ratings for the “old” variable were consistent among the participants and with the actual stage that fruit images showed. However, the idea of a fruit that is ready to eat “now” was not consistent throughout the types of fruit, which supports the subjectivity of the concept and the difficulties in the human assessment of fruit quality (Luo et al., 2020).
This analysis is based on the consumers’ consumption convenience (Westbrook and Angus, 2021) and visual decision-making process. Food is increasingly demanded on digital platforms, and this trend is expected to continue (Schaefer, 2021). Therefore, this study has useful practical implications for the agribusiness industry. The method in this study shows that it is possible to choose the best image to achieve the desired marketing objective, delivering the most appealing and appetizing fruit.
The authors of this study suggest the following steps for those agribusinesses that aim to include a consumer approach within their fruit and vegetable quality standards:
Step 1: Define the marketing objective you want to achieve with the photo (e.g., increase appetite for fruit).
Step 2: Define the related question (e.g., Which one of the two fruits would you choose to consume now?).
Step 3: Conduct an experiment to compare all possible pairs of photos (stages) and collect the data.
Step 4: Perform a graphical analysis to determine whether there is confusion among the participants.
Step 5: If confusion is found, use the Bradley-Terry model to determine the participants’ preferences.
This method could guide agricultural procedures to predict the right time of harvest. For the marketing channel, it helps to understand product exhibitions at the physical point of purchase and online product images. Likewise, the method provides the best images to use in advertisements communicating consumers’ expectations, for example, the image of a fruit that is ready to eat. The same process could be conducted if the purpose is to choose the image that best shows that the consumer could save the fruit for later, for example, if the consumer purchases the fruit today, but wants to store it for the following week.
Limitations and future research
There are limitations that could be considered as opportunities for future research. This study bases on the appearance to evaluate consumers’ appetite for fruit. However, other sensory characteristics like texture and odor (Péneau et al., 2007a) influence the consumers’ perception of fruit quality. A pleasant sensory experience motivates fruit purchase and consumption (Arboleda et al., 2023), as consumers enjoy smelling, tasting, and touching the fruit as they make up their minds.
Moreover, the visual appearance of the fruit brings partial information about its quality; sometimes, fruit can have a good appearance, but it may have lost its textural and nutritional quality (Kader, 2002). Additionally, a visual purchase is more likely for familiar products associated with a positive experience (Vogel et al., 2021). Instead, it does not naturally occur for new food for which other sensory modalities (i.e., odor, taste, texture, temperature, oral processing, and aftertaste) contribute to the learning and decision-making process (Prescott et al., 2022).
Because this research is limited to consumers’ visual assessment of fruit quality as one that is ready to eat (or too old), future research could evaluate other consumer interpretations of visual cues. For example, visual product characteristics can communicate attributes associated with taste (Spence and Levitan, 2021), mouthfeel experiences like thickness and refreshing (Arboleda et al., 2021), and even possible health threats (Garcia-Burgos et al., 2017). Additionally, two main consumption motives of fresh fruit are its health benefits and the experience of pleasure and joy (Arboleda et al., 2023). Future research could evaluate to what extent fruit’s visual attributes could communicate (un)pleasant and health-related information.
Finally, the characteristics of the sample are a limitation because the results were drawn from relatively young individuals who regularly consume fruit. Although it is important to understand and promote fruit consumption among young individuals, who are more likely to purchase online (Eriksson and Stenius, 2022), their fruit preferences and motives differ from more mature individuals (Arboleda et al., 2023). Thus, future research should explore a different context regarding age and familiarity with agricultural products to understand consumers’ capability to assess fruit quality based on visual information.


