English (pdf)
 Article in xml format
 Article references
 Send this article by e-mail
 Cited by SciELO
  Cited by Google
  Similars in
SciELO
Similars in
SciELO  Similars in Google
 Permalink
Introduction
Meat is one of the essential components of the human diet. Meat products from livestock are of great interest because they are a good source of high quality protein and have a good bioavailability of minerals and vitamins. Meat production in Colombia has led the Government to implement policies regarding the modernization of slaughter processes and the transformation of the sector, allowing it to be competitive on the world stage. Urabá is the largest meat-producing area in Antioquia and is certified as free of foot-and-mouth disease (Molina et al., 2021), having an increasing meat export potential.
In addition, due to the development of a good road system in the region, such as the construction of the Highways for Prosperity (Mar I, Mar II, Túnel del Toyo, Transversal del Pacífico) and the future construction of the port Puerto Antioquia, competitiveness and foreign trade for the region is expected to increase.
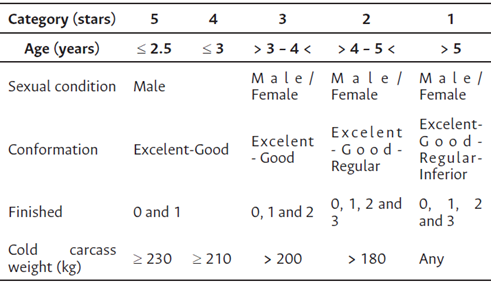
However, it is essential to guarantee the quality of the meat that is estined for the national and international market that will ensure the complete incorporation into these markets. Currently, the classification tool of the Institute of Food Science and Technology of the National University of Colombia (ICTA) used for beef (Table 1) classifies it by stars according to its quality.
Beef is an important source of fat, and its lipid content is influenced by factors such as diet and the production system (Montoya et al., 2015). The main fatty acids in beef are principally saturated and some unsaturated such as oleic acid (C18:1, cis-9) and isomers of conjugated linoleic acid (CLA), especially C18:2 cis-9 (Ladeira et al., 2012). One of the most important problems related to food quality is the lipid oxidation (Kamal Eldin, 2010).
This research sought to characterize the beef from the Urabá region in Antioquia as a basis for setting later quality parameters that allow promoting global competitiveness. Thus, the differences between the lipid content, the fatty acid profile, lipid oxidation products by peroxide (PV), 2-thiobarbituric acid reactive substances (TBARS), and carbonyl values were evaluated.
Materials and methods
Sample collection
The meat cuts corresponded to the neck and loin of bovines (Zebu and Zebu crossbreed steers, with an average age of 2 - 4 years) from the Urabá region, from the municipalities of Arboletes, San Juan de Urabá, San Pedro de Urabá, Necoclí, Apartadó, Carepa, Chigorodó, Turbo, Mutatá, and Murindó. The selection of the animals was carried out randomly on farms registered in the Colombian Agricultural Institute (ICA) with a similar production system, and veterinary and agronomic management. The cattle were slaughtered at the Operadora Frigourabá S.A.S.
A total of 72 muscle tissue samples were analyzed from carcasses classified as 3, 4 and 5 stars (ICTA carcass classification). The samples were vacuum-packed and transferred (-20° C) to the Institute of Food Science and Technology - INTAL in Itagüí, Antioquia, Colombia.
Extraction of fat from beef cuts
5.0 g of meat samples were subjected to acid hydrolysis (100 ml of 4M HCl), after which 200 mL of distilled water was added. Then, the samples were filtered and dried in an oven (103° C,1 h). The extraction was carried out in a Soxhlet equipment (SOX 500 Fat analyzer) with 100 mL of hexane (80° C, 6 h). The residual solvent was dried to constant weight. The fat content was calculated according to Eq. 1:
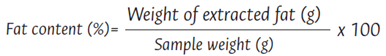 ()Eq 1
Analyses were made in triplicate. Lipid phases were stored (-20° C) for subsequent analysis.
Fatty acid profile
The AOAC method 996.06 was used with some modifications (0.20 g of fat was weighed). The internal standard was 1 ml of glyceryl triundecanoate (5.0 mg/mL in hexane). 5 mL of 14 % boron trifluoride (BF3)/methanol and 4 mL of hexane were added. The sample was placed under open reflux (100° C, 30 min), and 5 mL of water were added. Then, 1 mL was transferred to vials for GC-FID analysis.
1 μL of the sample was injected at a split ratio of 1:50 into a TRACE 1300 gas chromatograph equipped with an autosampler and a flame ionization detector (FID) (Thermo Scientific, United States) at 250° C using helium (131 kPa). Analyte separation was carried out on a DB-FastFAME column (30m × 0.25 mm ID, 0.25 μm, Agilent, United States). The chromatographic conditions were initial temperature of 50° C with a temperature gradient of 30° C/min up to 194° C (3 min hold); subsequently, at a speed of 5° C/min until reaching 240 °C, and maintained for 1 min. The injector temperature was 250° C. Fatty acid methyl esters (FAME) were identified by comparison with the retention times of the fatty acid standard (Food Industry FAME Mix, Restek).
Oxidative stability
Protein oxidation - Carbonyl content
One gram of a previously ground meat sample was homogenized with 10 mL of a solution of 20 mM phosphate buffer and 0.6 M NaCl. Then, one part was treated with 2 mL of 2.0 N HCl (control) and the other with 2 mL of 10 mM 2,4-dinitrophenylhydrazine (DNPH) in 2.0 M HCl and allowed to stand for 1 h at room temperature (25º C). Later, 2 mL of 20 % trichloroacetic acid were added to each sample and then they were centrifuged (5000 rpm, 30 min). Precipitates were washed twice with 5 mL of ethanol/ethyl acetate (1:1, v/v) and then redissolved in 1.5 mL of 6 M guanidine hydrochloride with 20 mM potassium phosphate buffer. Absorbance was measured at 370 nm (Multiskan Spectrum, Thermo Scientific, United States). The results were expressed as nmol of carbonyls per mg of protein using the molar absorption coefficient of 2.2 x 04/M.cm.
Peroxide value (PV)
30 mg of the fat extracted were mixed with 2.5 mL of chloroform/methanol (7:3). The samples were stirred for 10 s and then 125 μL of iron(II) chloride solution and 125 μL of NH4SCN (0.44 mol/L) were added. This mixture was placed in the dark for 10 minutes. Absorbance at 500 nm was determined. The calibration curve was performed using a standard FeCl3 (10 μg Fe/mL). The results were expressed as milliequivalents of peroxides per kilogram of meat fat (mEq/kg), and the peroxide value was calculated according to equation 2:
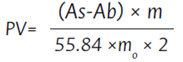 ()Eq 2
Where is the sample absorbance, is the blank absorbance, is the slope obtained from the Fe3+ calibration curve, is the mass (g) of the sample, 55.84 is the atomic weight of iron, and 2 is a correction factor.
Lipid peroxidation (TBARS)
80 μL of trichloroacetic acid (10 g/L) and 160 μL of thiobarbituric acid (60 g/L) were added to 50 mg of the extracted fat. It was heated (90° C, 20 min) and immersed in cold water (10 min). Then, 600 μL of butanol were added. The fluorescence of a 300 μL aliquot was measured at 500 nm at emission wavelength of 520 nm in a spectrofluorometer (Perkin Elmer LS-55). The results were expressed as nmol of malondialdehyde (MDA) per kg of lipid phase using a calibration curve with MDA (Sigma-Aldrich) as standard.
Statistical analysis
Statistically significant differences were determined using the software Statgraphics Centurion XIV (Statgraphics Technologies Inc., Virginia, United States), by one-way analysis of variance (ANOVA) with Student’s t-test. p-values under 0.05 were considered statistically significant.
Results and discussion
Fat content and lipid composition
Table 2 shows the total fat content which varied between 3.557 ± 0.085 and 37.920 ± 0.880 g for 100 g of meat, values corresponding to the tissues neck-category 5-Necoclí and neck-category 4-Murindó, respectively.
At a general level, the total fat content in the neck (11.64 ± 7.25 %) and loin (10.49 ± 5.60 %) cuts did not show statistically significant differences (p < 0.05).
Table 2 Total fat content of neck and loin beef cuts from the Urabá region of Antioquia
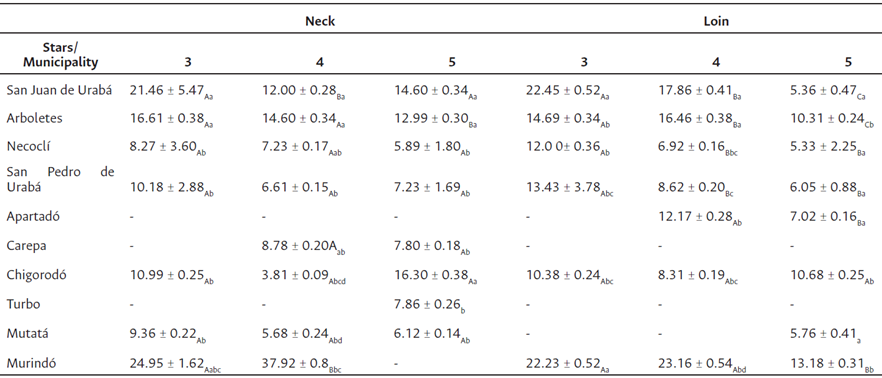
*Values are expressed as g/100 g meat and represent the mean ± standard deviation (n = 3). Different capital letters in the same row indicate significant differences (p < 0.05) among the ICTA category. Different lowercase letters in the same column indicate significant differences (p < 0.05) between municipalities.
The results also showed that the cuts from the carcasses classified as 5 stars had lower percentages of total fat (7.6 g/100 g) than those obtained from the carcasses of 3 (13.9 g/100 g) and 4 (12.2 g/100 g) stars (p < 0.05). This is because the age, weight, the conformation of the carcass and the degree of finish included in the classification are reflected together in the degree of tenderness and juiciness of the meat, providing differentiating quality factors.
It should be noted that the lowest total fat content was found in the municipality of Mutatá with an average value of 6.39 %, while the highest value was in the municipality of Murindó with an average of 24.39 %. This could be explained by the geographical location, since the municipality of Murindó, unlike the other municipalities sampled, is located at lower altitudes, just 25 m above sea level, in an area of very high rainfall and humidity. Therefore, the differences found in the lipid composition are mainly due to geographical locations and climatic conditions, since these are sufficiently important factors to modify the lipid composition (Peña-Saldarriaga et al., 2020).
When comparing the results with those of beef cattle from the Caribbean and Magdalena Medio regions of Colombia, the values are within the reported range (7.41 ± 3.61 g/100 g meat). It should be noted that the diet, the arrangement of lipids in the different muscles, the sex and the age of the animal cause the fatty acid profile to vary to a greater or lesser degree (Vásquez et al., 2008a) and, therefore, the fat content found.
According to the FAO (2019), the general fat of the beef carcass corresponds to 28 g/100 g meat, values that are in line with those found in San Juan de Urabá and Murindó, since the meat from animals from the other municipalities has a much lower fat content.
Tables 3 and 4 show the saturated, monounsaturated, and polyunsaturated fat content of the neck and loin cuts, respectively. The sum of saturated, monounsaturated, and polyunsaturated fats for categories 3, 4 and 5 stars have similar values among them, highlighting that the highest values of saturated, monounsaturated, and polyunsaturated fats correspond to the municipalities of San Juan de Urabá, Arboletes, and Murindó.
Table 3 Saturated, monounsaturated, and polyunsaturated fat from the neck of cattle from different municipalities of the Urabá region of Antioquia
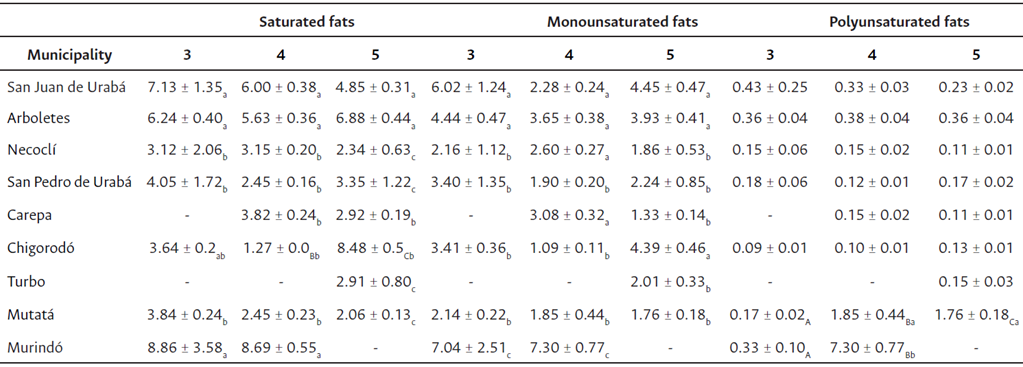
*Values are expressed as g/100 g meat and represent the mean ± standard deviation (n = 3). Different capital letters in the same row indicate significant differences (p < 0.05) among the ICTA category. Different lowercase letters in the same column indicate significant differences (p < 0.05) between municipalities.
Table 4 Saturated, monounsaturated, and polyunsaturated fat from beef loin cuts from different municipalities of the Urabá region of Antioquia
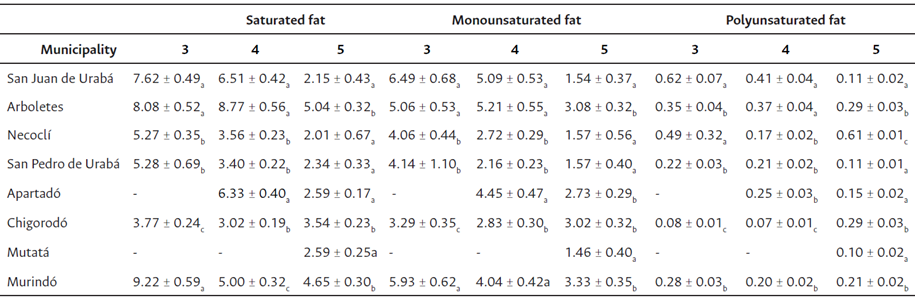
*Values are expressed as g/100 g meat and represent the mean ± standard deviation (n = 3). Different capital letters in the same row indicate significant differences (p < 0.05) among the ICTA category. Different lowercase letters in the same column indicate significant differences (p < 0.05) between municipalities.
The amount of saturated fat in the samples was in the range of 1.230 ± 0.080 to 12.093 ± 0.775 g/100 g, values reached by the samples loin-category 5-Necoclí and neck-category 3-Murindó, respectively. A higher content of saturated fat was related to a higher content of total fat in the meat cuts that had statistically significant differences between the three categories evaluated. The content was lower in the samples from carcasses classified as category 5, followed by category 4 samples, and finally from category 3 samples, which had a higher content of saturated fat. Like total fat, the saturated fat content was higher for meat from 3-star cattle from the municipality of Murindó. In this study, there were no differences for the two cuts evaluated (loin and neck) in terms of saturated fat content, presenting an average value of 6.66 %.
Regarding unsaturated fat, it was in the range 0.98 - 11.117 g/100 g. The highest percentage (92 - 94 %) corresponds to monounsaturated fat, whose range was 0.917 ± 0.095 to 9.240 ± 0.970 g/100 g. The remaining percentage corresponds to polyunsaturated fat, with a range between 0.063 ± 0.006 and 1.937 ± 0.205 g/100 g.
While monounsaturated fat had the same behavior as saturated fat in relation to the classification category, polyunsaturated fat did not have statistically significant differences between the samples from carcasses 3, 4, and 5, showing an average value of 0.24 g/100 g. However, in relation to the analyzed cuts, there were significant differences with a higher polyunsaturated fat content in the loin cuts (0.27 g/100 g) than in the neck cuts (0.20 g/100 g).
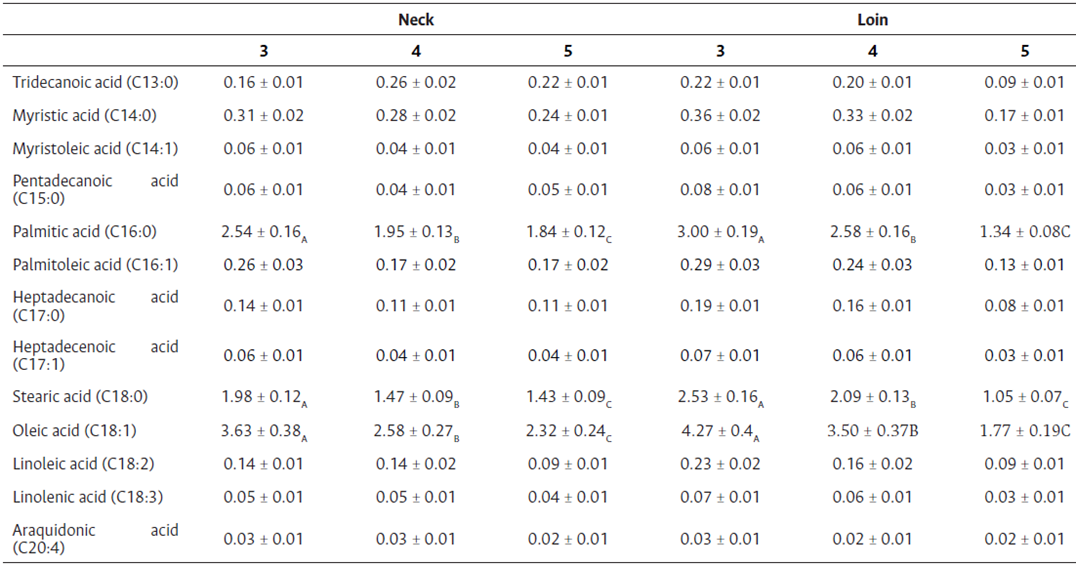
The fatty acid profile is presented in Annex 1, highlighting the participation of palmitic (C16:0) and stearic (C18:0) acids between the group of saturated fatty acids and oleic acid (C18:1) as the majority in the group of monounsaturated fatty acids. Additionally, within polyunsaturated fatty acids, linoleic (C18:2) and linolenic (C18:3) fatty acids had a higher percentage in composition.
Montoya et al. (2015) evaluated the content of fatty acids in beef in the Colombian tropics. They found that the main components were fat palmitic acid and oleic acid. Vásquez et al. (2008b) evaluated the fatty acid profile in samples from the regions Caribe and Magdalena Medio (Colombia) and found that oleic, palmitic, and stearic acids were in greater proportion. According to Vásquez et al. (2008b), the amount of intramuscular fat is susceptible to changes determined by genetic variation and/or the environment.
When comparing the results obtained from beef cattle with other species such as lamb (bred in Brazil), the content of saturated (37 g/100 g meat), monounsaturated (40 g/100 g meat) and polyunsaturated (15 g/100 g meat) fatty acids (Faria et al., 2012) is much higher than that found in this study. Both for lamb and chicken, the main saturated and monounsaturated fatty acids are the same as those of beef (monounsaturated fatty acids C18:1, and Cis-9, and saturated fatty acids C16, and C18 (Faria et al., 2012; Peña-Saldarriaga et al., 2020)). Since the feeding routine in the evaluated farms is the same, the only difference is due to their geographical location and climatic conditions, allowing the conclusion that these are sufficiently important factors to modify the lipid composition (Peña-Saldarriaga et al., 2020).
The fatty acid profile of ruminants is generally less affected by the diet composition compared to meat from non-ruminants (Teira et al., 2006).
In extensive production systems, cattle are fed exclusively on grass, until slaughter. Under these conditions, the main fatty acids are palmitic (C16:0) and stearic (C18:0) among saturated fatty acids, oleic (C18:1) and palmitoleic (C16:1) among monounsaturated fatty acids, and linoleic (C18:2) and linolenic (C18:3) among polyunsaturated fatty acids (Teira et al., 2006), just as the composition found in this study (Annex 1). Given the relationship between the high consumption of saturated fatty acids and the increase in blood cholesterol levels, it is recommended not to consume more than 30 % of energy from fat, limiting calories from saturated fatty acids to less than 10 % and the rest from unsaturated fatty acids (FAO, 2019). In addition, unsaturated fatty acids fundamentally belonging to the omega series can be highlighted to play an important role due to their association with the prevention of inflammatory, pulmonary, cardiovascular, and skin diseases (Montoya et al., 2015).
Oxidative stability
Protein oxidation - Carbonyl content
Carbonylation is generally recognized as one of the most notable chemical modifications in oxidized proteins (Ha et al., 2019), thus reducing protein bioavailability in the organism and deteriorating the quality of meat (Choe et al., 2017). The carbonyl value provides an estimate of the content of aldehydes and ketones that are formed as secondary oxidation products during lipid oxidation (Kamal Eldin, 2010), causing the tissue to become hard, since there is a loss of water retention that also generates an unpleasant taste (Domínguez et al., 2022).
Figure 1a shows that the number of products obtained from protein oxidation increases as meat quality decreases (p < 0.05), showing an association between fat and carbonyl content in meat. In this study, the carbonyl content of loin cuts was found to be between 4.48 ± 0.21 nmol/mg protein (category 5 stars) and 13.04 ± 0.29 nmol/mg protein (category 3 stars).
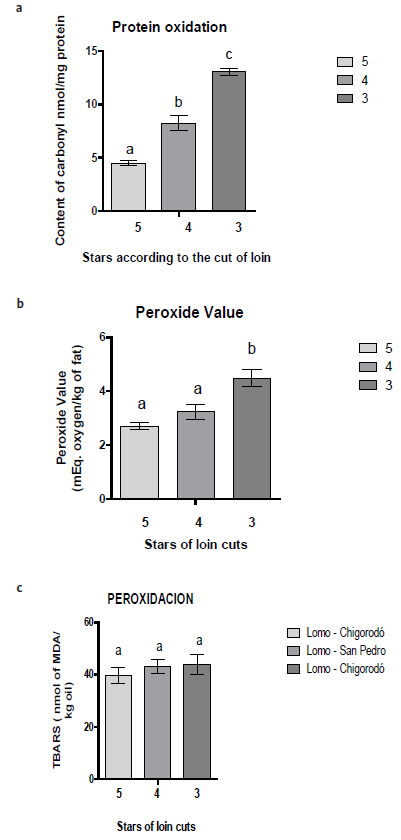
Figure 1 a. Carbonyl content (nmol/mg protein) in beef loin cut; b. Lipid oxidation-value of peroxides in beef for loin cuts from the Urabá region of Antioquia, according to the ICTA star classification; and c. Lipid oxidation-malondialdehyde (MDA) values in beef loin cuts, according to the ICTA star classification. The values correspond to the mean ± standard deviation (n = 3). Different letters indicate statistical differences (p < 0.05).
The lowest value of carbonyl content was higher than that reported in the study by Ha et al. (2019) for both fresh and dried meat (~0.5 nmol/mg protein) and from Bos taurus animals from Australia. In a study by Lindahl et al. (2010), the carbonyl content in loin cuts from Swedish Holstein bulls was ~2 nmol/mg protein, much lower than that reported in this study. In addition, meat from Helsinki (Finland), with a fat content of 9.39 %, had a carbonyl content of approximately 2.3 nmol/mg protein (Armenteros et al., 2009), which is a value equally lower than that found in this work. These differences can be explained since intrinsic factors such as the animal’s species, the animal’s origin (genetic and environmental factors during production), the type of muscle, and the composition of the product influence protein oxidation (Domínguez et al., 2022).
Regarding the content of carbonyl in other meats, in chicken meat it was 0.755 nmol/mg (Souza et al., 2022), and raw pork meat products had 0.80 - 3.60 nmol/mg of protein (Choe et al., 2017). Thus, beef is more susceptible to protein oxidation compared to meat from other animal species.
Peroxide value (PV)
In figure 1b, the value of peroxides obtained in the loin cuts shows no significant differences for this value between the samples classified with categories 4 and 5, but there are differences with category 3.
The value of peroxides was between 2.71 ± 0.12 and 4.48 ± 0.31mEq.O2/kg of fat, corresponding to the loin cuts of categories 5 and 3 stars. These values are within the permitted range (maximum 10 mEq.O2/kg of fat) according to the Codex Alimentarius.
The peroxide values found in this study were higher than those reported by Rahman et al. (2015) in the meat of beef round cuts (0.12 and 0.166 meq/kg), and Gheisari (2011) in loins of Holstein cattle (0.12 mEq.O2/kg). Similarities were found in the value of peroxides in the 5-star category (2.71 ± 0.12 mEq.oxygen/kg of fat) of beef, goat, and ground beef (2.4 ± 0.8, 2.5 ± 0.8, and 2.6 ± 0.8 mEq.O2/kg) reported by Dabasso et al. (2018). Compared to meat from other species such as camel (0.15 mEq.O2/kg) and chicken (0.08 mEq.O2/kg) (Rahman et al., 2015), the values of peroxides reported in this work are still higher.
Generally, the oxidation processes generate a gradual reduction in sensory quality, such as changes in color, texture, appearance, and smell, as well as rancid taste, influencing consumer acceptance (Domínguez et al., 2019).
Lipid peroxidation (TBARS)
TBARS values ranged between 39.62 ± 3.13 and 43.89 ± 3.76 nmol equivalent to MDA/kg of oil. MDA is one of the most important aldehydes produced during the secondary lipid oxidation of polyunsaturated fatty acids. Its determination is relevant in meat because, in low quantities, it produces rancid odours (Domínguez et al., 2019). As shown in Figure 1c, no statistical differences (p < 0.05) were found in the evaluation of lipid oxidation. This behavior can be explained since this analysis is based on secondary products from the oxidation of unsaturated fatty acids and considering that the three categories analyzed (3, 4 and 5 stars) did not show significant differences regarding its content of polyunsaturated fatty acids.
Some studies have established values of 2.0 - 2.5 mg MDA/kg as the accepted limit in which there is no rancidity in meat and meat products (Domínguez et al., 2019), values that were not exceeded in this study, which indicates the good quality of the samples.
Conclusions
It is necessary to update the current classification system (ICTA) for beef cuts, especially considering the potential export opportunities from the Urabá region in terms of increasing access roads, and regarding the fact that Urabá is the largest meat-producing area in Antioquia department. In that sense, the characterization with respect to the fat content, the lipid profile, as well as the oxidation indicators of the meat from the different municipalities of the Urabá region of Antioquia will be used as a basis for a future implementation of a meat quality seal to enhance marketing. These results will allow an expansion of the classification of beef carcasses according to the quality of the meat produced in the region, providing tools to establish quality standards that allow entering new markets, achieving greater competitiveness of livestock products, strengthening local capacities, and generating new economic growth opportunities for the region.