


 Inglês (pdf)
 Artigo em XML
 Referências do artigo
 Enviar este artigo por email
 Citado por SciELO
  Citado por Google
  Similares em
SciELO
Similares em
SciELO  Similares em Google
 Permalink
INTRODUCTION
In 2014, Colombia produced 6.87 million tons of fresh milk, making it the third largest milk producer in South America, after Brazil and Argentina (Faostat 2017). The majority of milk produced in Colombia (82.7%) is used for fresh consumption, transformation into cheese or milk derivatives (DANE 2015) or processed primarily by dairy industries (63.9%).
There are two main cow milk production systems in Colombia: specialized dairy production and dual-purpose dairying. Specialized dairy production is carried out in high-altitude areas (>2,000 m above sea level [a.s.l.]) (Correa et al. 2012); it mostly uses Holstein-Friesian cows (Bos taurus) and generally produces 12-14 L of milk per day, but can yield up to 27 L per day with highly technical systems (Calderón et al. 2006; Carulla and Ortega 2016). In contrast, dual-purpose dairying occurs mainly in areas below 1,200 m a.s.l. or between 1,200 and 2,000 m a.s.l., and it uses crossbred cows (e.g., B. indicus χ B. taurus), particularly those having indicus breeds as one of the parents, with once a day milking (3-5 L day-1) with the calf present (Holmann et al. 2003). There is also a population of 248,893 river buffaloes (Bubalus bubalis) in Colombia (Ruiz 2016), an undetermined percentage of which produce milk with or without calves present.
In both production systems, milk quality is evaluated according to its chemical composition (fat, protein, and total solids [TS]) and hygienic and sanitary status (i.e., number of somatic cells and colony-forming units), which determine its innocuous and health statuses and durability following extraction from the mammary gland (Olivera 2007). In 2012, the Colombia Government established Resolution 0017 of 2012, which introduced a quality-based milk payment system that led to the accreditation of several laboratories that measure milk quality.
The variability that is inherent in each production system affects the compositional quality of milk. According to Rivera et al. (2015), milk quality is strongly influenced by diet, genetics, stage of lactation, and herd management, as well as various factors related to the environment and animals themselves, such as the number of calves's, days of lactation, and age in cows (Cerón et al. 2003) and buffaloes (Alichanidis et al. 2016; Cerón-Muñoz et al. 2002; Silanikove et al. 2016). However, these factors only lead to temporary changes in milk quality and are limited by the genetic potential of each animal (Hurtado-Lugo et al. 2005). Similarly, Godden et al. (2002) reported that changes in the hygienic and sanitary status of milk can be influenced by factors such as cleaning routines, udder disinfection, and milking hygiene processes. Therefore, the ability to predict milk quality according to its chemical composition and hygienic and sanitary status based on national and international standards could serve as an early warning scheme for determining factors that cause deterioration in milk quality.
The aim of this study was to classify and characterize the compositional quality of river buffalo milk and cow milk (dual purpose and specialized) in Colombia, which are analyzed in the Laboratory of Quality and Safety of Milk of the School of Agricultural Sciences at the University of Antioquia, Colombia.
MATERIALS AND METHODS
Data were obtained from the individual records of7,726 river buffaloes and 49,330 cows held by the milk quality laboratory. The fat, protein, and TS contents of each sample were assessed using infrared spectroscopy with CombiFossTM (FOSS, Hiller0d, Denmark).
Each database was filtered by eliminating incomplete cases and ensuring that each variable was normally distributed using the Kolmogorov-Smirnov test). In addition, to solve the multicollinearity issues in the databases, factor analysis was performed by applying the "varimax" rotation, which resulted in a single factor being obtained that retained >80% of the variation in each dataset.
Cluster analysis was applied to the corrected cow and river buffalo milk databases to classify the observations into homogeneous groups based on their characteristics (Hair et al. 2009). This was performed using the Euclidean distance and Ward's method with the "hclust" function of the R statistical package (version 3.3.2 2016). The standardized data were then characterized by measures of central tendency and dispersion and classified into three milk groups (Normal [N], High Quality [HQ], and Poor Quality [PQ]) according to previously published criteria for cow milk (Calderón et al. 2006; Olivera 2007; Tafur and Nieto 2011; IFCN 2014) and buffalo milk (Zicarelli 2004; Tripaldi 2005; Borghese 2006; Tonhathi et al. 2008; Asobúfalos 2016).
Multivariate analysis was then performed to 1) classify the milk samples into homogeneous groups according to similarities in their chemical compositions and 2) generate discriminating functions that categorize the milk samples. Each database, and each milk quality category within it, was divided into two random sets using the "sample" statement of the statistical package R. The first set corresponded to the training database, which included 70% of the information contained in the original database (records for 5,094 buffaloes and 34,261 cows). This database was used to generate discriminating functions that allowed the milk samples to be allocated to one of the three specified groups according to their compositional quality variables based on the following linear function:

In this procedure, the "lda" function of the MASS package in R was applied.
The second set, which corresponded to the validation database, contained the remaining 30% of information and was used to evaluate the predictive capacity of the discriminating model with the predictive function of R (Team 2016). The resulting data were presented as a percentage of correctly classified records according to the discriminating analysis.
RESULTS AND DISCUSSION
River buffalo milk
Table 1 shows the results of the cluster analysis based on the compositional quality of river buffalo milk samples. The PQ group had lower fat, protein, and TS contents than the N group (-3.5%, -0.58%, and -3.92%, respectively), while the HQ group had higher fat, protein, and TS contents than the N group (+4.36%, + 1.11%, and +4.59%, respectively).
Table 1 Grouping and classification of river buffalo milk samples based on compositional parameters.
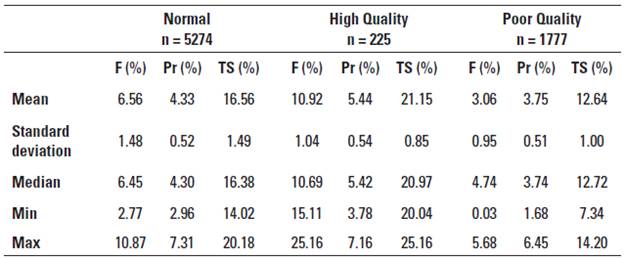
F: Fat; Pr: Protein; TS: Total Solids.
Cluster analysis based on records from 7,276 river buffaloes using the Euclidean distance and Ward's method. F: fat, Pr: protein, TS: total solids.
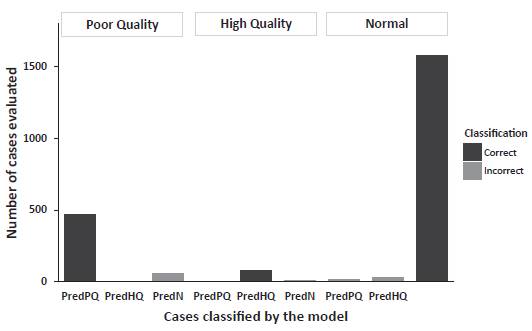
Discriminating analysis derived the discriminant functions [-0.4468746 * Fat -0.6466362 * Protein + 1.247154 * TS] for the first canonical axis and [-3.009441 * Fat - 3.822396 * Protein + 3.358929 * TS] for the second canonical axis.
Evaluation of the predictive capacity of the discriminant model using the validation dataset (2,182 records; Figure 1) indicated that 90.2% of the entries for the PQ group were correctly classified, with 10.8% being misclassified into the N group. For the N group, the discriminant model correctly classified 97.8% of the entries, with 0.9% being misclassified into the PQ group and 1.2% into the HQ group. Finally, for the HQ group, the Discriminating model correctly classified 95.4% of the entries, with 4.6% being misclassified into the N group.
Cow milk
Table 2 presents the results of the cluster analysis based on the compositional quality of cow milk. It was found that the PQ group had lower fat, protein, and TS contents than the N group (-0.93%, -0.29%, and -1.82%, respectively), whereas the HQ group had higher fat, protein, and TS contents than the N group (+1.82%, +0.64%, and +2.4%, respectively).
TABLE 2 Grouping and classification of cow milk samples based on compositional parameters.
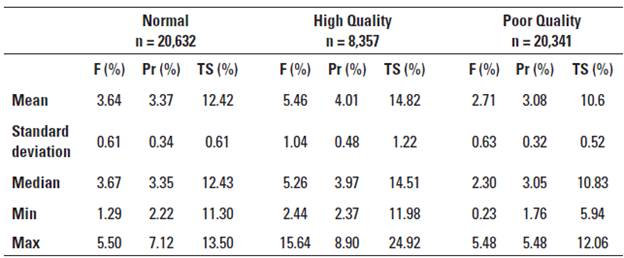
F: Fat, Pr: Protein, TS: Total Solids.
Discriminating analysis derived the discriminant functions [-0.8000 * Fat - 0.83302 * Protein - 0.81643 * TS] for the first canonical axis and [0.28357 * Fat - 1.41197 * Protein + 0.95887 * TS] for the second canonical axis.
Evaluation of the predictive capacity of the Discriminating model using the validation dataset (14,683 entries; Figure 2) indicated that 99.2% of the entries for the PQ group were correctly classified and 0.79% were misclassified into the N group. For the N group, the Discriminating model correctly classified 98.8% of the entries but misclassified 1.2% into the PQ group. Finally, for the HQ group, the Discriminating model correctly classified 85.5% of the entries but misclassified 14.4% into the N group.
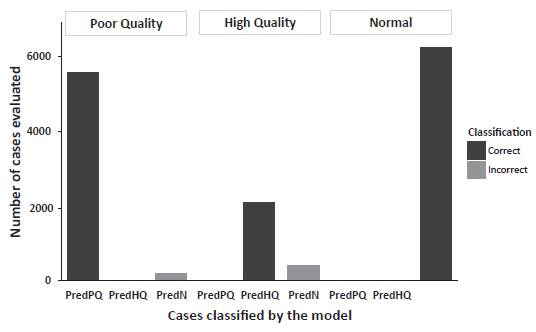
Pred. N: predicted Normal milk / Pred. HQ: predicted High Quality milk / Pred. PQ: predicted Poor Quality milk.
FIGURE 2 Validation of the discriminant model for cow milk using unknown samples.
This is the first report on the compositional quality of milk samples from large numbers of river buffaloes and cows in Colombia. The average values that were obtained in the N group for cow milk for fat (3.64%), protein (3.37%), and TS (12.42%) were close to the upper limit reported by Calderón et al. (2006) (fat: 3.3%-3.5%; protein: 2.8%-3.2%; and TS: 11.8%-12.0%). However, they were similar to values reported for region 1 of Colombia, which includes Antioquia, Cundinamarca, Boyacá, and Nariño (fat: 3.5%; protein: 3.1%) and similar to those reported for region 2, which constitutes the Caribbean Region of Colombia (fat: 3.7%; protein: 3.3%) (Carulla and Ortega 2016).
The composition of cow milk in the PQ group (2.71% fat, 3.08% protein, and 10.6% TS) was within the range reported by Calderón et al. (2006) for fat (<3%) and TS (<11.3%) but not for protein (<2.6%). Furthermore, based on the Ministry of Social Protection decree 616 of 2016, only the protein content for the PQ group met the requirements of milk suitable for human consumption (minimum of 3% fat, 2.9% protein, and 11.3% TS).
The average fat (5.46%), protein (4.01%), and TS (14.82%) contents of cow milk in the HQ group were well above the values reported by Calderón et al. (2006), which indicated that the milk was of excellent quality (3.5%, 3.2%, and 12.1%, respectively).
The IFCN (2014) stated that cow milk needs to contain 4% fat and 3.3% protein to establish a common basis for comparison with cow milk from other countries. The milk samples that were clustered in the N group in this study complied with this international standard for protein, but not for fat.
The fat, protein, and TS contents in the N group for river buffalo milk (6.56%, 4.33%, and 16.56%, respectively) were similar to those reported by the ACB (2016) in four regions of Colombia (Córdoba, Antioquia, Santander, and Cesar) for fat (6.67%-8.08%) and protein (4.25%-4.57%) but were below those reported for TS (17.35%-19.21%). By contrast, the HQgroup for river buffalo milk had higher values for all three components (10.92% fat, 5.44% protein, and 21.15% TS) than previously reported in Brazil by Tonathi et al. (2008) (fat: 5.8%-7.9%; protein: 3.7%-4.6%; and TS: 16.2%-18.3%) and Patiño (2004) (fat: 6.63%-7.34%; protein: 3.93°/0-4.42%0; and TS: 16.31%-17.49%).
For both river buffalo and cow milk, the cluster analysis classified observations with poor milk quality values as PQ. Hair et al. (2009) indicated that this multivariate technique groups observations that have the shortest distance between them to achieve conglomerates with the greatest similarities in variability and the greatest dissimilarities between groups. For all milk samples in the PQ group, grouping was generated based on the nature of the variables and because there may be multifactorial situations on the farm that adversely affect these milk samples (Juárez-Barrientos et al. 2016).
A previous study has shown that several additional factors also affect the quality of milk, including genetic, dietary, and environmental factors (Palmquist et al. 1993), as well as factors that are associated with specific management practices on a particular farm (Godden et al. 2002; Chen et al. 2017). The PQ group commonly had fat as the most variable fraction, which in turn modifies the TS content (fat + protein + Lactose + ash = TS), supporting previous findings that the protein fraction is the most difficult to modify (Sutton and Morant 1989).
This cluster analysis and classification based on milk quality will facilitate the identification of potential samples that include specific factors that affect the deterioration of milk and will also allow preventive or corrective measures to be taken to improve the quality of milk produced (Juárez-Barrientos et al. 2016). Thus, laboratories that analyze the compositional quality of milk will be able to provide early warnings that indicate a deterioration in the compositional quality, based on which the technical assistant or the owner of the herd will be able to consider which factors could be altering the composition of the milk at the farm level.
The fat content of milk is affected by factors such as grain intake by the animal, fat supplementation, age of the animal, number of days of lactation, body condition (BC) score, seasonal and regional effects, mastitis, and even prolonged storage of the milk samples (Schwendel et al. 2015; Chen et al. 2017). In addition, Patiño (2004) suggested that the fat and TS contents of buffalo milk are widely influenced by external factors, including the breed and stage of lactation for Murrah and Mestizas breeds, while Tufarelli et al. (2008) claimed that the fat content of the milk of Mediterranean buffaloes was affected by the level of milk production, with higher fat contents in high-productivity farms (8.33 kg animal-1 day-1) than in low-productivity farms (4.54 kg animal-1 day-1) (8.64% vs. 7.68%, respectively), possibly as a result of differences in dry matter intake. Similarly, Anitha et al. (2011) indicated that BC score affects the fat content of milk, varying from 5.2% in animals with BC scores of 2.5-2.99 to 8.46% in animals with BC scores of 4.00-4.49.
López et al. (1992) argued that the use of discriminating analysis to categorize milk samples determines the relationship between those variables that best predict the category or group to which a sample belongs based on a linear equation that will be able to predict the categorization of unknown samples. In the present study, discriminating analysis generated discriminant functions by which milk samples could be grouped based on their fat, protein, and TS contents. Furthermore, both the river buffalo and cow milk discriminant models showed high performance in the identification of unknown samples (validation dataset), with >90% accuracy for classifying milk samples into the N and PQ groups and >85% accuracy into the HQ group.
There are more specific metabolites that could predict the quality of milk in a dairy production system, such as acetone, lactic acid, and milk urea nitrogen (Steen et al. 1996; Melzer et al. 2013; Colman et al. 2015). However, the identification of the PQ group, as outlined in the present report, would be a suitable first line ofalert to allow further inspection of factors that may be causing deterioration in milk quality.
CONCLUSIONS
In total, 13.6% of river buffalo's milk and 86.4% of cow's milk produced in Colombia were analyzed at the University of Antioquia. Similar numbers of cow's milk samples were classified into the N and PQ groups, with a relatively low number being classified into the HQ group, whereas a higher proportion of river buffalo milk samples were classified into the N group. Discriminant models for both river buffalo and cow milk classified milk samples with >90% accuracy into the N and PQ groups and >85% accuracy into the HQ group. Laboratories testing the compositional quality of milk by cluster analysis will be able to provide early warnings indicating an eventual deterioration in the compositional quality.


