


 English (pdf)
 Article in xml format
 Article references
 Send this article by e-mail
 Cited by SciELO
  Cited by Google
  Similars in
SciELO
Similars in
SciELO  Similars in Google
 Permalink
INTRODUCTION
In order to make profits in the stock market investors and money managers search and interpret information from different sources, including sell-side analysts' valuations. As described in the Occupational Outlook Handbook of the United States Department of Labor, financial analysts evaluate investment opportunities and provide advice or guidance to investors. For instance, as documented by Cheng et al. (2006), "Warfield Associates, Inc. offers a growth fund with total assets of $161 million. With an investment approach of fundamental (earnings) and bottom-up (focus on companies), the fund places a weight of 80% on research produced by SSAs [analysts], 15% on research by BSAs [buy-side analysts], and 5% on independent research". In particular, sell-side analysts, hereafter named as analysts, work for brokerage firms, and their income is linked to the revenues (commissions) of their brokerage houses.
Although forecast accuracy and reputation are important for analysts (see e.g., Stickel, 1992), different sources of biases in their stock recommendations have been identified in the academic literature. For instance, according to Womack's (1996) hypothesis, an analyst might bias his recommendation because he perceives that the cost of issuing a sell recommendation is higher than the cost of a buy recommendation. More specifically, "sell recommendations can harm a brokerage firm's present and potential investment banking relationships, and thus are discouraged by the firm's investment bankers. Second, top management and investment contacts may limit or cut off the flow of information if an analyst issues unfavorable ratings". Moreover, "optimistic analysts generate more trade for their brokerage firms" (Jackson, 2005). Nevertheless, any of these studies analyze the relationship between analysts' disagreement and projected losses.
In this paper we carry out cointegration analyses, in order to study whether the relationship between recommendations and projected capital gains (or losses), is consistent with the hypothesis that sell recommendations are costlier than buy recommendations. If there is no difference in costs or gains between sell, hold and buy recommendations, then the dispersion in analysts' recommendations should have no relationship with the current price or the projected price, since analyst disagreement in recommendations should not be explained by their projected expected loss or gain. Furthermore, the number of cases in which the projected stock price (target price) is positively related to the number of buy recommendations, should be approximately equal to the number of cases in which the target price is negatively related to the number of sell recommendations. Similarly, the number of cases in which the current stock price is negatively related to the number of buy recommendations, should be approximately equal to the number of cases in which the stock price is positively related to the number of sell recommendations (buy cheap, sell high).
We find that analysts' recommendations react stronger for expected capital gains than to expected losses, which is consistent with systematic optimism, and that dispersion in analysts' recommendations is positively related to expected losses, which shows that analyst disagreement has potential value as a piece of information for stock markets. We argue that, as sell recommendations are costlier than buy recommendations, when analysts face the decision of issuing a recommendation for a stock with expected losses, many of them do not reveal their true beliefs by issuing a sell recommendation but react mildly by issuing a hold or a buy recommendation. We can rule out the hypothesis that these findings are consistent with cognitive biases that lead to overvaluation and under-valuation given that we observe strong reactions in one direction only. We can also rule out differences in risks since target prices incorporate this information already.
This research relates to two strands of literature. First, this study is related to the literature upon the usefulness of analysts' reports and, second this research relates to the existing literature on sell-side analysts biases. For practitioners, this paper helps in the understanding of the informational content of analysts' reports found in sophisticated information systems such as Bloomberg.
There are seven sections including the introduction. In section two we show the literature related to market reactions on sell-side analysts and on the information conveyed in analysts' reports. In sections three, four and five, we show our data, variables, and empirical strategies. Finally, in sections six and seven we show our results and conclude.
RELATED LITERATURE
Analysts are important for stock markets as a source of information. In this line, authors such as Malmendier and Shanthikumar (2014), Hilary and Hsu (2013) and Mikhail et al. (2007) empirically find that stock returns respond to analysts' forecasts. In addition, Cheng et al. (2006) find that equity funds increase the use of analysts' research, relative to buy-side analysts' reports, when their coverage on the stocks held by the fund is higher, or when the average error in their earnings forecasts is smaller, or when the standard deviation of their forecasts is smaller. Furthermore, Li et al. (2021) study the dispersion in analysts' target prices and find that it is positively related to future stock risk.
Notwithstanding there is plenty of empirical evidence on stock returns reactions to analysts' reports, the evidence about how useful is the prospective information issued by analysts is far from being conclusive. On the one hand, there is evidence in support of the idea that analysts' recommendations have investment value. Stickel (1992) concludes that his results "suggest that analysts are able to detect the extent to which a stock is overvalued or undervalued"; Joos et al. (2016) find that, when an analyst is asked to establish an upper bound and a lower bound to his valuation, the spread between the bounds is associated with firm characteristics that capture the riskiness of shareholder's equity; Womack (1996) finds that new added-to-sell recommendations and new added-to-buy recommendations have a predictive power on stock returns, and Howe, Unlu and Yan (2009) "provide evidence that changes in aggregate analyst recommendations predict future market and industry returns". On the other hand, Jegadeesh et al. (2004) find that sell-side analysts tend to recommend stocks with positive momentum, high growth and high volume, and thus express that "to the extent that their opinion affects public sentiment, this evidence is consistent with the view that they contribute to noise trading in the market". Furthermore, Francis and Soffer (1997) empirically find that investors attach larger weights to the earnings forecast revisions in reports containing buy recommendations.
In addition, the literature also shows that sell-side analysts tend to issue optimistic forecasts. For instance, Easterwood and Nutt (1999) find that analysts overreact to past changes in earnings per share in the upper quartile of the distribution, and that they also underreact to past changes in earnings per share in the lower quartile, which is consistent with systematic optimism. Furthermore, Cowen et al. (2006) and Jackson (2005) show that analysts issue positively biased forecasts in an attempt to increase the trading volume of the stocks they cover, given that their income depends upon the revenues of their brokerage firms. Nevertheless, none of these papers study analysts' disagreement or if analysts are willing to issue clear sell recommendations whenever there are projected capital losses.
DATA AND PRELIMINARY EVIDENCE
In this paper we use data from Bloomberg on publicly listed companies on stock markets. This information includes series of daily prices, consensus analysts' price targets (stock price forecast for the next 12 months), number of recommendations, and the number of buy's, hold's and sell's, for 45 firms (stocks) belonging to different sectors of the S&P 500 index from January 1st 2013 to December 31st 2018 (each variable has a total of 70,425 observations) for a total of 422,550 observations. We focus on stocks traded in exchanges of the U.S. since the sell-side analyst profession has been very active in the United States for various years. The sectors (weights in parenthesis) to which the stocks belong correspond to Energy (2.92%), Financials (10.39%), Industrials (8.02%), Consumer Discretionary (10.72%), Consumer Staples (7.03%), Health Care (14.68%), Communication Services (10.94%) and Information Technology (26.82%).
A superficial look at the data provides some suggestive patterns. For instance, in figures 1 and 2 we show the performance and prices of stocks issued by companies engaged in Internet related businesses as those included in the NASDAQ Internet Index (QNET), between the third quarter of 2012 to the fourth quarter of 2016. As we can see in the figures, during this period of more than 4 years, the operating margins and return on capital of firms in this sector showed negative trends which suggest a decrease of the intrinsic values of the stocks issued by companies in this sector. Nevertheless, the stock prices followed a positive trend. This cannot be regarded as a proof of any kind, that intrinsic values are indeed lower to the stock price during this period, according to some absolute measure or valuation model and it is not our attempt in this paper, to draw conclusions on intrinsic values or to obtain a measure of fundamental values. What this does suggest, is that fundamentals did not support the long and permanent raises in stock prices, occurred during four years.
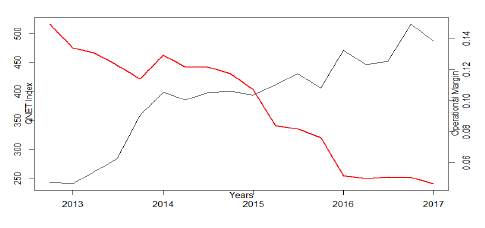
Source: Bloomberg. The black line represents the QNET Index values, and the red line corresponds to the Operating Margin of the sector as reported by Bloomberg.
Figure 1 QNET Index and Sector Operating Margins. Q32012-Q42016
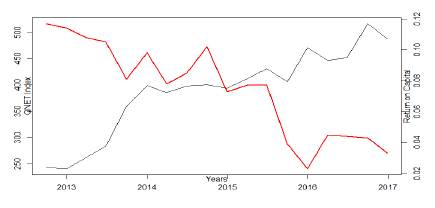
Source: Bloomberg. The black line represents the QNET Index values, and the red line corresponds to the Return on Capital of the sector as reported by Bloomberg.
Figure 2 QNET Index and Sector Return on Capital. Q32012-Q42016
Although it is not our attempt in this paper to explain the causes of this event, research in finance provide some possible explanations on why investors would keep buying stocks issued by companies with poor performances, which include synchronization problems (Abreu & Brunnermeier, 2003), asymmetries of information (Allen et al., 1993; Zhang & Zheng, 2017) and the presence of positive feedback traders (De Long et al., 1990). Interestingly, we also find a similar behavior of firm performance and stock prices at the individual level for Mercado Libre Inc. (Figure 3) and its corresponding American Depositary Receipt (ADR).
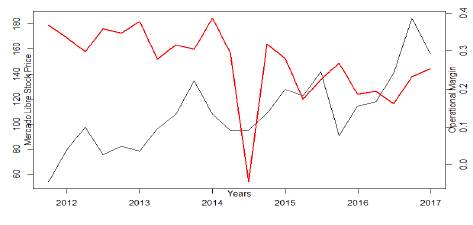
Source: Bloomberg. The black line represents the stock price, and the red line corresponds to the operating margin of Mercado Libre as reported by Bloomberg.
Figure 3 Mercado Libre Stock Price and Operating Margins. Q32012-Q42016
We argue that if the costs of issuing sell recommendations were negligible, then analysts sell recommendations based on the firm's performance, should have increased notoriously as stock prices kept rising, taking a different route from the fundamentals of the firm. Meanwhile, the number of buy recommendations should have decreased considerably. But this seems not to be the case. In Figure 4 we show the series of the number of analysts' recommendations for Mercado Libre, from which we can observe not only that the number of buy recommendations (black line) did not decreased notoriously, but also that the number of sell (blue line) recommendations did not increase in a visible and clear manner.
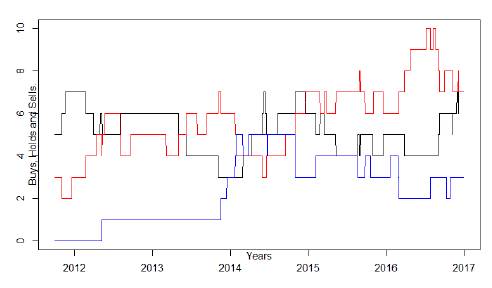
Source: Bloomberg. The black line represents "Buys", the red line "Holds", and the blue line "Sells".
Figure 4 Recommendations for Mercado Libre Stock. 30/09/2011-12/31/2016
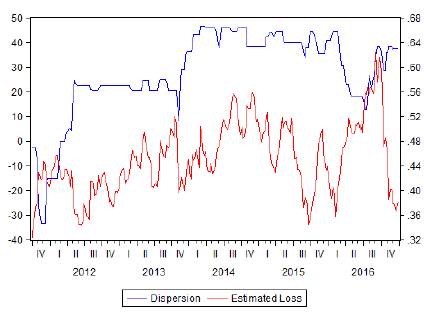
In Figure 5 we show the series of the dispersion in recommendations and also the projected losses (realized stock price minus the projected price, see section Variables) for the American depositary receipt of Mercado Libre, with data from September 30, 2011, to December 21, 2016. The figure suggests that analysts' disagreement in recommendations follow their projected losses.
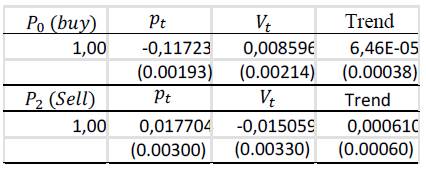
When performing a cointegration analysis of the proportion of buy recommendations (P0, see section 4 for the definition of variables), and the proportion of sell recommendations (P2) , both related to the stock price (pt) and the analyst price targets (Vt), we can observe, as shown in tables 1 and 2, that analyst recommendations that plainly urge the investor to take action (buy, sell) are consistent with their estimated losses (gains). The Johansen cointegration tests show that there is only one cointegrating equation for P0and one for P 1 relating them to analyst expected losses, and these equations have the following form:
where ω0,t and ω2,t follow a stationary process. As Vt exceeds pt (analyst estimated gains increases) the proportion of buy recommendations also augments, and as pt excedes Vt (analyst estimated loss increases), the proportion of sell recommendations increases.
Table 1 Johansen Cointegration Tests. P-values
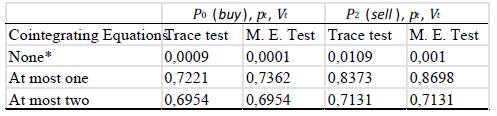
Source: Authors' calculations. M. E. Test stands for Maximum Eigenvalue Test.
Interestingly, as investors keep buying Mercado Libre ADR and its price keep raising during years in which the firm fundamentals deteriorate, analysts opted for issuing less unanimous and less plain spoken recommendations, although their stock valuations imply greater expected losses. As we can see in tables 3 and 4, not only the dispersion (Dt) in recommendations grows as prices move upward from valuations but also the proportion of hold recommendations, the neutral recommendation, increases as prices move upward from analyst price targets. This is more easily seen expressing the cointegrating equations in the following form:
where t is a trend variable ωD,t and ω1,t both and follow a stationary process. The above equations show that the dispersión in analysts’ recommendations as well as the proportion of hold recommendations augments as stock prices move upward from analysts’ valuations.
Table 3 Johansen Cointegration Tests. P-values
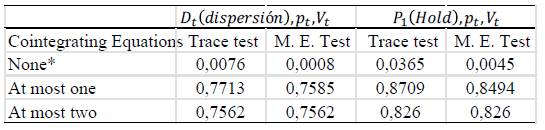
Source: Authors' calculations. M. E. Test stands for Maximum Eigenvalue Test.
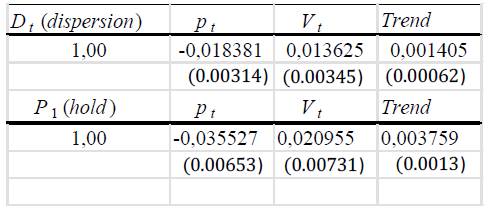
Table 5 shows that the target price (Vt) results in terms of the order of inte, the stock price (pt) and the dispersion gration were obtained from daily and (Dt) are integrated of order one when monthly observations. using a weekly periodicity.
VARIABLES
Let Vt denote the analysts consensus price target at date t and pt denote the stock price at date f. We define the projected loss estimated by analysts from buying a stock as:
Intuitively, as the stock price goes higher and the target price goes lower, the projected loss is higher. In order to estimate the level of dispersion in analysts' recommendations, let A be the number of analysts following stock i and let B¡,a be a dummy variable that takes the value of one whenever the analyst a issued a buy recommendation on stock i. To be more concrete

Similarly, define Hi,a for hold recommendations and Si,a for sell recommendations. Therefore, using the variance definition for Bi,a we have:
Since Bi,a is a dichotomous variable then E(B i,a) = Pi,o where Pi,o is the probability that an analyst recommends buy for stock i. Therefore, the above expression is:
Denoting Pi,o, Pi,1 and Pi,2 as the proportion of analysts, at a certain date t = 1,2, ...,T, whose recommendations were buy, hold and sell respectively, and summing up the variance through recommendations we get a measure for the dispersion in recommendations of stock i,D_{i,t} (see e.g., Budescu & Budescu, 2012):
where r Є {0,1,2} denotes the type of recommendation (buy, hold, sell). Notice that, for all i and all t, D i , t is minimal when there exists an r such that P i,r,t = 1 and is maximal when P i,o,t = P i,1,t = P i,2,t . For instance, in Figure 5 we show the series of dispersion and projected losses for Mecado Libre. As we can see, the level of dispersion during the period shown is larger than 0.3 and smaller than 1, and the projected losses take negative and positive values as the price is greater than the target in some periods and less than the target in others.
EMPIRICAL STRATEGY
We first test the null hypothesis that all the series are non-stationary versus the alternative hypothesis that some of the series are non-stationary, using a t-bar test statistic (IPS test) from a panel data model as in Im et al. (2003). Cointegration tests, as those used in this paper, help to identify whether two or more non-stationary time series are related. Following Im et al. (2003), the model we use to test non-stationarity is
where yi,t is one of the variables (as described above) for stock i at period t, t, Δyi,t = y i , t - yi,t-1 and εi,t is an against the alternatives error term. Thus, we test the following null hypothesis of unit roots
Against the alternatives

In addition, we test the null hypothesis are stationary, using the test of Levin, that the series are non-stationary versus Lin and Chu (2002) (LLC test). More the alternative hypothesis that the series precisely, from the model
we test
Against
Besides the lags and the lags of the first differences, both the IPS and the LLC tests also include time trends.
We check the consistency of stock recommendations which clearly urge for action (buy, sell) by estimating the following cointegrating equations:
where ω 0 , t and ω 2 , t follow a stationary process and P 0 , P 2 , V t and p t are defined as above. If analysts' recommendations are consistent with their estimated losses, then β0,v >0; β 0,p < 0; β2,p > 0; β2,V < 0. After checking for this consistency and following the hypothesis that issuing sell recommendations is more costly, we analyze how dispersed are analysts when their estimated loses increase. To do this, we estimate the following cointegrating equations:
where ω D,t and ω 1,t follow a stationary process, and D t and P 1 are defined as above. We repeat this cointegreation analysis for the 45 stocks in the sample.
RESULTS
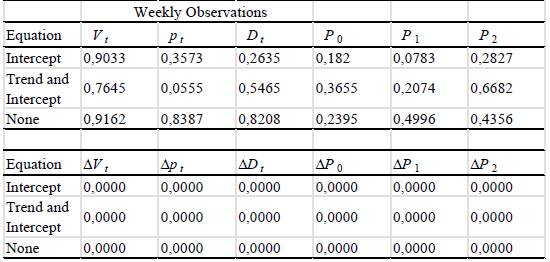
We perform panel data unit root tests for each variable as explained in the previous section. The results of the IPS tests, shown in table 6, indicate that most of the series (stocks) are non-stationary. In this same line, the test of LLC applied to each of variable, does not reject the null hypothesis that the series are non-stationary. Since differencing the series results in stationary data, we keep the series in levels for the estimation of parameters in a cointegration framework.
Table 6 Panel Data Unit Root Test. P-values
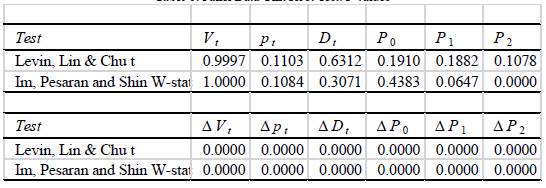
Source: Authors' calculations. $\Delta$ refers to the Levin, Lin and Chu and the Im, Pesaran and Shin test over the first difference of the series.
Now we describe the results of the cointegration analyses. For all of the 45 stocks, the trace test of zero cointegrating equations was rejected at the 5% level. In addition, as shown in Table 7, the number of cases in which the projected stock price (target price) is positively related to the number of buy recommendations, is larger than the number of cases in which the target price is negatively related to the number of sell recommendations (88% for positive β0, v v.s. 73% of negative β 2,v), i.e. analysts react mildly to higher projected losses and strongly to higher projected capital gains. This is consistent with the literature showing that analysts exhibit systematic optimism, e.g., Easterwood and Nutt (1999).
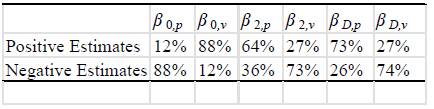
Also, the number of cases in which the current stock price is negatively related to the number of buy recommendations (88%), is larger than the number of cases in which the stock price is positively related to the number of sell recommendations (64\%), i.e., analysts again, react mildly to higher projected losses. Moreover, the dispersion in analysts' recommendations has a significant relationship with the current price and the projected price, where higher projected losses are positively related to dispersion in analysts' recommendations: for most stocks in the sample, when the current stock price increases (73% of positive β d,p ) or the target price decreases (74% of negative Po,p), the dispersion level augments. This result resembles those in Li et al. (2021), where dispersion in target prices is positively related to future stock risk. Although not directly comparable, our results as well as those in Li et al. (2021) tell us that disagreement among analysts is a valuable source of information for stock markets.
CONCLUSIONS
In this paper we test the hypothesis that sell recommendations are costlier than buy recommendations by carrying out cointegration analyses and find evidence in favor of it.
We find that analysts' recommendations that plainly urge the investor to take action (buy, sell) are consistent with their estimated losses (gains). That is, as analysts' target prices move upward and stock prices move downward (analyst estimated gain increases), the proportion of buy recommendations augments; and as the stock prices raise and target prices fall (analyst estimated loss increases), the proportion of sell recommendations increases.
Importantly, we find that analysts' recommendations react mildly to higher projected losses, and strongly to higher projected capital gains. For our sample, the number of cases in which the target price is positively related to the number of buy recommendations, is larger than the number of cases in which the target price is negatively related to the number of sell recommendations. In addition, the number of cases in which the current stock price is negatively related to the number of buy recommendations, is larger than the number of cases in which the stock price is positively related to the number of sell recommendations.
Moreover, we find that higher projected losses are positively related to dispersion in analysts' recommendations. Specifically, the disagreement in analysts' recommendations has a significant relationship with the current price and the projected price: for most stocks in the sample, when the current stock price increases or the target price decreases the dispersion level augments. This exposes that analyst disagreement is an important piece of information for stock markets.
We rule out the hypothesis that these findings are consistent with cognitive biases that lead to overvaluation and under-valuation given that we observe strong reactions in one direction only. We also rule out differences in risks since target prices incorporate this information already.
As a specific interesting case, we also use data of Mercado Libre ADR for a period of four years, period in which its operating margins and returns on capital showed a negative trend. While the fundamentals suggested a decrease in the intrinsic value of Mercado Libre, the dispersion in analysts' recommendations as well as the proportion of hold recommendations raised as the stock price moved upward and analysts' valuations downward. If the costs of issuing sell recommendations were negligible, as the price behavior departed from the fundamentals of Mercado Libre, the number of analysts' sell recommendations, based on firm performance, should have increased as stock prices kept rising.
Further research must be done in order to understand how analysts evaluate the prospects of firms during periods of bad performance and what strategic decisions they take with regards to how they reveal their private information. Moreover, in the same line of research of this paper, better establishing the informativeness of dispersion in analyst recommendations relative to recommendations themselves, is important for a test on the profitability of portfolios, build upon analyst disagreement which would provide new insights on how to incorporate analysts' information on investment decisions.

