Inglés (pdf)
 Articulo en XML
 Referencias del artículo
 Enviar articulo por email
 Citado por SciELO
  Citado por Google
  Similares en
SciELO
Similares en
SciELO  Similares en Google
 Permalink
INTRODUCTION
Peru's current international trade strategy is based upon three main set of policies: the unilateral trade liberalization process; a set of bilateral and regional preferential trade agreements (PTA) and export promotion policies. In period 2001-2015, such strategy was consolidated under the institutional trade policy framework built in the 1990s, led by the minister of Economy and Finance (MEF) and accompanied by major interest groups associated to new economic groups, large firms, and guild of companies. In such period, the average of the most favored nation tariff (MFN) decreased from 13,5% in 2000 to 2,2% in 2015 (up to 2017) whereas the share of tariff lines with non-tariff barriers (NTB) increased from 8,5% in 2000 to a third of the total import tariff lines in 2016.
This paper analyses the political economy factors that may have affected the evolution of trade barriers in the unilateral liberalization period of 20012015. The political economy analysis does suggest that despite of the power of the ministers of the MEF, political actors associated to large firms and guild of companies and other external factors had a role on shaping the trends of tariffs and non-tariffs barriers.
Despite of the empirical approach of the paper, in the first section, a very brief discussion of the theoretical literature is outlined. The next four sections contain the empirical analysis. Thus, second section describes trade barriers of Peru in period 2000-2015. Third section develops the main hypotheses of the paper. Fourth section uses an ad-hoc political economy model to estimate the role of the interests of national and exporting companies, labor factors and entry barriers in the formation of trade barriers in period 2001-2015. Section fifth offers a summary of the main results. A list of references is presented at the end of the paper.
THEORETICAL LITERATURE
There are at least four broad strands of the economic literature by which trade policy could be analyzed. The first and the one that this paper is based upon, is the literature on the political economy of trade policy. The pioneers work of this strand of the economic literature (denominated the endogenous trade policy theory literature) are the works of Olson (1965) Brock and Magee (1974, 1975, 1978, 1980, 1983), Baldwin (1976, 1985), Findlay and Wellisz (1982), Hillman (1982, 1989), Mayer (1984), Magee et al. (1989). Regarding the political science literature, two works are quoted frequently, Schattschneider (1935), and Dixit and Londregan (1995). Surveys of these literatures are presented in Helpman (1995), Rodrik (1995), Krishna and Gawande (2003), Lederman (2005) and McLaren (2016).
According to the endogenous trade policy literature, "the equilibrium level of protection is determined by supply and demand1. Protection is demanded by interest groups2 that rationally weigh the costs and benefits of lobbying for protection and is supplied by politicians seeking to maximize self-interested objectives" (Trefler, 1993, p. 140). On the other hand, Rodrik (1995) points out that
political-economy models generally take the specific-factors or Heckscher-Ohlin settings and modify it in one or both of the following ways. The objective function maximized by the policymaker is taken to show a preference for certain distributional outcomes, and hence to differ from that of the social planner and individuals or lobbying groups are assumed to be able to take actions to shape the policymaker's preferences. (p. 1463)
Taken these features, Rodrik (1995), Helpman (1995) and Krishna and Gawande (2003) analyze five models: the tariff-formation function model; the political support function model; the direct democracy or median-voter model; the electoral competition or campaign contributions model; and the interest-group or influence-drivers political contributions model (developed by Grossman-Helpman, 1994).
The literature on the political economy of trade liberalization policy postulates arguments (such as liberal ideas, politician's preferences and institutional changes, macroeconomic performance factors, etc.) in favor of reductions of trade barriers instruments as opposed to protectionist barriers. Stand out in this literature the works of Nabli (1990), Dornbusch (1992), Edwards and Lederman (1998), Milner (1999), Sally (2007) and Ludema et al. (2010).
Among the key aspects analyzed in this literature are: i) the strength of exporters groups3 (represented by the diversification and importance of manufactures and traditional exports); ii) the strength of import-competing sector's opposition (measured by the share of manufacturing in GDP); iii) the occurrence of a political or macroeconomic crisis or poor economic performance that led a major opening of the economy; iv) open-market ideas; v) greater level of information on world trade; vi) pressures for structural reforms from international institutions; and vii) stronger institutions to support and manage open-market policies. Since the focus of the empirical analysis are trade barriers, the theorical basis of the political economy of preferential trade agreements (PTA) are not considered in this paper4.
The second strand of the literature is related to the microanalysis of strategic trade policy, wherein the field of trade is combined with the field of industrial organization. As result of the new trade theory (Krugman, 1989), the microanalysis of strategic trade policy was developed in early 1980s. According to Örgün (2012), Brander and Spencer (1983, 1985) created a considerable stir with an analysis of trade policy under imperfect competition. They introduced economies of scale, product specialization and technology as new aspects for the basis of trade. The Brander-Spencer analysis offered a particularly clever way of setting up the case for activist trade policy, one which simplified the issue enormously and thereby revealed its core. This new trade theory provided at least limited support for a kind of neo-mercantilism, means that governments could in fact raise national income at other countries' expense by supporting national firms in international competition. As the most important part of Brander and Spencer approach could be briefly described with a term of strategic trade policy. Although there exist cases wherein strategic trade policy may be relevant for developing economies (e.g., Dixit et al., 1995, and Bhattacharjea, 1993), the facts presented below on Peru are consistent with the arguments of Krugman (1993, 1987) and Órgün (2012), that free trade policy may be the least harmful policy for developing economies5.
The last two strands of literature -non-relevant for this paper due to the lack of evidence and the size of Peru' interest groups at the international markets- are that of the voluminous literature on interest groups (e.g., Sharif & Swank, 2019) and of the international political economy literature6 (e.g., Oatley, 2019).
TRADE BARRIERES IN PERU 2000-2015
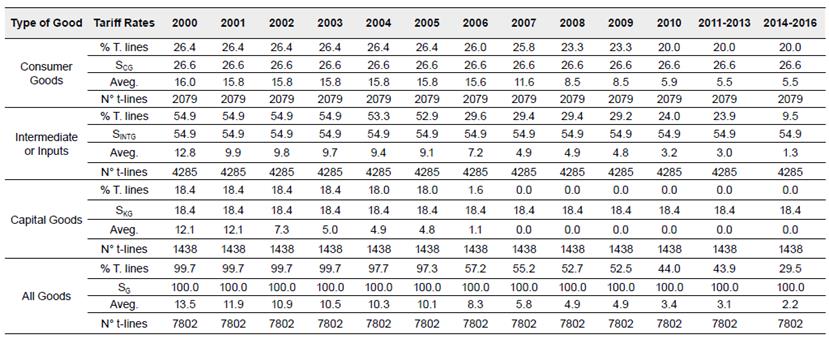
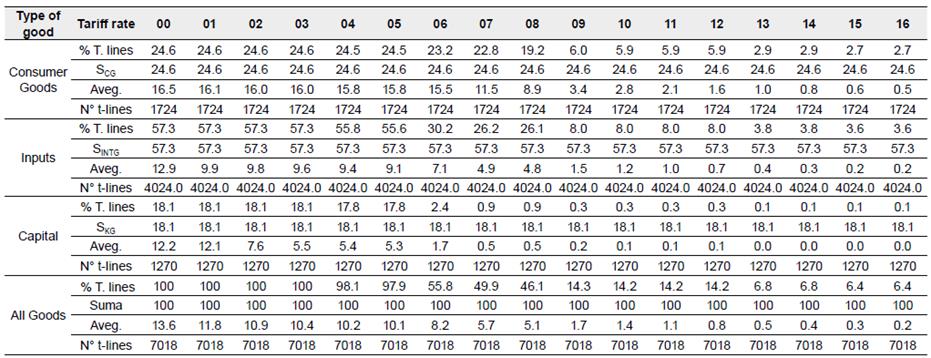
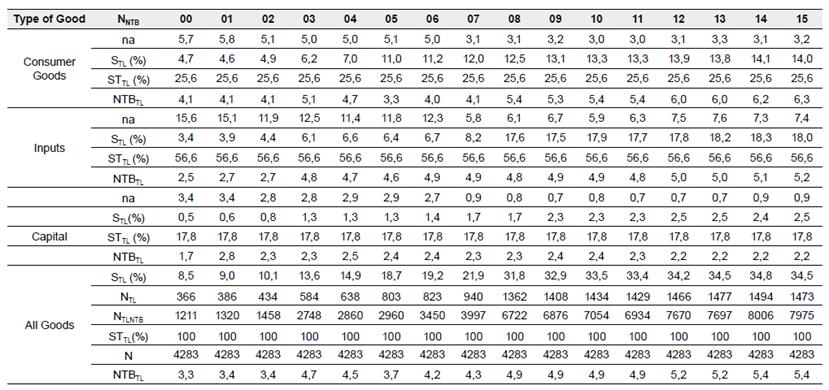
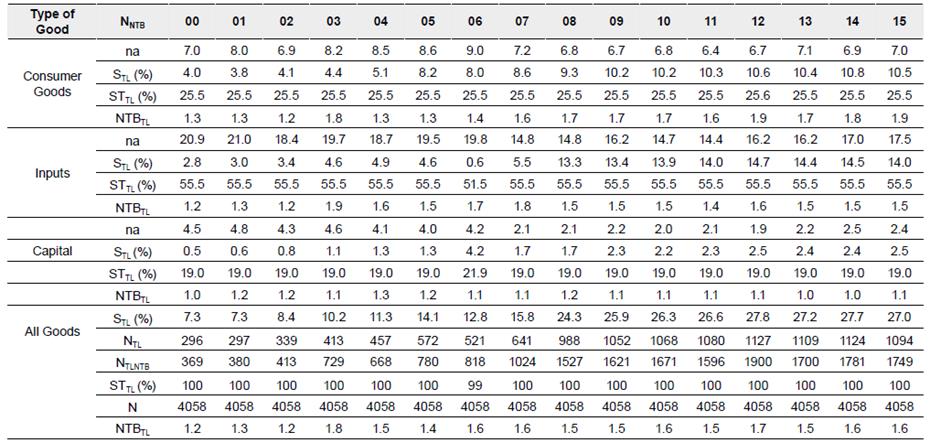
Tables from A1 to A4 (of annex) show the evolution and the structure of trade barriers of Peru in period 2000-2016. Tables A1 and A3 show the MFN tariffs and non-tariff barriers (NTB)7 imposed to imports from the rest of the world and Tables A2 and A4 show those imposed to imports from the United States of America8. In these latter tables, it is shown the preferential tariffs and NTB which prevailed since 2009 according to the PTA between Peru and the United States. The figures in all these tables indicate that:
i) Peruvian tariffs have been structured in a staggered way, higher for consumer goods, lower for capital goods and in the middle for inputs or intermediate goods. Although this pattern has been maintained in period 2000-2016, the tariff gap rate between these goods has decreased (i.e., tariffs dispersion has been reduced for imports from the world and from the United States).
ii) Imports of intermediate and consumer goods have had the highest number of tariff lines whereas capital goods have had the lowest number. Tariff levels have had the highest value for consumer goods, followed by intermediate goods and then for capital goods.
iii) Peruvian most favored nation (MFN) tariffs have had a decreasing trend. Since 2016, Peru has the lowest simple average tariffs of 2,2% in the last 60 years from imports of the world and 0,2% from imports of the United States.
iv) Although in the entire period 20002016, the sets of tariff lines associated to a determined tariff level have consistently decreased, there have been years (i.e., 2001, 2005, 2006 and 2008 for consumer goods) wherein small set of tariff lines have not followed this pattern. In such years, that small set of tariff lines has either increased or decreased their tariff rates levels in both for world and for United States imports9.
v) Contrary to the case of tariffs, NTB have been increasing from both the world and the United States imports. Thus, in 2000, 8,5% and 7,3% of the tariff lines from imports of the world and the United States had respectively NTB, in 2015 these percentages increased to 34,1% and 27%. In addition, the number of NTB per tariff line has increased from both imports (world and the USA).
vi) More than a half of the tariff lines with NTB are imposed to intermediate goods followed for consumer goods which covers more than a third of NTB in both imports (world and the USA).
These stylized facts would suggest a rather different behavior of political economy factors and actors regarding tariffs and non-tariffs barriers regardless the origin of imports (world and the USA). For the latter, it seems the behavior of the factors and/or actor was to "increase" or to protect industries and for the former, with some exceptions, to liberalize tariffs.
HYPOTHESES ON THE POLITICAL ECONOMY OF TRADE POLICY IN PERU
From the political economy of trade policy point of view, six aspects delineated the institutional framework and interest groups on trade policy of Peru in period 2000-2015. First, the structural reforms implemented under Fujimori administration (1990-2000). Second, the empowerment of the Ministry of Economy and Finance (MEF). Third, the liberal ideas shared by the ministers at MEF selected by the different administrations (from 2000 to 2018). Fourth, interest groups associated to firms biased towards to commercial opening. Fifth, the dominance of the informal, underemployment and not salaried workers of the labor force; and last, the small role of consumers on trade issues. These aspects are described next.
Liberal Structural Reforms in Fujimori's Administration 1990-2000
After a short period of liberalization during 1979-1982, Peru continued its import substitution industrialization model (which began with the administration of General Juan Velasco Alvarado in 1967). Peru's trade policy was highly protectionist with high tariff and non-tariffs barriers and export subsidies. Thus, the share of tariff lines with NTB (related to import licenses, quotas, and quantitative restrictions) increased from 7% in 1980 to 90% in 1988. Prohibition of imports increased from 0% in 1980 to 10% in 1988. The average tariff rate increased from 32,8% in 1980 to 69,5% in 1988. The tariffs dispersion was also high, in 1988, the maximum tariff rate for consumer goods was 110% and the minimum 25,5% for intermediate and capital goods. Non-Traditional export promotion was based upon two main instruments "el Certificado de Exportación, CER-TEX y el Fondo de Exportaciones No Tradicionales, FENT". The first provided an export refund of a maximum of 30% of the export value and in FENT reached a maximum figure of 41,1% of the total non-traditional export value in 1984. The Andean Community was the only relevant agreement signed by Bolivia, Colombia, Chile, Ecuador and Peru (on May 26 of 1969). On February 1973 Venezuela joined the agreement, and Chile exited by October of 1973. On August 25, 1992, Peru exited temporally from the Andean Community until 1997 (by Decision 424), the date of its full reincorporation into the Andean Free Trade Area that began in 1992.
Trade and other distortions (in foreign exchange markets, interest rates, prices control, etc.) and macroeconomic imbalance led to hyperinflation and recession by the end of 1989 as the macro figures of Table 1 show. The Peruvian crisis of the 1980s led to a new liberal market model of growth in 1990 under Fujimori administration. The "new liberal model" was "accidentally decided" in a 1990 meeting with his leading promoter, Dr. Carlos Boloña.
I went on time to a meeting in a New York Hotel wherein Rodriguez-Pastor, Fujimori, Felipe Morris, Hernando de Soto and Adolfo Figueroa were all seated to discuss the economic plan to eliminate the hyperinflation in Peru and I presented my ideas on such plan whereas the other idea of the plan was gradualism I said decidedly that in Peru we have to start with our statistics from zero because what will be emerging from the plan is a 'new country'. Besides, your program is like taking a blood pressure to a sick person when a tumor removal is needed to save its live. The country is a patient that we need to operate now otherwise it would be dead. Well, said the President, I have listened you for two hours, although I am not an economist, I have a lot of intuition and it is not for nothing that I won the elections. I do not believe your plan Adolfo it seems that what Dr. Boloña said it can work. (Boloña, 1993, pp. 23-24)
Liberal market economy reforms were initiated by President Fujimori in July 1990. The reforms included a drastic stabilization program10, trade policy reform, tax reform, financial, privatization and investment promotion reforms, capital market reforms, and labor- market policies.
Table 1 Macroeconomic Indicators of Peru 1980-2017
| Variables | 80-84 | 85-89 | 90-94 | 95-1999 | 2000-04 | 2005-10 | 2011-15 | 2016-2017 |
|---|---|---|---|---|---|---|---|---|
| y | 2966,9 | 2797,3 | 2270,1 | 2684,5 | 2831,9 | 3661,8 | 4705,8 | 5092,2 |
| gy | -1,54 | -2,31 | 0,87 | 1,81 | 2,13 | 5,58 | 3,62 | 2,79 |
| gY | 0,89 | -0,11 | 2,85 | 3,56 | 3,58 | 6,50 | 4,79 | 3,27 |
| SX | 17,7 | 15,8 | 18,1 | 21,3 | 27,5 | 30,2 | 26,2 | 27,0 |
| gX | 0,82 | -0,13 | 4,19 | 8,15 | 8,75 | 5,09 | 2,92 | 8,33 |
| SXT | 77,4 | 72,5 | 70,0 | 69,1 | 69,5 | 76,4 | 73,0 | 72,2 |
| SXNT | 21,3 | 26,4 | 28,8 | 29,7 | 29,1 | 23,0 | 26,5 | 27,5 |
| SM | 15,04 | 10,91 | 15,11 | 20,39 | 18,56 | 23,02 | 26,94 | 24,82 |
| gM | -6,83 | 3,77 | 16,66 | 0,66 | 5,96 | 13,23 | 2,74 | 4,04 |
| SMCG | 13,0 | 11,0 | 20,5 | 22,8 | 21,9 | 17,8 | 20,9 | 24,3 |
| SMINTG | 38,4 | 48,2 | 43,7 | 41,6 | 51,3 | 51,6 | 46,2 | 44,8 |
| SMKG | 36,0 | 28,8 | 28,2 | 31,4 | 25,7 | 29,9 | 32,0 | 30,3 |
| SYG | 38,7 | 37,2 | 36,2 | 35,1 | 37,9 | 37,1 | 32,8 | 32,0 |
| gYG | -0,89 | -0,98 | 2,18 | 3,77 | 4,91 | 5,12 | 2,70 | 3,83 |
| gTT | -2,90 | -4,11 | -3,62 | -0,01 | 3,84 | 7,70 | -2,48 | 3,29 |
| FD | -8,22 | -8,89 | -4,37 | -1,75 | -2,27 | 1,03 | 0,57 | -2,79 |
| gCPI | 88,6 | 966,6 | 1580,1 | 7,7 | 2,2 | 2,6 | 3,6 | 2,3 |
| gRERBI | 2,66 | -1,28 | -13,43 | 3,18 | 0,37 | -3,21 | 0,91 | -0,19 |
| gRERM | -1,52 | 2,42 | 0,38 | -0,75 | 0,05 | -1,28 |
Source: BCRP (2018), INEI (2018c). Author's work. Y= GDP, y= per capita GDP (US$ 2007), gZ = rate of growth of variable Z, SX= export share out of GDP, SXT= traditional exports share out of total exports, SXNT= non-traditional exports share out of total exports, SM= share of imports out of GDP; SMCG= share of imported consumers goods out of total imports, SMINTG= share of imported intermediate or inputs goods out of total imports, SMKG = share of imported capital goods out of total imports, SYG= share of GDP of goods out of total GDP, TT= terms of trade, FD= share of fiscal deficit out of GDP, gCPI= rate of inflation (or rate of growth of consumer price index price), gRERBI= growth of the US-Peru bilateral real exchange rate, gRERM= rate of growth of the multiple real exchange rate.
The Empowerment of the Ministry of Economy and Finance (MEF) and the Institutional Trade Framework
Regarding trade, five legal devices empowered the role of MEF in the making of trade policy, practically without any check and balance from other governmental entities. In the first place, MEF determines tariffs levels and its structure, export drawbacks11, and safeguards12. Second, although the National Institute for the Defense of Free Competition and the Protection of Intellectual Property (INDECOPI) -through the Commission of Dumping, Subsidies, Countervailing Duties, and the elimination of non-tariffs barriers NTB- controls defense measures, the elimination of NTB needs to be validated also by the MEF13. Third, according to Legislative Decree N° 25909-11-1992, the only governmental entity to dictate measures intended to restrict or prevent the free flow of goods and services through requirements, formalities of any measure that affect imports and exports is the MEF. Other NTB such as sanitary and phytosanitary measures were determined by National Service of Agrarian Health (SENASA),14 and environmental, health and food safety, technical obstacles and customs procedures were determined for several governmental institutions such as the National Quality Institute (INACAL), Ministry of Production (PRODUCE), Ministry of Agriculture (MINAGRI), the General Directorate of Environmental Health and Food Safety (DIGESA), and MEF. Fourth, although the Ministry of Trade and Tourism (MINCETUR) negotiates the preferential trade agreements (PTA), official representatives of the MEF, and the Ministry of External Relations (RREE) also participate in trade negotiations. The intervention and approval of the Congress is necessary only for extended PTA (such as the Peru-USA, PTA in force since 2009 and the Peru-European Union PTA in force since 2013).
The Liberal Features Shared by the Ministers at MEF from 1990-2018
From 1990 to 2018, the empowered MEF was led by suitable technocrats who shared five common liberal fea-tures15. First, all of them have strong convictions on trade liberalization using tariffs reductions and PTA as the main instruments of trade policy. These convictions were based upon ideology (e.g., Boloña), technical theory (e.g., Aráoz), and pragmatism (e.g., Benavides). Second, they also have strong convictions on macroeconomic prudence and fiscal balance. Third, most of them have had experience in the private sector working in large firms including economic groups (EG). Fourth, most of them had experience with international organizations including the World Bank, IADB and IMF. Fifth, although to different degree, they believed that a "social market economy" is an ideal economic model that guarantee economic growth and social inclusion. These features implied, among other things, that MEF ministers reduced trade barriers aggressively (including export drawbacks) and promoted multiple preferential trade agreements.
The New Economic Groups and Large Firms
According to Durand (2010), the continuity of neoliberalism depended upon the degree of acceptance or consensus of its general principles among the main political leaders, public opinion, and the behavior of private sector. Among the latter, large enterprises, and old and new economic groups, constituted a new economic power structure since 1990s from which they carried out their political management.
The economic groups in Peruvian economy have been studied throughout the last 60 years. These groups have changed from the dominance of multinational enterprises (MNE), oligarchy landowners and national enterprises in the 1960s to the dominance of MNE and economic groups from Peru and Latin American Countries (Durand, 2004) in the present century. Durand (2017) points out that the "new economic groups" (NEG) are a conglomerated and diversified group of firms16 that create and buy companies acquiring market power. They are highly competitive at local, continental and world level. They use their enormous resources to influence politics, establish favorable relationships with political parties and congressional representatives, and to maintain a narrow and productive relationship with the government. The main mechanisms of the relationship between NEG and Government are the financing of political campaigns, lobbies, revolving doors, interpersonal contacts, and bribery.
Table 2 shows some concentration indicators of the NEG in period 20032015. The figures indicate that NEG have interests on mining exports, (XM), non-traditional exports (XNT)17 and domestic products18. These sectors and products imply that mining NEG would be interested in reducing barriers to investment and promote mining concessions. NEG of non-traditional exporters would be interested in reducing trade barriers on inputs and capital goods, and if possible, export subsidies. Domestic producers NEG would be interested in imposing barriers on final consumer goods and eliminating trade barriers to inputs and capital goods. Second, the high degree of concentration in the goods (SG) and goods and services markets (SGS) may be related to domestic market power (in differentiated products) wherein trade barriers may reinforce its power by restricting foreign competition. Third, the enormous resources generated by the NEG not only could grant them political power but also may create government fiscal dependency on the economic performance of these groups.
Table 2 Concentration Indicators of NEG20 2003-2015 (US$ Millions)
| NEG | 2003 | 2013 | 2015 | ||||||
|---|---|---|---|---|---|---|---|---|---|
| INC | X | M | INC | X | M | INC | X | M | |
| Romero | 1520,6 | 127,2 | 272,6 | 1292,8 | 150,7 | 458,7 | 1225,9 | 103,2 | 372,1 |
| Brescia (XM) | 414,7 | 196,4 | 34,9 | 1271,4 | 426,5 | 121,2 | 1065,3 | 662,7 | 114,7 |
| Benavides (XM) | 1977,6 | 1670,4 | 75,6 | 2789,5 | 2636,7 | 114,0 | 2507,9 | 2084,8 | 226,3 |
| Graña y Montero | 37,4 | 0,0 | 0,3 | 67,9 | 0,0 | 3,9 | 64,5 | 0,0 | 2,9 |
| Ferreyros | 10,3 | 1,8 | 1,5 | 0,0 | 0,0 | 0,0 | 0,0 | 0,0 | 0,0 |
| Rodriguez-Pastor | na | na | na | 105,9 | 39,7 | 42,4 | 108,8 | 52,2 | 42,8 |
| Dyer (Xnt) | 84,5 | 65,5 | 1,3 | 221,8 | 131,7 | 20,8 | 199,6 | 149,6 | 20,3 |
| Rodriguez | 510,7 | 21,0 | 82,2 | 1569,1 | 150,7 | 297,7 | 1687,2 | 176,1 | 326,2 |
| Huancaruna (XNT) | 64,0 | 50,4 | 0,4 | 180,5 | 119,1 | 8,3 | 168,2 | 143,0 | 9,4 |
| Flores (XNT) | 94,0 | 69,7 | 6,3 | 73,5 | 49,4 | 0,7 | 58,9 | 39,0 | 0,6 |
| Añaños | 63,0 | 1,7 | 5,1 | 176,8 | 2,4 | 61,2 | 170,5 | 0,8 | 60,7 |
| Total | 4776,8 | 2204,1 | 480,2 | 7749,3 | 3706,8 | 1128,9 | 7256,9 | 3411,5 | 1175,9 |
| Sinc (%) | 100,0 | 46,1 | 21,8 | 100,0 | 47,8 | 30,5 | 100,0 | 47,0 | 34,5 |
| Sg (%) | 9,4 | 18,4 | 4,3 | 7,8 | 12,0 | 3,6 | 7,8 | 12,5 | 3,8 |
| Sgs (%) | 7,2 | 14,8 | 5,1 | 7,7 | 10,3 | 5,1 | 7,7 | 10,4 | 4,7 |
Source: Peru Top (2018), INEI (2018c), INEI (2007), BCRP (2018). Author's work. SINC the share of exports and import of goods out of total income of the NEG; SG share of value added generated by NEG income out of GDP of goods; in the case of X and M the share of NEG's exports and imports of goods out of the total exports and imports of goods. SGS similar, to SG but including services (sector, export' and imports' services). na not available. XM mining exports, XNT non-traditional exports
Table 3 Concentration Indicators of Peruvian Firms 2003-2015
| CIN | 2003 | 2013 | 2014 | 2015 | ||||||||||||
|---|---|---|---|---|---|---|---|---|---|---|---|---|---|---|---|---|
| N | SG | SX | SM | SR 1/ | SINC | SX | SM | SR 2/ | SINC | SX | SM | SR | SINC | SX | SM | SR |
| 10 | 24,4 | 24,1 | 12,2 | na | 21,3 | 19,7 | 13,1 | na. | 18,5 | 18,7 | 13,2 | na | 16,9 | 18,3 | 8,9 | Na |
| 20 | 31,2 | 32,0 | 15,3 | na | 28,8 | 28,9 | 16,5 | Na | 25,0 | 26,5 | 16,2 | na | 24,6 | 26,2 | 11,9 | Na |
| 50 | 40,5 | 44,2 | 20,8 | 33,6 | 39,2 | 44,3 | 22,6 | 29,8 | 34,1 | 39,7 | 21,4 | 29,2 | 35,1 | 39,3 | 17,4 | 24,6 |
| 100 | 47,7 | 53,3 | 26,1 | na | 47,2 | 56,4 | 28,4 | na | 42,1 | 51,0 | 26,6 | na | 43,0 | 50,7 | 22,9 | na |
| 280 | 58,3 | 67,1 | 35,7 | 52,2 | 57,5 | 70,6 | 37,5 | 52,4 | 53,0 | 65,2 | 36,2 | 50,5 | 54,8 | 64,4 | 32,8 | 45,6 |
Source: INEI (2018c), Peru Top (2018), SUNAT (2018b). 1/ For SR N for 2003, are 54 and 254 firms. These firms are chosen because of their levels of assets, income, sales, and purchases. 2/ Firms are chosen since 2013 because of their level of assets, sales, income, purchases, and payrolls. CIN is the N firms concentration ratios indices; SG, SX and SM are respectively the share of value added, exports and imports of the N firms out of total GDP, exports, and imports of goods21. SR is the share firms' tax income of N firms out of the total firms' tax income. na= not available
Aside from the political and economic role of NEG, other domestic large firms may also have political power since their markets are relatively concentrated. Table 3 shows the figures for concentration ratios of the main firms in Peru. Companies share of the value added, exports and imports are also high. It should be noted that the total universe of formal firms in Peru is more than a million, most of them of small and medium size (i.e., less than 100 workers19). Additionally, the income tax revenues of these firms are also high. Thus, in period 2003-2015 about half of income tax revenues of Peru were contributed by the biggest 280 firms.
Firms associations may also influence trade policy in Peruvian economy. The three main associations are: Sociedad Nacional de Industrias (National Industry Society, SNI, Asociación de Exportadores, (Exporters Associations), ADEX, and Sociedad de Comercio Exterior (External Trade Society), COMEXPeru. SNI gather mainly domestic oriented firms and promotes the development of the manufacturing industry, boosts the market economy, and contributes to the development of the country through technical proposals (on labor, tax, and industrial policies). It serves the industry by promoting its competitiveness, the generation of value and the sustainable development of the country.
ADEX is an association, primarily, of non-traditional exporters. It represents and provides services to partners organizations (such as exporters, importers, and service providers to trade). It has as objectives to contribute to the competitiveness of companies and develop the exportable offer, promoting exports, international trade, and investments. It also contributes to national development, generation of welfare and employment.
COMEXPeru, composed by exporters and importers, has three main objectives: to promote the development of foreign trade, defend the free market and encourage private investment.
The managers or directors of these associations have participated on trade negotiation of the PTAs as members of the "adjoining room" and also in meetings or seminars with government entities (e.g., Minister of Trade and Tourism and the Congress) to exchange ideas or to get information on diverse topics related to external trade and productive activities.
Informal Employment, Not Salaried Workers, Under and Unemployment in Peru 1980-2012
A singular feature of the productive structure and the tradable sector of Peru is the dominance of products intensive in the use of natural resources (particularly, mining resources) and in a minor scale, manufactured products intensive in the use of capital. Thus, the average share of primary sector production in GDP was 20,0% in period 1950-1989 and 22,3% in period 1990-2017. The liberal structural reforms, however, did affect the manufacturing import substitution sector, particularly to large firms and economic groups, which had to adjust to the new market conditions (Vega-Castro, 2007). The adjustment implied that the share of manufacturing in GDP decreased from 16.8% in the period 1950-1989 to 15.6% in the period 1990-2017. Regarding exports, Table 4 shows that in average about 75% of total exports correspond to traditional natural resources intensive sectors in period 1980-2017.
The productive structure and the tradable sector originate a low propensity to generate jobs with troublesome consequences on the degree and type of employment of the labor force22. On the one hand, figures in Table 4 show a surplus in the labor market wherein the rate of growth of the urban labor supply for period 1961-1997 has been higher than the respective rate of labor demand. On the other hand, figures in Table 5 point out that main problem in Peruvian labor markets is not the rate of unemployment, which has had an average rate of 5% in period 1980-2012, but the rate of underemployment, not salaried workers and informal employment23.
Table 4 Rate of Growth of Urban Labor Demand and Supply of Peru: 1961-1997 (%)
| Period | Supply Rate of Growth | Demand Rate of Growth |
|---|---|---|
| 1961-1972 | 2,9 | 2,8 |
| 1972-1981 | 3,2 | 2,9 |
| 1981-1984 | 2,8 | -1,5 |
| 1986-1990 | 2,3 | -1,4 |
| 1990-1992 | 2,5 | 0,3 |
| 1997-1992 | 4,1 | 4,2 |
Source: MTPE (1998).
Table 5 Underemployment, Not Salaried Workers and Informal Employment
| Period | Under- Employment1,4, 5, 6 | No Salaried Workers2 | Informal Employment3 | Unemployment2 |
|---|---|---|---|---|
| 1980 | 51,2 | 53,1 | na | 5,5 |
| 1984 | 57,4 | 59,4 | na | 6,4 |
| 1991 | 78,5 | 56,9 | na | 4,2 |
| 1994 | 74,5 | 50,3 | na | 6,3 |
| 1997 | 45,0 | 63,8 | na | 6,6 |
| 2001 | 47,6 | 60,1 | 78,2 | 5,1 |
| 2007 | 48,4 | 58,7 | 79,9 | 4,7 |
| 2012 | 30,2 | 54,6 | 74,1 | 3,7 |
Source: 1 1980 and 1985, Noguez (1991), 4 1991 and 1994 data of Metropolitan Lima Vega-Castro (2007), 5 1997 and 2001, MTPE-INEI (2002), 6 2007 and 2012 MTEP (2013); 2 Castillo (2015), 3Tello (2013) and INEI (2017).
These figures point out that labor force in Peru was not organized, not representing an interest group for trade policy. Furthermore, the influence of workers on trade (and any) policy was reduced close to nil due to the Collective Law of Labor of July 1992 (Executive Order No 25593) and the Law of Job Promotion (Legislative Decree No 728) as suggested by Villavicencio (2010).24
Consumers and Trade Policy
The fact that most of the labor force in period 2000-2016 had an informal employment25 and that the average level of education of the labor force was lower than secondary complete in period 1997-2017 implied that consumers did not have consumers culture and representativeness on trade issues (as suggested by Castro-García, 2017; INDECOPI 2016; and Galván-Pareja, 2006). Furthermore, the "legitimate and political speech perspectives" that explain the permanence of the liberal model assert that the beliefs of consumers and most people in Peru have a "liberal orientation" and consequently their interest did not oppose in effective way, to trade liberalization.
These six aspects show that Peruvian trade barriers liberalization in period 2000-2015 was led by the powerful MEF and accompanied by traditional and diversified exporters that support the unilateral trade liberalization and import substitution firms that influenced to some degree, and reduced the speed rate of, the process of the unilateral trade barriers liberalization. In addition, the unilateral trade liberalization was facilitated by the weak role of the formal labor force and consumer's interest groups with liberal orientation. Next section presents evidence supporting this hypothesis.
THE POLITICAL ECONOMY OF TRADE POLICY IN PERU: AN EM -PIRICAL EXERCISE
Modern and old theoretical models of the "political economy of trade policy" on trade barriers (tariffs or equivalent tariffs of NTB26) point out that such a policy is determined by supply and demand political factors (Rodrik, 1995).
On the demand side, interest groups (economic groups, firms, associations of firms, workers, consumers and so on) rationally weigh the costs and benefits of lobbying for trade barriers (either protection or dismantling and elimination of protection). On the supply side, politicians, and policy makers (government and its institutions, which seek maximize self-interested objectives) supply either protection or liberalization.
At the macro level, two particular "models" have been used for the empirical political economy analysis of trade policy. One is the Trefler (1993) ad-hoc specification of tariff formation model, and the other is the Grossman-Helpman (GH, 1994) structural model of protection. In Trefler's approach, there is not an implicit political economy trade policy outcome, whereas in GH model, free trade is the implicit political economy trade policy which arises when government does not care about contributions and does not have incentive to impose trade barriers or when all industries are organized, and each citizen is represented by some lobby. In this case, the joint surplus of all lobbies coincides with the well-being of the society hence free trade is the equilibrium outcome. In Peruvian economy, there is no legal device on "political contributions" to political parties. Furthermore, recent investigations on such firms contributions from infrastructure sector to some political parties have been assumed as corrupt activities.
The macro analysis of this section is based upon the political economy approach to the trade liberalization policy in Peru in period 2001-2015 using the Trefler's specification of trade barriers. The specification estimates the statistical relevance of three of the six aspects that make up the political economy of trade policy in Peru for period 2001-2015. The specification is as follow:
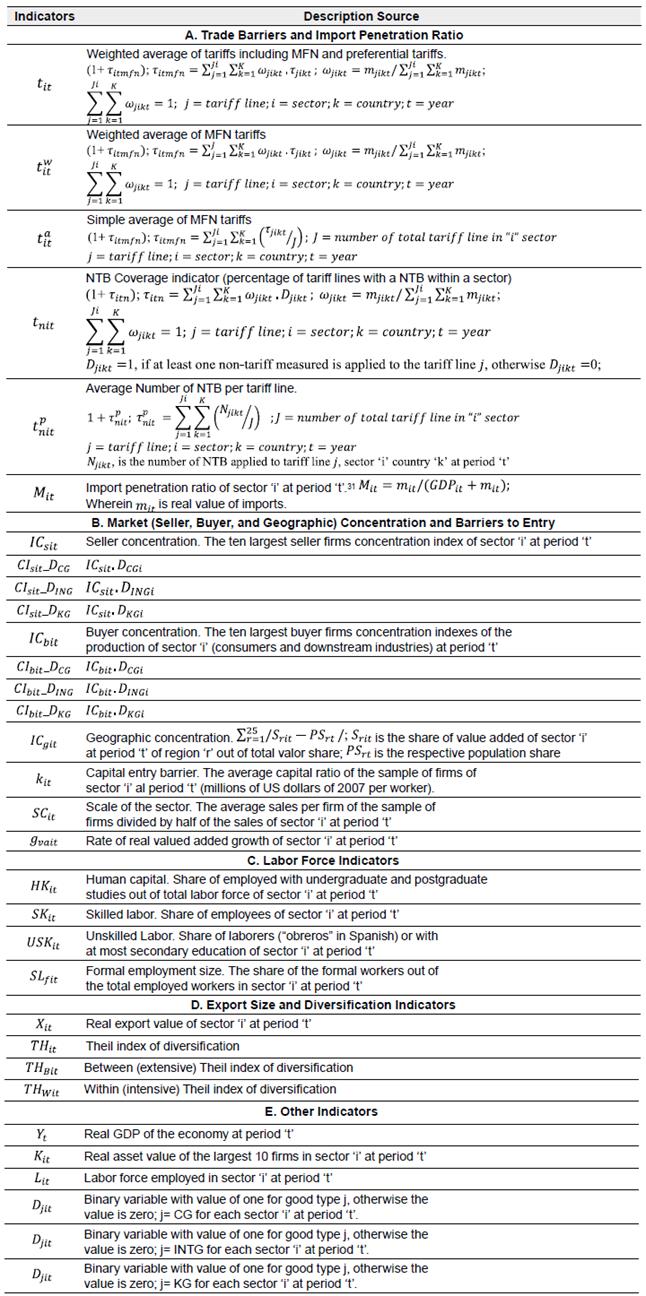
Wherein is a trade barrier instrument (i.e., one plus MFN tariffs, and a non-tariff measure27) imposed to imports from the world and is the import penetration index, "i" represents an ISIC (Rev.3) and "t" a year of period 2001-2015. The set of explanatory variables includes three set of political factors and one economic factor. The first political factor is related to new economic groups and large firms. The variables that represent this group are seller, buyer, and geographic output concentration ratios. The second political factor is the labor force. The variables that represent this group are human capital, the share of skill (i.e., employees) and unskilled labor (i.e., workers) out of total employment and formal employment. The third political factor are traditional and diversified exporters represented by total real export value and export diversification indicators. The set of economic factors includes entry barriers represented by scale of the sector, capital-labor ratio, and the rate of growth of the real value added of each sector. In addition, the variables consider a dummy variable representing either consumer, intermediate, or capital goods as well as a time trend. This can be interpreted as the basic trade policy followed by the trade instrument. For a liberal evolution of the trade instrument, the coefficient of the time trend should be negative, and for a protectionist evolution, such coefficient should be positive.
Table 6 presents the definition and sources of the set of variables used in (1)28. The data of this table could be found in a previous working paper29. The features of the main indicators of such data are the following: i) there are 17 (four-digit ISIC-Rev. 3) sectors; ii) the mean of tariffs value ranges from 0% to 17%, and the two measures of NTB ranges between 0% to 100% for the NTB coverage, and between 0 and 23.3 NTB per tariff line, for all sectors; iii) the average of the import penetration ratio ranged from 1.484% (for manufacture of bakery products) and 66.35% (for manufacture of vegetable and animal oils and fats); and finally, iv) firms concentration ratios ranges from 0.060% (for buyers of processing and preserving of fish and fish products) to 98.78% (for the geographic concentration of the distilling, rectifying and blending of spirits; ethyl alcohol production from fermented sector).
Given the possible endogeneity of the import penetration ratio (which also may be affected by trade barriers) exogeneity tests based on Blundell and Smith (1986) and Wooldridge (2007) were undertaken, and then specification (1) is estimated in two steps. In the first step, two import penetration equations were estimated with different instruments. The initial instruments were capital stock (measured by the real value assets), the size of labor force, and GDP as proxy of others productive factors. However, due to potential collinearities among these instruments, labor force and GDP were dropped. Given that is truncated from below at the value of one, in the second step, the import penetration variable estimated was used in the Tobit estimation of (1) Details and results of the exogeneity tests and the import penetration equation estimations are reported in a previous paper30.
Table 7 presents the coefficients of the Tobit maximum likelihood, ML, estimation of (1) and Table 8 presents the coefficient using instrumental Tobit ML estimations. Note that for robustness purposes three tariffs measures and two NTB are used. The estimation results indicate first, in both estimations (Tables 7 and 8) the import penetration variable affect positively for most of the trade barriers although with different degree of statistical significance32. Second, the influence of the firms interest group on trade barriers is robust in both estimations (Tables 7 and 8): supplier concentrated firms increase trade barriers and buyer concentrated firms decrease trade barriers33. However, the degree of statistical significance is higher for buyers than for seller firms. Furthermore, the magnitude of the influence of supplier firms was reduced for consumer and intermediate goods although not in a significant way. Regarding geographically concentrated industries (mainly in the capital of Peru, Lima with greater access to ministries), the coefficients of both estimations (M and
Table 7 Tariff and Non-Tariff Barriers Equations 2001-2015
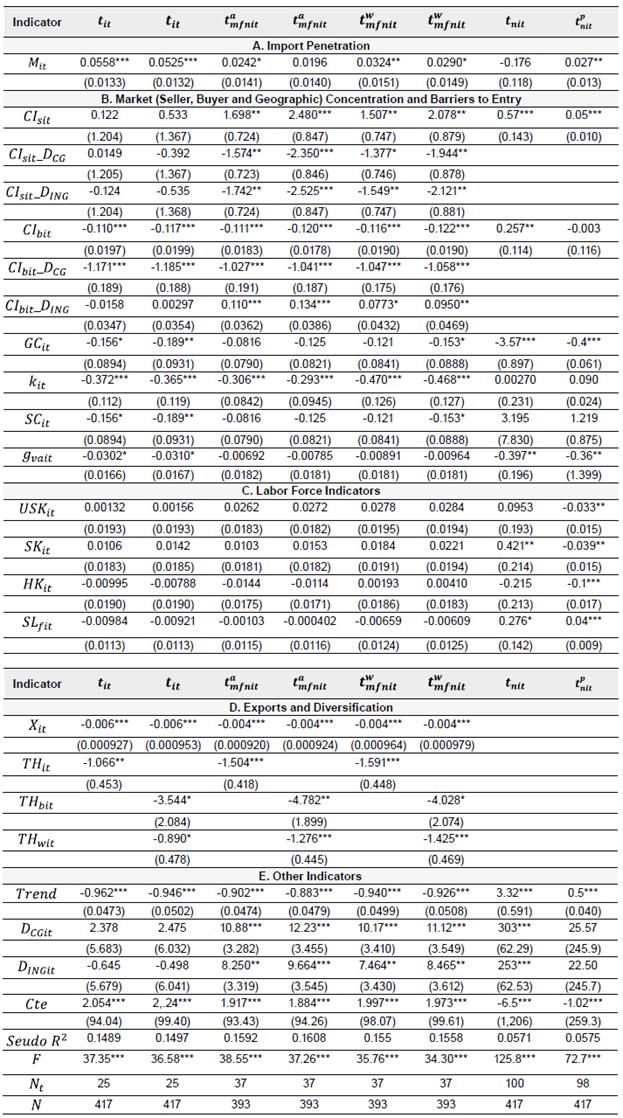
Source: SUNAT (2018a), WITS (2018a, 2018b), Peru Top (2018), INEI (2018a, 2018b, 2017, 2014, 2007), Table 6. Author's work. Nt is the number of observations that are truncated (i.e., Yit = 1).
Table 8 Tariff and Non-Tariff Barriers Equations 2001-2015 Using
Source: SUNAT (2018a), WITS (2018a, 2018b), Peru Top (2018), INEI (2018a, 2018b, 2017, 2014, 2007), Table 6. Author's work N t is the number of observations that are truncated (i.e., Yit = 1)
Fifth, due to the size of entry barriers (i.e., capital-labor ratios and the sectoral scale) the competitive capacity of firms in domestic and foreign markets seems to have eliminated the need for protection. By the same arguments, growing or advantaged sectors in which competitive firms prevail) do not seem to have needed protection either. Lastly, the effects of the type of goods on trade barriers are consistent with the staggered structure of tariffs higher for consumer goods, then intermediate goods and lastly capital goods. An interesting estimation result is that the protection (or liberal) effect of the pressures of supplier (or buyer) firms is reduced (or increased) for consumer and intermediate goods. This result is consistent with the GH model, which predicts that firms producing goods with high import elasticity (such as consumer goods) would have a lower demand for protection since the deadweight loss from protection is higher and the government would be less willing to grant protection.
In summary, the quantitative evidence seems to support the hypothesis that traditional and diversified exporters contributed to the unilateral trade liberalization experienced by Peru in period 2001-2015 and that import substitution firms (represented by suppliers concentration indicators) influenced to some degree the decreasing speed rate of tariffs and have made possible some degree of protection based upon NTB indicators34. In addition, this process was facilitated by the weak role of the formal labor force35.
CONCLUSIONS
This paper has presented quantitative evidence showing that political economy factors and actors have influenced the Peruvian process of trade liberalization in period 2001-2015. The evidence supports the hypothesis that Peruvian trade barriers liberalization in period 2000-2015 was led by the powerful MEF and accompanied by traditional and diversified exporters (that consolidated the unilateral trade liberalization) and import substitution firms. These influenced to some degree36 and reduced the speed rate of the process of the unilateral trade barriers liberalization. In addition, the unilateral trade liberalization was facilitated by the weak role of the formal labor force and consumer interest groups with liberal orientation.
Two main lessons arising from the trade liberalization process in Peru are, on the one hand, that the process must be internalized and that most of the relevant actors that influence trade policy (i.e., keys ministries, entrepreneurs, politicians, and consumers) believe in benefits of the process. On the other hand, institutional framework of trade must be organized in such way that the process flows in a coordinated way, facilitated by the absence (or low level) of restrictions or forces against liberalization.
In the case of Peru, the trade liberalization, and more specifically the liberal model, is thought by many, as the one that has produced economic growth, poverty alleviation with high degree of macroeconomic stability, and in consequence, populist cycles of economic policies have been defeated along the past two decades. In addition, not only the trade interventions of the two keys ministries (i.e., MEF and MINCETUR) have been smooth and coordinated, but also the influence on trade of formal workers has been limited mainly to labor regulations (such as, the Collective Law of Labor in July 1992 and the Law of Job Promotion) and its reduced size in the economy. Most labor force in Peru is employed on informal employment.
Although the liberal trade regime may be a natural and comfortable state for agents and people due to their supposed benefits, the liberal model and the trade regime have failed to produce economic development given the large size and the prevalence of informal employment in the labor force. The primary export structure and the light domestic industries, revitalized with the liberal trade regime, do not seem to be enough to generate formal job opportunities to include or absorb the informal labor force. Consequently, a structural productive change is needed to produce economic development with continuous and sustainable economic growth, social inclusion, and without informal employment. The Peruvian case of trade liberalization shows that policy makers should carefully consider the pro and cons of two ways to face trade policy in a developing economy such as Peru. The first way, the point of view (based upon ideology, technical fundamentals, or pragmatism) that free trade is the most convenient policy to obtain sustainable economic growth and social inclusion. The second way that trade policy should be consistent with a general economic policy that leads the economy to a sustainable economic development process with the absence of informal activities and social inclusion. In this position, the trade liberalization process (and the implementation of many PTA) experienced by Peru, may have limited other set of economic policies and instruments to yield economic development.