


 text in
  English (pdf)
 Article in xml format
 Article references
 Send this article by e-mail
 Cited by SciELO
  Cited by Google
  Similars in
SciELO
Similars in
SciELO  Similars in Google
 Permalink
INTRODUCTION
Monitoring, whether it be invasive, minimally invasive or non-invasive, supports clinical decision-making, hence its preeminent role in critical care. However, sufficient evidence on improved outcome data using one or another form of monitoring is still lacking 1. The most important thing will always be monere: warn or alert to prompt a decision before an event happens. The majority of the variables involved in hemodynamic monitoring hint at macrocirculation, because it appears to make sense that addressing macrohemodynamic variables should improve microcirculation (hemodynamic coherence); however, oftentimes this does not happen 2. Various techniques, methods and devices, ranging from clinical to invasive monitoring, are available to assess microcirculation abnormalities 3. In fact, across time, blood gases continue to prevail over lactate, base deficit (BD) or central venous oxygen saturation (SvcO2), because we know today that venous-to-arterial carbon dioxide pressure difference (Δpv-aCO2) or venous-to-arterial carbon dioxide pressure/arteriovenous oxygen content difference (Δpv-aCO2/ΔCa-vO2) reflect to cardiac output (CO), microcirculatory blood flow and anaerobic metabolism, which is perhaps the true target 4,5.
Clinical findings in shock are sensitive but not very specific when it comes to assessing microcirculatory blood flow, and practically of no account when it comes to anaerobic metabolism. Information provided by blood gases is a closer reflection of the true microcirculatory and metabolic status of the patient, as they show dysoxia and hemodynamic incoherence 6,7.
OBJECTIVE
To conduct a non-systematic review of the literature on hemodynamic monitoring using variables derived from arterial and venous blood gases.
METHOD
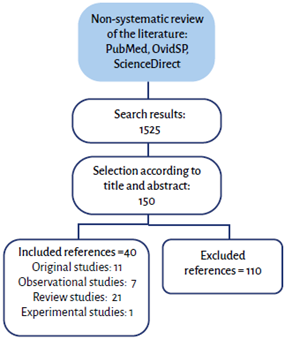
Non-systematic review of articles published between 2000 and 2020 in PubMed, OvidSP and ScienceDirect databases, using the following search terms in Spanish and English: hemodynamic monitoring, microcirculation, central venous oxygen saturation, venous-to-arterial carbon dioxide difference, venous-to-arterial carbon dioxide difference over arteriovenous oxygen content delta. Articles were selected according to title and abstract, and observational, review and original articles were included, while those that did not provide relevant information for the objective or were outside search dates were excluded. The results of this review were consistent with the authors' perspective regarding relevance, and were included if at least four authors were in agreement (Figure 1).
DEVELOPMENT
Central venous oxygen saturation (SvcO2)
A central venous catheter (CVC) and an arterial line (AL) are part of the devices required for patients in an intensive care unit (ICU) and samples from each of those lines can provide crucial information 8. The monitor is enough to gain insight into the macrocirculatory status but, for microcirculation, central venous and arterial blood gases are an excellent choice.
In healthy individuals, SvcO2 is lower than mixed venous oxygen saturation (SvmO2) by approximately 3%. This is explained by lower oxygen extraction (O2ER) from the lower body as compared to the upper body. However, this SvcO2 /SvmO2 ratio is inverted in shock. In patients with septic shock, SvcO2 is greater than SvmO2 by up to 8%, as a result of increased O2ER from the lower body (gastrointestinal tract) 9. Some studies have shown that SvcO2 may be an excellent proxy for SvmO2 values. In pathological conditions, SvcO2 rises or falls, with 70% being the normal or reference value 10.
SvcO2 is a VO2/DO2 (oxygen consumption/oxygen delivery) dependent variable: it drops when oxygen transport is low (high VO2/DO2) and increases when oxygen usage is low (low VO2/DO2). When DO2 drops, compensation occurs through O2ER increase but, without the right intervention, the compensation mechanism is not sufficient, the target point being VO2 dependence on DO2. Up to that point (cell dysoxia) SvcO2 drops in tandem with DO2 reduction and, from then on, anaerobic metabolism may give rise to disproportionate changes due to tissue hypoxia secondary to delays in timely and adequate interventions. Consequently, SvcO2 reliably reflects cell oxygenation status. In the context of low SvcO2, DO2 increase (in dependent zone) involves an increase in VO2 and, despite adequate intervention, SvcO2 remains low and will increase only after VO2 is no longer dependent on DO2 (independent zone). Low ScvO2 is not equal to DO2 increase (fluids, inotropes, vasopressors, beta-blockers, transfusion, oxygen) because such an intervention may have undesirable consequences. Rather, the answer is to reduce VO2 (pain control, sedation, mechanical ventilation, fever control, treatment for agitation, tremor or shivering control) and, consequently, perhaps the best option is a personalized intervention. High SvcO2 may be an indication of improvement, but also of inadequate VO2. Therefore, elevated SvcO2 does not rule out the need for therapeutic interventions and, in any case, whether it is low, normal or high, the best option is to add Δpv-aCO2 and Δpv-aCO2/ΔCa-vO2. Although lactate can be used, it is not the best option because it does not necessarily reflect tissue hypoxia or anaerobic metabolism; it should not be interpreted as a single or isolated variable, considering that there are non-hypoxic mechanisms that determine a higher reading 11,12.
O2ER represents the amount (%) of oxygen consumed (extracted) by cells from arterial blood. Non-extracted oxygen returns through the venous circulation (SvcO2) to the right cardiac cavities for reoxygenation in pulmonary circulation. In non-pathologic conditions, O2ER of 20-30% is considered normal. Any rise in O2ER (low SvcO2) reflects increased cell metabolism (hypoxia); in contrast, a drop in O2ER (high SvcO2) reflects diminished cell metabolism (hyperoxia) 13,14. Defining hypodynamic or hyperdynamic requires looking beyond the clinical condition to include cardiac index < 2.5 L/min/m2, SvcO2 < 70% or O2ER > 30% (hypodynamic); or, conversely, cardiac index ≥ 4.0 L/min/m2, SvcO2 ≥ 80% or O2ER ≤ 20 % (hyperdynamic) 15,16(Figure 2).
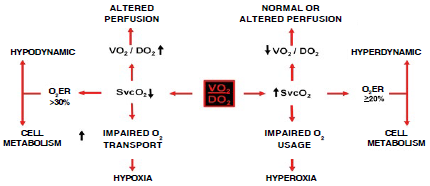
O2ER: oxygen extraction, SvcO2: central venous oxygen saturation, VO2/DO2: oxygen consumption/oxygen availability. SOURCE: Authors.
FIGURA 2 Central venous oxygen saturation and oxygen consumption and availability ratio.
When a given SvcO2 value is analyzed, it involves the assessment of the interaction between all its determinants: 1) oxygen inflow, 2) transport 3) availability and 4) consumption 13(Figure 3). To assess oxygen delivery and consumption in the tissues, knowledge of the following formulas is required 17:
DO2 = GC × CaO2
VO2 = GC × (CaO2 - CvO2)
EO2 = (CaO2 - CvO2) / CaO2 o (SaO2 - SvcO2) /
SaO2 o VO2 / DO2
EO2 = (1 - SvcO2)
CaO2 = (Hb × 1,34 × SaO2) + (PaO2 × 0,003)
CvO2 = (Hb × 1,34 × SvO2) + (PvO2 × 0,003)
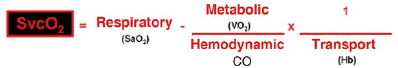
CO: cardiac output, Hb: hemoglobin, SaO2: arterial oxygen saturation, SvcO2: central venous oxygen saturation, VO2: oxygen consumption. SOURCE: Authors.
FIGURE 3 Determinantes de la saturación venosa central de oxígeno.
Where: CaO2 is arterial oxygen content and CvO2 is venous oxygen content.
Venous-to-arterial carbon dioxide pressure difference (Δp(v-a)CO2)
Carbon dioxide (CO2) provides even more valuable information on macro and microhemodynamics than oxygen (O2) variables. CO2 changes faster than lactate levels 18. It is the metabolic product of the Krebs cycle. In the context of aerobic metabolism, increased tissue CO2 reflects greater oxidative metabolism or a higher intake of dietary carbohydrates 19. On the other hand, this increase in CO2 may be due to greater anaerobic metabolism 20.
Δp(v-a)CO2 is obtained by means of one central venous and one arterial blood gas measurement and it is the difference between venous pCO2 and arterial pCO2. Its normal value ranges between 2 and 6 mmHg 21. Changes in Δp(v-a)CO2 are determined by the degree of blood flow (perfusion) and not by the degree of tissue hypoxia. Increases in Δp(v-a)CO2 are associated with a reduction in tissue blood flow (ischemic hypoxia) in controlled settings, as long as adequate oxygen delivery to the tissues is ensured 22. When Fick's equation is applied to CO2 metabolism, its clearance is found to depend on the difference between CO2 content in venous blood (G/CO2) and CO2 in arterial blood (CaCO2), multiplied by cardiac output or (CvCO2 - CaCO2) χ CO. Consequently, the main determinant of changes in Δp(v-a)CO2 is CO, and it is inversely proportional to it 23. Even at low CO, a patient can respond to hyperventilation with a normal or low Δp(v-a)CO2 24. Therefore, Δp(v-a)CO2 depends on CO, CvCO2 - CaCO2 difference, VCO2, alveolar ventilation and, to a lesser extent, on microcirculatory blood flow alterations. This means that Δp(v-a)CO2 is a bedside surrogate of CO and microcirculatory blood flow. Studies have shown that, during hypoxic hypoxia (normal blood flow and lowered O2 arterial pressure), Δp(v-a)CO2 is < 6 mmHg; in contrast, during ischemic hypoxia (diminished blood flow and normal O2 arterial pressure), Δp(v-a)CO2 is > 6 mmHg 25(Figure 4).
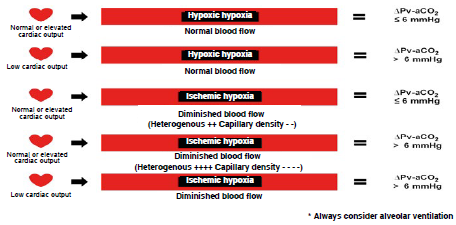
Δpv-aCO2: carbon dioxide venous-to-arterial pressure delta, mmHg: millimeters of mercury. SOURCE: Authors.
FIGURE 4 Types of hypoxia.
Δp(v-a)CO2 reliably reflects CO variations in non-inflammatory shock states (hypovolemic, obstructive and cardiac), considering that the main change in blood flow is in the macrocirculation, unlike what happens in septic shock, where the main problem is microcirculatory blood flow, depending on capillary heterogeneity and density 26,27.
Venous-to-arterial carbon dioxide pressure difference/arteriovenous oxygen content delta (Δp(v-a) CO2/ΔC(a-v)O2)
The relationship between CO2 production (VCO2) and O2 consumption (VO2) is represented by the respiratory quotient (RQ = VCO2/VO2) which ranges between 0.6 and 1, depending on individual metabolic and energy conditions. In aerobic and resting conditions, VCO2 is not greater than VO2 and, therefore, the RQ is < 1; however, in anaerobic conditions, VCO2 is greater than VO2 resulting in a RQ>1 28,29. Δp(v-a)CO2/ΔC(a-v)O2 is a useful surrogate of RQ = VCO2/VO2 since, according to Fick's equation, CO is present in the numerator and the denominator and cancels out, removing the blood flow component and leaving the venous-to-arterial CO2 content difference (ΔCv-aCO2) and the venous-to-arterial O2 content difference (ΔCa-vO2) as the main determinant, providing the RQ result without the need for indirect calorimetry. Because it is less invasive and offers a good correlation, Δp(v-a)CO2 has replaced ΔCv-aCO2 in obtaining Δp(v-a) CO2/ΔC(a-v)O2 through one central venous and one arterial blood gas measurement, which allows to identify those patients in an anaerobic state 30,31(Figure 5).

CO: cardiac output, RQ: respiratory quotient, VCO2: carbon dioxide production, VO2: oxygen consumption, ΔCavO2: arteriovenous oxygen content delta, ACv-aCO2: venous-to-arterial carbon dioxide content delta, Δpa-vO2: arteriovenous oxygen pressure delta, Δpv-aCO2: venous-to-arterial carbon dioxide pressure delta. SOURCE: Authors.
FIGURE 5 Simplified respiratory quotient formula.
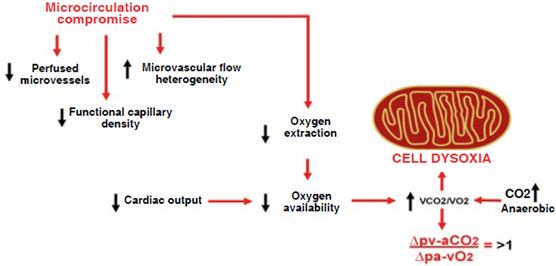
Δp(v-a)CO2/ΔC(a-v)O2 > 1 is associated with microcirculatory abnormalities that lead to O2ER reduction which, added to the drop in CO, results in a lower DO2. Moreover, the increase in anaerobic CO2 favors cell dysoxia (Figure 6). If shock is reverted promptly Δp(v-a)CO2/ΔC(a-v)O2 can return to values < 1. Evidence suggests that improved microcirculatory blood flow distribution can revert anaerobic metabolism (32).
Elevated lactate does not always reflect tissue hypoxia or anaerobic metabolism and should, therefore, be used together with Δp(v-a)CO2/ΔC(a-v)O2 in order to provide more accurate information at any point during patient assessment. Δp(v-a) CO2/ΔC(a-v)O2 > 1 together with lactate > 2 mmol/L suggests tissue hypoxia and anaerobic metabolism with certainty, and should prompt the physician to optimize macro and microcirculation. In contrast, lactate levels > 2 mmol/L accompanied by Δp(v-a)CO2/ΔC(a-v)O2 <1 require reassessing the origin of those levels and refraining from interpreting the result as tissue hypoxia or anaerobic metabolism 33-35. In 2016, in patients with septic shock admitted to our ICU, it was found that Δp(v-a)CO2/ΔC(a-v)O2 > 1.4, measured 24 hours after admission, increases the risk of 30-day mortality by 5.49 (95% CI [1.0728.09]), p = 0.04, and is an independent predictor of mortality. On the other hand, lactate was > 2 mmol/L in 93% of the patients who did not survive while only 43% of the survivors had lactate levels > 2 mmol/L, with a p value = 0.003 36. A comparison carried out in 2019 in patients with normodynamic and hyperdynamic septic shock found higher anaerobic metabolism in hyperdynamic patients compared to normodynamic patients, with a Δp(v-a)CO2/ΔC(a-v)O2 of 2.43 vs. 1.65, respectively; however, hyperdynamic patients had less microcirculatory blood flow alterations, with a Δp(v-a)CO2 of 4.77 vs. 6.17 in normodynamic patients, although this could be accounted for by elevated CO and not necessarily by differences in microcirculation 37.
Changes in CO2 (Haldane effect), hemoglobin concentration and tissue O2ER influence Δpv-aCO2 and Δpv-aCO2/ΔCa-vO2 despite preserved or even increased tissue perfusion. The most important counterargument has to do with the interaction on the CO2 dissociation curve. Another important piece of information is the ideal cutoff point for Δpv-aCO2/ΔCa-vO2 which is not well defined, although it ranges between 1.4-1.68 mmHg/mL 38-40. Figure 7 shows the algorithm for hemodynamic monitoring using blood gas analysis.
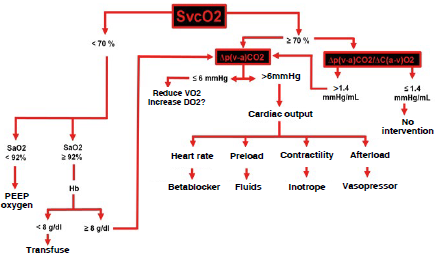
G/dL: grams/deciliter, Hb: hemoglobin, mmHg: millimeters of mercury, mmHg/mL: millimeters of mercury/milliliter, PEEP: positive end-expiratory pressure, SaO2: arterial oxygen saturation, SvcO2: central venous oxygen saturation, VO2: oxygen consumption, Δpv-aCO2: venous-to-arterial carbon dioxide delta, Δpv-aCO2/ΔCa-vO2: venous-to-arterial carbón dioxide pressure delta/arteriovenous oxygen content delta. SOURCE: Authors.
FIGURE 7 Algorithm for hemodynamic monitoring based on two blood gases.
CONCLUSION
Hemodynamic monitoring using blood gas analysis has been and will continue to be a bedside diagnostic tool that enables optimum and timely intervention. Whether static or dynamic, the ideal hemodynamic monitoring method does not exist. Measurement interpretations and decision-making will always be operator-dependent, creating advantages and disadvantages. Blood gas analyzers are readily available in any hospital, unlike sophisticated monitors. Δpv-aCO2 and Δpv-aCO2/ΔCa-vO2 are excellent markers or microcirculatory blood flow and anaerobic metabolism, respectively. Hemodynamic monitoring using two blood gases measurements is an option that allows to establish a diagnostic and therapeutic pathway and work on the premise of not more, not less, only what is needed.
ETHICAL RESPONSIBILITIES
Human and animal protection
The authors declare that no experiments were carried out in humans or animals for this research.
ACKNOWLEDGEMENTS
JSSD: Original idea, literature search, drafting of the development and conclusions sections, figure design and creation.
KGPM: Literature search, development and conclusions drafting.
GRS, EAMR, ORPN y MAGG: Literature search, development drafting.
DCOL: Literature search, development drafting, figure design.
EIZL: Literature search, development drafting, figure creation.
EMZ: Literature search, development drafting, figure design and creation.

