


 text in
  English (pdf)
 Article in xml format
 Article references
 Send this article by e-mail
 Cited by SciELO
  Cited by Google
  Similars in
SciELO
Similars in
SciELO  Similars in Google
 Permalink
What do we know about this issue?
Aunque en la actualidad existen sistemas de lazo cerrado para la administración de la anestesia, la falta de tecnologías que hagan más viable la investigación de la actividad eléctrica cerebral durante un procedimiento con anestesia general impide que haya más datos acerca de la actividad cerebral. La introducción de tecnologías de menores costos permitirá recolectar información en grupos mayores de pacientes sin introducir riesgos adicionales para los mismos.
What is the novel contribution from this study?
Es un primer reporte de los cambios de la actividad α frontal en pacientes bajo anestesia general cuya actividad cerebral fue capturada con equipos portables y de bajo costo.
INTRODUCTION
General anesthesia is a medical intervention that prevents patients from experiencing any pain (analgesia) during surgical procedures, or having after memories (amnesia), and remain in a hypnotic and muscle relaxation status with reflex inhibition. 1,2 This is achieved with the use of anesthetic drugs that regulate the balance the patient experiences between loss of awareness and the intensity of the surgical stimulation - also known as depth of anesthesia-. 2
During anesthesia, patients are monitored to control their hemodynamic condition and the effect of anesthesia, according to physiological variables such as blood pressure, heart rate, respiratory rate, eye movement, tearing, among other variables. 2 Although these characteristics are helpful for the anesthesiologists, they fail to deliver direct information about the depth of anesthesia 2, making it challenging to find the tools to measure such depth in real time, and to reduce the rate of awareness during surgery and prevent adverse effects leading to delirium or cognitive decline, both of which could be more critical in elderly patients. 3 One alternative is to monitor the brain response to the anesthetic agents using electroencephalography. 4
Electroencephalography (EEG) records the electrical activity of the brain using electrodes placed on the scalp, to monitor the neuronal dynamics during anesthesia. 5,6 The EEG signal has oscillatory characteristics, and its analysis is usually done in five frequency bands 6: delta (δ) ([0,5,4] Hz), theta (θ) ([4,8] Hz), alpha (α) ([8,13] Hz), beta (β) ([13,30] Hz) and gamma (γ) ([30,90] Hz). The oscillatory activity changes with the state of awareness, hence its quantitative analysis (qEEG) is relevant to obtain biomarkers of depth of anesthesia. 1,7 The patterns may be described in terms of three periods: induction, maintenance and emergence. Such variations in the oscillatory activity will depend on the type of medication and the age of the patient. 8
During the induction period, low doses of propofol increase the presence of the beta band in the frontal regions and decrease the alpha band. At the end of this time period there is loss of consciousness and the eye movement artifact emerges. An increase in the concentration of anesthetic to maintain the loss of consciousness involves beta band oscillations over more extensive regions of the scalp and also an increase in the alpha band in the frontal electrodes in contrast to the posterior electrodes; this phenomenon is called anteriorization of the alpha rhythm or alpha predominance 9,10, and this is the optimal level to do the surgery. 9 Further increases may lead to the emergence of burst-suppression patterns mainly characterized by alternating beta and alpha rhythms with flattening of the signal. For the recovery process, the EEG seems to show a reversed pattern from the pattern observed during loss of consciousness; however, there are marked differences pointing to a different neurobiological mechanism that should be highlighted. 9
There are a number of devices that measure changes in the behavior of the EEG signal using secured algorithms which measure the level of unconsciousness of the patient. 11. The most popular commercial system is the bispectral index (BIS), which measures the changes in consciousness based on BetaRatio and SynchFastSlow, calculated as combinations of the ratios at different frequency bands within the 0.5 to 47 Hz range. 12 However, not all devices deliver an EEG signal tracing to know whether the signal is being affected by the sources of noise present in the operating room or not, neither are they applicable to the different types of anesthetic agents, since each device is usually associated with an algorithm that is sensitive to a particular drug. 13
There are a lot of unanswered questions with clinical implications that encourage research on EEG activity during anesthesia, such as changes associated with the age of the patient, particularly variable in those less than 2 years old or in the elderly (over 65 years old). 1,8 Additionally, we are not certain about the regions of the brain that should be measured during anesthesia, since although the frontal region shows evidence of clear EEG changes with propofol, the response to thiopental is not the same. 14. These problems point to the need to have tools available to advance research in the field and identify solutions.
Although there are different EEG machines for research purposes, their high cost and large size, hinder the widespread use of this technique in anesthesia research. 7 Wireless technologies have accomplished significant breakthroughs over the past few years, enabling the development of portable systems for EEG signal acquisition. 15 These new technologies are low-cost, small and portable, which are important considerations for surgical environments, since there will be needed to record in controlled environments or for long periods of time to place the electrodes. 16,17
This article discusses the potential benefits of the OpenBCI portable EEG recording tool 18, to capture and store the brain activity during anesthesia. The objective was to assess the capabilities of a portable EEG technology to capture brain rhythms associated with the state of consciousness and the state under general anesthesia in patients undergoing surgery anesthetized with propofol.
METHODS
An observational study with 10 female volunteer patients was conducted with which an EEG recordings database was created. The patients underwent cosmetic surgeries with propofol as the anesthetic agent with a convenience sampling approach. The study was a cross-sectional design. The authorization was obtained in an informed consent approved by the Ethics and Research Committee of IPS Universitaria, Medellín, Colombia, Protocol 132 of March 2019. The inclusion criteria to avoid selection bias was patients with no sex distinction, who were candidates for short-to-medium-length cosmetic surgeries, with an age range between 18 and 60 years old, using propofol.
Patients who were candidates for cosmetic surgeries around the head, or involving excessive patient movements, such as liposuction and rhinoplasty were excluded. Therefore, the procedures included breast augmentation or breast reconstruction. Additionally, patients with metallic implants in the head or around the head region were also excluded, as well as patients with a medical history not suitable for the procedure and/or contraindications for the anesthetic agent, a history of drug abuse, pregnancy, or with neurological, muscular, cardiac, respiratory, kidney or liver disorders.
For the acquisition of signals, an 8-channel Cyton Biosensing Board unit was used 18 according to the 10-10 international system. The electrodes were placed at AFz, Fz, F3, F4, sites that belong to the frontal region; for the central region, the electrodes were placed at Cz, C3, C4 and for the parietal region, one electrode was placed at Pz. Electrodes A1 and A2 were attached to the mastoid process (Figure 1), the first one as ground (GND) and the second one as reference (REF). The OpenBCI Gui software 19 was used for visualization and storage of the EEG the signals.
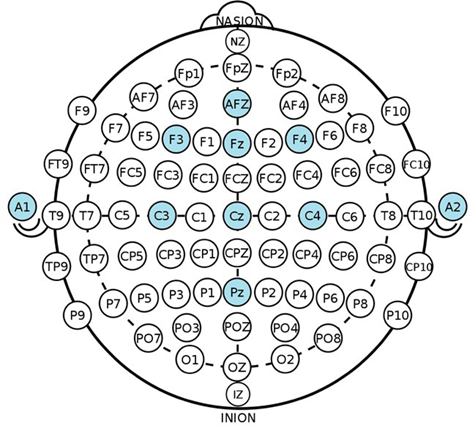
Placement of electrodes used in the study according to the 10-10 international system. SOURCE: Authors.
FIGURE 1 Electrode montage for signal acquisition using OpenBCI.
To do the recordings, the patients showed up with clean and dry hair, free from gels, creams or conditioner. The institutional staff made sure that the patients complied with this requirement and met the inclusion criteria for viable recordings according to the availability of surgical procedures. The institutional staff was also responsible for coordinating the involvement of the researchers during the surgical procedures. Prior to the procedure, and after implementing the measures to setup the EEG, the scalp was cleaned with alcohol and dermabrasive gel at the sites where the electrodes were to be placed, electrode conductive cream was used and the electrodes were then secured with micropore.
Each patient's EEG recording comprised 3 parts:
The first part was done with the patient laying down and at rest before going to surgery. The recordings were acquired, one with the eyes opened and another one with the eyes closed, each lasting 2 minutes.
The second part was recorded in the operating theater, making notes about relevant moments such as the beginning of the propofol infusion, as well the first scalpel and electric knife cuts. The recording stopped a few minutes after these first cuts.
The third part began recording after the beginning of suturing at the end of surgery, then a record was made when starting to taper the propofol infusion, up to partial regaining of consciousness, based on questions asked to the patient, such as "How are you feeling"? or "Are you experiencing any pain"?
Based on the information recorded in each channel, pairs of electrodes were selected to organize bipolar configurations and analyze them in accordance with the distribution of the zones of interest in the brain. The electrode montages were F3 - Fz and F4-Fz, which are 3 of the 4 electrodes placed in the frontal region, which according to the literature correspond to an EEG monitoring zone in anesthesia. 20 The analyses were done using Python 3.7: NumPy scientific libraries for data manipulation, Matplotlib for plotting SciPy for filter design and frequency analysis. 21
The most relevant waves for analysis were the slow waves (theta, alpha, beta) that guide the depth of anesthesia 7,20, particularly the alpha waves. Two filters were used to adapt the signals and attenuate any external noise, a high-pass filter with a cut-off frequency of 3 Hz and a low-pass filter with a cut-off frequency of 50 Hz, with the intent of avoiding filtering the 60 Hz power grid but still having the gamma wave contribution filtering any high-frequency oscillations (high gamma >50 Hz) which fail to deliver any relevant information for the study 7,20 and are susceptible to high frequency artifacts. The low cut-off frequency is intended to avoid any noises that may be caused by small impedance changes.
Once the filtered signals were available, a visual exploration of the signal from each participant was conducted, which revealed differences among all the subjects under the same timeline, with a separate assessment for each recording: before, during and at the end of surgery. For the frequency domain analysis, three recordings were used: eyes opened, eyes closed and low anesthesia status. Each opened and closed eyes recording was 50 seconds long and the anesthesia status was recorded for 800 seconds, which for comparative purposes were divided into 16-time windows of 50 seconds each. These data were collected 2 minutes into the propofol infusion, to analyze the recordings under the effect of the drug.
The power spectrum was estimated using Welch's method 22, provided by Scipy library in its Python 3.7 Signal, with overlapping 2-second and 1-second windows. For each subject, the power of the different bands was obtained with closed eyes, opened eyes and anesthesia. 16 power measurements in the various frequency bands were used for anesthesia. The power spectrum result was normalized due to the impedance effect from each electrode to the analysis comparable among the subjects. The relative power was estimated by dividing the power from each frequency band with respect to the power sum of all the bands and multiplying the result times 100 to express the result as a percentage.
Statistical analysis
The initial comparisons were based on the type of recording: opened eyes, closed eyes and under anesthesia. No group classification of the signals from the subjects was performed according to their sociodemographic characteristics. The results for the different bands and conditions were explored using statistical descriptors such as median and interquartile range.
To analyze the effect of the drug on the EEG tracing, the difference between resting eyes closed and each of the 16 windows obtained during anesthesia, using the t test developed by Glerean et al. 23, where the null distribution is obtained by permutations (5,000 permutations). This procedure was repeated for each band so that a correction was made for each comparative window for multiple comparisons using the false discovery rate (FDR). Considering the exploratory nature of this study, no sample size estimate was done.
RESULTS
10 recordings of female patients aged 29.42 years (1 SD = 6.98 years) were conducted. One patient was excluded from the analysis because during surgery, the reference electrodes and ground loosened resulting in the subsequent loss of the EEG signal.
Frequency bands assessment
Figure 2 shows the time response of the recordings of one of the participants at 3 significant points in time: opened eyes, closed eyes and anesthesia, each lasting 2 seconds. These recordings illustrate the general behavior of the signals acquired, for which the resulting tendency was changes in voltage amplitude and in the frequency of the oscillations when passing from one state to the next.
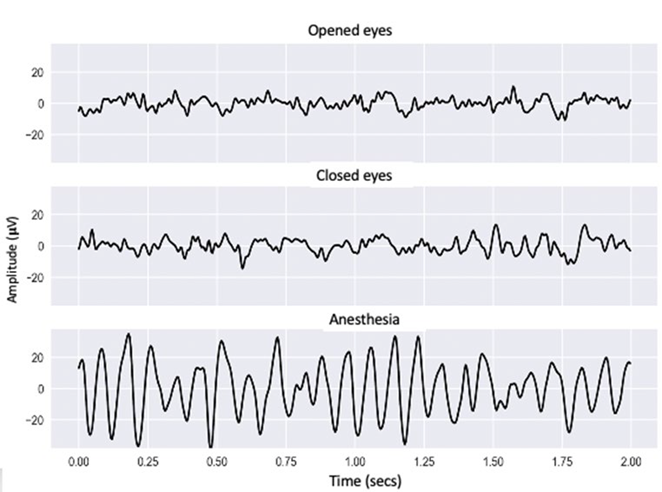
Graphical representation of the EEG signal of one of the participants in the study in a 2-second time period with opened eyes, closed eyes and under anesthesia. SOURCE: Authors.
FIGURE 2 Acquired signals from one of the participants in the study during consciousness and under anesthesia.
Under "anesthesia" a larger signal amplitude and decreased oscillation frequency were observed, in contrast with the "opened eyes" and "closed eyes" moments outside of surgery, when the amplitudes were narrower, and the oscillations were faster.
Table 1 is a quantitative representation of the median and the one and three quartiles of the relative powers for closed ayes, opened eyes and anesthesia in the left hemisphere (montage F3-Fz) and in the right hemisphere (montage F4-Fz). The montages showed an increase in the alpha median, while gamma experienced a visible progressive decrease with anesthesia. The values of the other delta, theta and beta bands did not show any significant changes.
Table 1 Relative power contribution from delta, theta, alpha, beta and gamma, in montages F3-Fz and F4-Fz.
| Relative Power [median (Q1 - Q3) ] [%] | ||||||
|---|---|---|---|---|---|---|
| Delta | Theta | Alpha | Beta | Gamma | ||
| F3 - Fz | Opened eyes | 14.76 (8.3826.49) | 21.92 (14.0731.17) | 15.75 (8.71-26.33) | 21.44 (14.6627.15) | 10.77 (5.53-20.20) |
| Closed eyes | 13.82 (7.55-21.77) | 21.25 (12.8529.47) | 18.57 (10.6727.11) | 22.34 (15.7329.32) | 12.52 (7.00-21.31) | |
| Anesthesia | 13.00 (8.0521.21) | 19.03 (12.7126.59) | 35.25 (22.9144.44) | 23.53 (17.5732.26) | 1.11 (0.70-1.97) | |
| F4 - Fz | Opened eyes | 9.99 (6.6915.06) | 22.29 (15.4231.85) | 15.41 (9.4625.70) | 20.94 (15.5026.55) | 11.23 (6.72-18.7) |
| Closed eyes | 13.93 (7.5723.56) | 21.87 (15.4030.40) | 15.62 (8.9826.68) | 22.25 (17.5526.61) | 12.43 (7.83-20.71) | |
| Anesthesia | 11.71 (6.2924.08) | 18.79 (13.6227.48) | 32.49 (18.7446.91) | 19.09 (12.5429.03) | 1.11 (0.55-3.33) | |
SOURCE: Authors.
Figure 3 shows the results of the relative powers for the different frequency bands in 3 of the 16-time windows obtained during anesthesia. The rows illustrate the frontal electrode montages F3-Fz and F4-Fz, while the columns represent the three windows: beginning, middle and end of the data analyzed. The figure depicts the differences among the time periods and the conditions with opened and closed eyes prior to surgery.
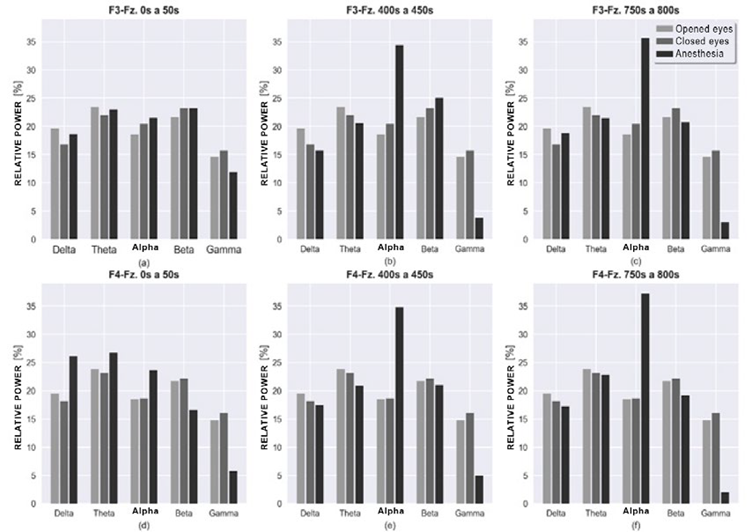
Relative power graph for montages F3-Fz and F4-Fz, of frequency bands for closed eyes, opened eyes and anesthesia with 50 seconds slots of analysis for each. The columns in the graph indicate time windows for the anesthesia status from 0 to 50 seconds, 400 to 450 seconds and 750 to 800 seconds. SOURCE: Authors.
FIGURE 3 Relative power of the frequency bands during consciousness, and under anesthesia, for both hemispheres.
The first column does not show major differences between the anesthesia bands versus the out of surgery status. However, in F4-Fz there was a power increase in delta, theta and alpha bands at the beginning of anesthesia and a decrease in beta. No relevant differences were observed in both hemispheres, among the out of surgery status.
Under anesthesia, at 400 and 750 seconds, respectively, alpha changed significantly in both hemispheres as compared to the first 50 seconds, showing a peak that stands out as compared the contributions of the other bands. For high frequencies, in this case the beta and gamma bands, there was a decrease as time progressed with the gamma frequency being the most significant.
Table 2 represents the results of the statistical comparison of the relative powers obtained with closed eyes and in each of the 16 windows under anesthesia. The changes in the alpha band during most of the windows were reviewed, and continuously the effect was more evident for the left hemisphere. There was a constant gamma band reduction in this same hemisphere. A similar trend was observed for the right hemisphere, though in a smaller number of windows.
TABLE 2 Results of the statistical comparisons*.
| Time windows | F3 - Fz | F4 - Fz | ||||||||
|---|---|---|---|---|---|---|---|---|---|---|
| Delta | Theta | Alpha | Beta | Gamma | Delta | Theta | Alpha | Beta | Gamma | |
| 1 | + | Ns | Ns | Ns | - | Ns | Ns | Ns | Ns | Ns |
| 2 | Ns | Ns | Ns | Ns | - | Ns | Ns | Ns | Ns | Ns |
| 3 | Ns | Ns | + | Ns | - | Ns | Ns | Ns | + | Ns |
| 4 | Ns | Ns | + | Ns | - | Ns | - | Ns | + | Ns |
| 5 | Ns | Ns | + | Ns | - | Ns | - | Ns | + | Ns |
| 6 | Ns | Ns | + | Ns | - | Ns | - | Ns | + | Ns |
| 7 | Ns | Ns | + | Ns | - | Ns | Ns | + | Ns | - |
| 8 | Ns | Ns | + | Ns | - | Ns | Ns | + | Ns | Ns |
| 9 | Ns | Ns | + | Ns | - | Ns | Ns | + | Ns | - |
| 10 | Ns | Ns | + | Ns | - | Ns | Ns | + | Ns | - |
| 11 | Ns | Ns | + | Ns | - | Ns | Ns | + | Ns | - |
| 12 | Ns | Ns | + | Ns | - | Ns | Ns | + | Ns | - |
| 13 | Ns | - | + | Ns | - | Ns | Ns | + | Ns | - |
| 14 | Ns | - | + | Ns | - | Ns | Ns | + | Ns | - |
| 15 | Ns | Ns | + | - | - | Ns | Ns | + | Ns | - |
| 16 | Ns | Ns | + | Ns | - | Ns | Ns | + | Ns | - |
*p<0.05 FDR corrected in each window.
Notes: The '+' sign indicates that the values obtained during anesthesia were higher than the values acquired with closed eyes. The'-' sign indicates that the values obtained during anesthesia were lower than those acquired with closed eyes. 'Ns' means no significant difference.
SOURCE: Authors.
DISCUSSION
The results obtained with the portable equipment indicate that it is possible to acquire an EEG signal in a surgical environment; it allowed for capturing the typical changes in amplitude and frequency reported in anesthesia; i.e., larger amplitude and lower frequency waves in contrast with rest. 9,24 Furthermore, with the patient anesthetized, 95 % of the waves present are delta, theta and alpha, with a prevalence of alpha, as mentioned before 3; and the power decreases in the beta and gamma rhythms.
Moreover, there is a variation in the frequency bands when changing from a conscious relaxed state to unconsciousness as a result of the anesthetic drug (Table 1andFigure 3). This change is mainly the result of the beta band contribution and the increased contribution of the alpha band.
The change in the alpha band could be statistically measured, and it was found that the increase was significant in the left hemisphere after five minutes of propofol infusion. At this time differences were found in the right hemisphere, but in the beta band, hence three more minutes were needed to make the alpha pattern statistically significant. The changes among the bands could be due to the use or relative powers, since when estimating proportions, any change in one band alters the percentages in the other bands, instead of using absolute powers as has been the case in previous trials. 10 The estimate of the absolute powers introduces a source of variation associated with the difference in impedance between subjects, a variance that is impossible to capture with the limited sample of the study, but which could be assessed as the number of subjects registered increases.
The scope of the study was to assess the alpha predominance during anesthesia; therefore, the decision was to limit the analysis of the delta band to convenience sampling, to avoid low frequency noise. This deserves further analysis in other studies, since the oscillations in the lowest delta range are present in an unconscious state. 7 Furthermore, since this study was conducted in a non-controlled environment (such as a laboratory), some artifacts could have been captured in the recordings, particularly in the delta and gamma waves which are more susceptible on account of their frequency, but an effort was made to eliminate those artifacts through filtering.
Though the intent was to control biases, there could have a potential selection bias. 25 The cases were all females using a convenience sampling instead of random sampling. Only the people who wanted to participate were selected, when the surgery was suitable, and the individual met the requirements to do the recording. Additionally, due to the availability of this type of surgery, to the drug used and the time for implementation of the project, it was impossible to expand the sample. Future recordings may be done in male patients and other age groups for improved validity. The possibility to extend the duration of the recording when the patient begins to recover consciousness after surgery is another option to be explored, for a more comprehensive monitoring of the patient over that transition period.
With regards to the portable technologies, there is currently some research and papers available based on this type of EEG acquisition for diagnostic purposes. In a study conducted by Igor Fridman et al. 26, portable technology was used with dry electrodes to record neonate patients for the diagnosis of seizures, with ease of electrode placement, with no skin lesions over one hour of recording and reduced susceptibility to external electronic interference. 26 Then Martin G. Bleichner and Stefan Debener 27 suggested the transparent EEG concept, a type of almost invisible portable technology using a matrix of sensitive sensors, connected to a portable amplifier for the least possible disruption in the everyday activities of the user, through discrete EEG acquisition from areas around the ear and significant continuous recordings. 27
These studies bring us closer to the portable EEG technologies to be able to record outside the laboratory environment, with increasingly ergonomic and comfortable designs. 27 Pilot studies have been identified for the use of portable EEG technologies to monitor neurologic patients at home 28, but no studies have been found assessing portable equipment in anesthesia, so this may be the first paper describing the results of alpha predominance using low cost, portable EEG.
A possible future endeavor is to study the alpha peak to differentiate conscious states using this portable equipment. However, one option to the algorithms based on the analysis of the frequency domain are those based on the information theory that capture the loss of EEG signal complexity 29, given the increased EEG regularity during anesthesia. 5 Information theory-based algorithms have improved performance to differentiate whether the patient is conscious or unconscious and are a better reflection of the different levels of general anesthesia. 27,29-31 With the database developed, there is the possibility to explore the performance of these measures based on the signal acquired using the OpenBCI equipment.
ACKNOWLEDGEMENTS
Contribution by the authors
VGG and DLL: EEG signal recording, programming of processing routines and analysis of results.
CSR, SRA, EMG and JDML: Assisted with EEG signal recording and the analysis of the results.
FJGO: Analysis of the results and coordination of the anesthesiology residents' team.
JFOG: Coordinated the team of engineers, prepared the processing algorithms and analyzed the results.

