


 text in
  English (pdf)
 Article in xml format
 Article references
 Send this article by e-mail
 Cited by SciELO
  Cited by Google
  Similars in
SciELO
Similars in
SciELO  Similars in Google
 Permalink
INTRODUCTION
Postoperative Nausea and Vomiting (PONV) are the most widely studied adverse events in anesthesia, because of its high frequency, direct relationship with patient satisfaction and potential subsequent consequences. 1
Certain conditions are present in cesarean section procedures that favor the development of PONV: hypotension, reduced aortocaval compression-associated cardiac output, uterine exteriorization, administration of uterotonic agents, and spinal morphine. 2,3 Its incidence is estimated at 23-79%, which increases patients' discomfort or side effects such as aspiration of gastric contents, increased pain and postoperative bleeding. 2-4
Prognostic predictive models have been developed for the non-obstetric and pediatric population which enables individualized treatment approaches through the identification of risk factors and the classification into risk groups, implementing prophylactic treatment algorithms. These algorithms have enabled a rational use of medications that reduce any associated side effects, post-anesthesia care unit (PACU) length of stay and healthcare costs. 1
The Apfel simplified risk score is the most widely used method because of its convenience and simplicity. However, patients under regional anesthesia and pregnant women were excluded when the model was developed 3,5, and hence it is impossible to extrapolate the model to the obstetric population.
Currently there is no PONV prognostic scale which has been adapted or developed for cesarean section; hence, the purpose of this study was to develop and validate a prognostic forecasting scale based on a statistical model for PONV in cesarean section, under spinal anesthesia.
METHODS
Prospective, cohort study including 703 pregnant patients from third_level obstetric care settings 6, between August 2017 and January 31st, 2019 in Medellín, Colombia. The study was approved by the Bioethics Committee of the Medical Research Institute, School of Medicine, University of Antioquia, Medellín, Colombia, pursuant to Minutes No. 019, dated December ist, 2016.
The patients included were ≥16 year old, with a gestational age ≥37 weeks, ASA I-III classification, scheduled for cesarean section delivery under spinal anesthesia - whether elective or emergent -; the patients accepted to participate and signed the informed consent.
Patients with nausea or vomiting during the 24 hours prior to the surgical procedure, patients with inadequate spinal block which required switching to general anesthesia, fetal congenital malformations, multiple pregnancy or psychological and behavioral disorders of the mother which hindered the collection of data, were all excluded.
The spinal anesthesia was administered using a 27 G pencil point spinal needle, with a combination of 10 mg of 0.5% hyperbaric bupivacaine, 100 μg of morphine and 25 μg of fentanyl. As part of the institutional care protocols, all patients received 8 mg dexamethasone for PONV prophylaxis, a phenylephrine infusion for vasopressor prophylaxis, and uterine exteriorization was avoided, pursuant to the Declaration of the Consensus and Recommendations of the Society of Obstetric Anesthesia and Perinatology. 7
The primary outcome was the development of nausea, vomiting, or a combination thereof, following the surgical procedure. The clinical assessment was conducted six hours after surgery, which corresponds to the length of stay in the post-anesthesia care unit (PACU).
The patients were considered to experience postoperative nausea if they answered yes to the following question: Do you feel or have experienced nausea during your stay at the post-anesthesia care unit? And they were considered to experience vomiting is they answered yes to the following question: Have you experienced gagging or have you vomited during your stay at the post-anesthesia care unit? The patients who developed nausea or vomiting were considered positive for PONV. The POVN variable was considered a binary outcome to be used in the logistic regression analysis.
The model comprised fifteen candidate variables: age, body mass index (BMI), fasting time (FT), volume of IV fluids administered (IVFA), surgical time (ST), and the new born weight (NBW), which were treated as continuous variables. Any history of motion sickness (MS), migraine (MH) and nausea and vomiting in a previous surgical procedure (PPONV), the administration of opioids with the delivery analgesia (ODA) via an epidural catheter, the administration of metoclopramide as PONV prophylaxis (MPNV), the intraoperative development of nausea or vomiting (IPNV), performing tubal ligation during the cesarean section (TL) and the gender of the new born (GRN) were treated as dichotomic variables. A history of smoking (HS) was treated as a polytomous variable: absence of smoking, smoking before pregnancy, smoking during pregnancy with discontinuation more than 4 months before surgery, and discontinuation less than 4 months before surgery. 8
All of the variables were selected upon a literature review, and those with a clear association were included, those that have generated conflicting opinions, and those clearly rejected or with limited clinical relevance for PONV. 1,9-12
In order to facilitate the completion of the questionnaire, it was completed in two stages. The first stage was completed in the preparation area to identify any history and preoperative variables; the second stage was completed in the PACU, to identify intraoperative variables and the outcome.
Since this is a prospective study in hospitalized patients, no significant loss of data was expected; however, missing data led to the exclusion of the patient from the study and no data imputation was used. Loss to follow-up of patients was defined as any situation in which the primary outcome could not be assessed, transfer to a different institution, or the need for orotracheal intubation.
The guidelines of the TRIPOD Statement 13 and Peduzzi et al.14 which establish the requirement of at least 10 outcomes per variable studied, were followed. The lowest incidence found in the literature 21 %-23%2,4,15, was used to maximize the number of patients. The sample size estimate was 700 patients.
The Shapiro-Wild test was used for the statistical analysis, in order to check the normal distribution of the continuous variables and hence the results were published accordingly. The categorical variables were presented in accordance with their absolute and relative frequency.
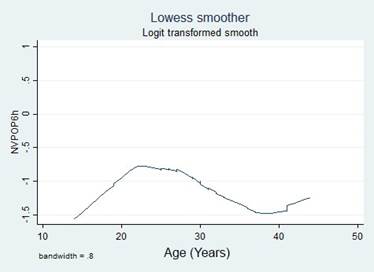
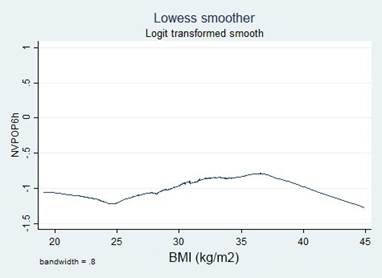
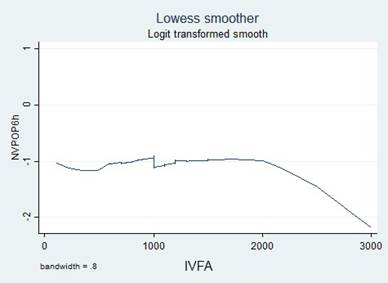
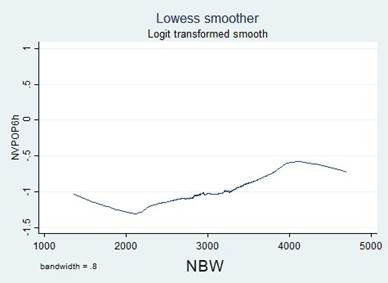
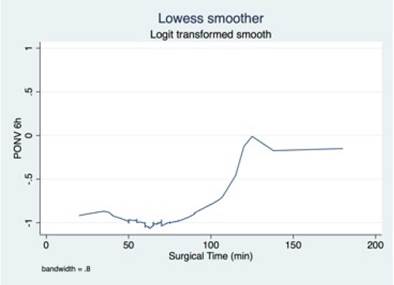
A simple logistic regression model was used to select the candidate variable using a p value of ≤ 0.25 as the inclusion criteria, pursuant to the recommendations in the literature. 16,17 The continuous variables were initially introduced in the natural form and the assumption of monotony was verified using the Locally Weighted Scatterplot Smoothing (LOWESS) tool; when the assumption was unmet, transformations were implemented (quadratic, natural logarithmic, and in base 10) to identify a better lineal relationship with the independent variable, or cut-off points were identified, based on literature data or according to the inflection points in the graphs to categorize the variables.
A variables selection process was conducted, including and excluding each variable one by one, in a forward and backward selection process, according to the level of significance in Wald statistic at a 0.05 level. 18,19
Then, the variables with a significance ≤ 0,25 were added, identifying in each new model the partial likelihood ratio, the calibration and the discrimination, with a view to identifying the contribution of the new variable to the model. Finally, the variables with a significance > 0.25 were explored to assess whether these variables could somehow improve the predictive performance of the models assessed. The calibration of the models was estimated using the goodness-of-fit Hosmer-Lemeshow test 16,20 and the calibration curves. 13 The discrimination was estimated using C statistic, calculated based on the area under the curve (AUC-ROC). 17,20
Collinearity was assessed using the variance inflation factor (VIF) and the Pearson or Spearman correlation coefficients, or the tetrachoric and polychoric correlation, depending on the nature of the variables. A coefficient > 0.8 or a VIF > 10 was assumed as collinearity. 21 The interactions were assessed through the change in the coefficients of the model variables, when including or excluding a new variable, and also with the significance in Wald statistic, when introducing the products among the model predictive variables.
Once the final model was obtained, the internal validation was performed estimating the potential biases of the coefficients using the Bootstrap resampling method. A total of 1,000 random samples with replacement were built with the 703 patients, estimating the probability of the outcome and comparing the calibration curves and the AUC-ROC between the groups.
Using the regression coefficients obtained, the outcome probability was estimated and the patients were divided into risk groups (low, intermediate and high risk), using as cut-off points the 25 and 75 percentiles of the distribution of probability outcome. 22. Then, a prognostic scale was built to facilitate the use and the interpretation of the model developed. Two different models of presentation were developed for this purpose: Score Chart and Nomogram.
For the score chart, the outcome probability was calculated among the independent variables, in all the possible different combinations and a color code was allocated for each risk group. The "nomolog" tool from Stata® software was used to develop the nomogram, which allows for visually allocating a score to each independent variable, and the total sum is correlated with the probability of the outcome.
All of the analyses were conducted using the Stata 15.1 statistical software (Statacorp LLC, 2019) and RStudio 2022.02.0 (RStudio Inc., 2022).
RESULTS
719 patients were assessed during the data collection period, of which 16 (2.22%) were ruled out due to missing data that could not be collected because of difficulty to contact the patients or during the medical records review. The final sample included 703 patients from the two participating institutions: 352 patients from Institution 1 and 351 patients from Institution 2.
The outcome occurred in 190 patients (27.03%), corresponding to 91 cases (25.85%) in Institution 1 and 99 cases (28.21 %) in Institution 2.
A univariate analysis was conducted with the 15 study variables, of which five reached statistical significance < 0.25, which led to consider these variables as candidates for the construction of the model: Age, PPONV, BMI, IONV and NBW (Table 1).
Table 1 Distribution of the predictive variables according to the outcome.
| Preoperative | PONV (+) 190 (%) | PONV (-) 513 (%) | P | OR | 95 % CI |
|---|---|---|---|---|---|
| Institution 1 n (%) 2 n (%) |
91 (47.89) 99 (52.11) |
261 (50.88) 252 (49.12) |
0.483 |
1.126 |
0.807 to 1.572 |
| Age (years) Range Median (Q1 to Q3) |
14 to 44 27 (24 to 31) |
15 to 43 29 (24 to 33) |
0.016 |
0.966 |
0.939 to 0.993 |
| History of PONV n (%) | 39 (20.53) | 58 (11.31) | 0.002 | 2.026 | 1.298 to 3.164 |
| History of motion sickness n(%) | 20 (10.53) | 55 (10.72) | 0.941 | 0.980 | 0.570 to 1.683 |
| History of migraine n (%) | 46 (24.21) | 112 (21.83) | 0.502 | 1.144 | 0.772 to 1.694 |
| Smoking
|
182 (95.79) 7 (3.68) 1 (0.53) 0 (0.00) |
482 (93.96) 16 (3.12) 9 (1.75) 6 (1.17) |
- 0.750 0.247 - |
1 1.159 0.294 1 |
- 0.469 to 2.862 0.037 to 2.339 |
| BMI (kg/m2) Range Median (Q1 a Q3) |
20.27 to 44.00 29.39 (27.29 to 33.29) |
19.13 to 44.92 29.21 (26.22 to 32.11) |
0.146 |
1.028 |
0.990 to 1.067 |
| Fasting (hours) Range Median (Q1 a Q3) |
0 to 31 11 (8 to 15) |
0 to 60 11 (8 to 14) |
0.596 |
0.993 |
0.967 to 1.019 |
| Use of opioids n (%) | 14 (7.37) | 38 (7.41) | 0.986 | 0.994 | 0.526 to 1.880 |
| Use of metoclopramide n (%) | 145 (76.32) | 407 (79.34) | 0.387 | 0.839 | 0.564 to 1.248 |
| Intraoperative | |||||
| IONV n (%) | 65 (34.21) | 75 (14.62) | 0.000 | 3.037 | 2.062 to 4.472 |
| IVFA (liters) Range Median (Q1 to Q3) |
0.2 to 2.2 1.0 (1.0 to 1.2) |
0.11 to 3.0 1.0 (1.0 to 1.2) ) |
0.797 |
0.999 |
0.999 to 1.000 |
| Tubal ligation n (%) | 57 (30.00) | 140 (27.29) | 0.478 | 1.142 | 0.792 to 1.647 |
| Surgical time (minutes) Range Median (Q1 to Q3) |
25 to 138 60 (50 to 65) |
20 to 180 60 (50 to 65) |
0.980 |
0.999 |
0.989 to 1.010 |
| New born gender Female n (%) Male n (%) |
85 (44.74) 105 (55.26) |
245 (47.76) 268 (52.24) |
0.476 |
1.129 |
0.808 to 1.578 |
| New born weight (g) Range Median (Q1 to Q3) |
1.360 to 4.240 3.130 (2.740 to 3.490) |
1.635 to 4.700 3.070 (2.720 to 3.440) |
0.193 |
1.000 |
0.999 to 1.000 |
BMI: Body mass index; CI: Confidence interval; IONV: Intraoperative nausea and vomiting; IVFA: Intravenous fluids administered; PONV: postoperative nausea and vomiting.
Source: Authors.
A history of smoking (HS) did not reach statistical significance because of its low frequency; around 95% of the patients reported they were non-smokers. For this reason, the variable was recoded into two options and in two potential scenarios: has never smoked or has eventually smoked; has not smoked recently or has smoked recently (Table 2).
Table 2 Categorization of the continuous and polytomous variables.
| PONV (+) 190 (%) | PONV (-) 513 (%) | P | OR | 95 % CI | LOWESS charts | ||
|---|---|---|---|---|---|---|---|
| Age | ≤ 25 years > 25 years |
75 (39.47) 115 (60.53) |
158 (30.80) 355 (69.20) |
0.03 | 1.465 | 1.037 to 2.071 |
|
| ≤ 28 years > 28 years |
113 (59.47) 77 (40.53) |
248 (48.34) 265 (51.66) |
0.09 | 1.568 | 1.119 to 2.198 | ||
| ≤ 30 years > 30 years |
135 (71.05) 55 (28.95) |
324 (63.16) 189 (36.84) |
0.051 | 1.432 | 0.998 to 2.055 | ||
| ≤ 24 years 25 to 35 years ≥ 36 years |
65 (34.21) 105 (55.26) 20 (10.53) |
132 (25.73) 299 (58.28) 82 (15.98) |
- 0.074 0.016 |
1 0.713 0.495 |
- 0.492 to 1.033 0.280 to 0.878 |
||
| BMI (kg/m2) | ≤ 24.99 25.00 a 34.99 ≥ 35.00 |
24 (12.63) 138 (72.63) 28 (14.74) |
74 (14.42) 378 (73.68) 61 (11.89) |
- 0.643 0.289 |
1 1.126 1.415 |
- 0.683 to 1.856 0.744 to 2.689 |
|
| ≤ 24.99 25.00 a 29.99 30.00 a 34.99 ≥ 35.00 |
24 (12.63) 77 (40.53) 61 (32.11) 28 (14.74) |
74 (14.42) 209 (40.74) 169 (32.94) 61 (11.89) |
- 0.637 0.701 0.289 |
1 1.136 1.113 1.415 |
- 0.669 to 1.929 0.645 to 1.920 0.745 to 2.689 |
||
| IVFA | < 0.5 L ≥ 0.5 L |
3 (1.58) 187 (98.42) |
11 (2.14) 502 (97.86) |
0.635 | 0.732 | 0.202 to 2.653 |
|
| < 1 L ≥ 1 L |
44 (23.16) 146 (76.84) |
115 (22.42) 398 (77.58) |
0.835 | 1.043 | 0.702 to 1.549 | ||
| < 2 L ≥ 2 L |
178 (93.68) 12 (6.32) |
479 (93.37) 34 (6.63) |
0.882 | 1.053 | 0.533 to 2.079 | ||
| NBW | < 2.500 g 2.500 to 3.500g >3.500 g |
20 (10.53) 124 (65.26) 46 (24.21) |
75 (14.62) 337 (65.69) 101 (19.69) |
- 0.238 0.082 |
1 1.380 1.708 |
- 0.809 to 2.355 0.934 to 3.125 |
|
| < 2.000 g 2.000 to 4.000g > 4.000 g |
6 (3.16) 178 (93.68) 6 (3.16) |
18 (3.51) 481 (93.76) 14 (2.73) |
- 0.827 0.711 |
1 1.110 1.286 |
- 0.434 to 2.841 0.340 to 4.860 |
||
| Surgical time | ≤ 60 min > 60 min |
132 (69.47) 58 (30.53) |
355 (69.20) 158 (30.80) |
0.944 | 0.987 | 0.688 to 1.417 |
|
| ≤ 100 min > 100 min |
187 (98.42) 3 (1.58) |
506 (98.64) 7 (1.36) |
0.831 | 1.160 | 0.297 to 4.531 | ||
| ≤ 60 min 61 to 99 min ≥ 100 min |
132 (69.47) 54 (28.42) 4 (2.11) |
355 (69.20) 150 (29.24) 8 (1.56) |
- 0.864 0.633 |
- 0.968 1.345 |
- 0.669 to 1.401 0.398 to 4.540 |
||
| Smoking | Yes No |
8 (4.21) 182 (95.79) |
31 (6.04) 482 (93.96) |
0.349 | 1.463 | 0.660 to 3.242 | |
| Recently Not recently |
1 (0.53) 189(99.47) |
15 (2.92) 498 (97.08) |
0.290 | 5.692 | 0.747 to 43.395 |
BMI: Body mass index; CI: Confidence interval; IONV: Intraoperative nausea and vomiting; IVFA: Intravenous fluids administered; PONV: Postoperative nausea and vomiting; NBW: New born weight.
Source: Authors.
Transformations and categorizations were performed with the continuous variables, in accordance with the inflection points in the LOWESS charts. Only the Age variable maintained its statistical significance in its continuous form and upon categorization (Table 2). No transformation improved the monotony.
The collinearity among the variables was assessed via the development of a correlation matrix, including both the continuous and re-categorized forms. According to the evaluation, none of the coefficients was > 0.8 and there was no evidence of interactions among the variables.
Initially three models were built with the variables with a significance <0.05 (IONV, Age of continuous form in 2 and 3 categories and PPONV) and in these models, the variables with significances < 0.25 were added and removed (NBW in 3 categories and BMI continuously and in 3 categories).
Multiple models were built, adding or removing the variablea one by one, evaluating Wald statistic, the likelihood ratio and the contribution to the calibration and discrimination model (Figure 1). Model two was chosen which corresponds to IONV, Age in 2 categories, and PPONV, on account of its greater discrimination, and subgroup F, which corresponds to the inclusion of the BMI variables in 3 categories, since they improved the model's calibration and discrimination, AUC-ROC 0.68 (95% CI: 0.64 to 0.73) (Figure 2).
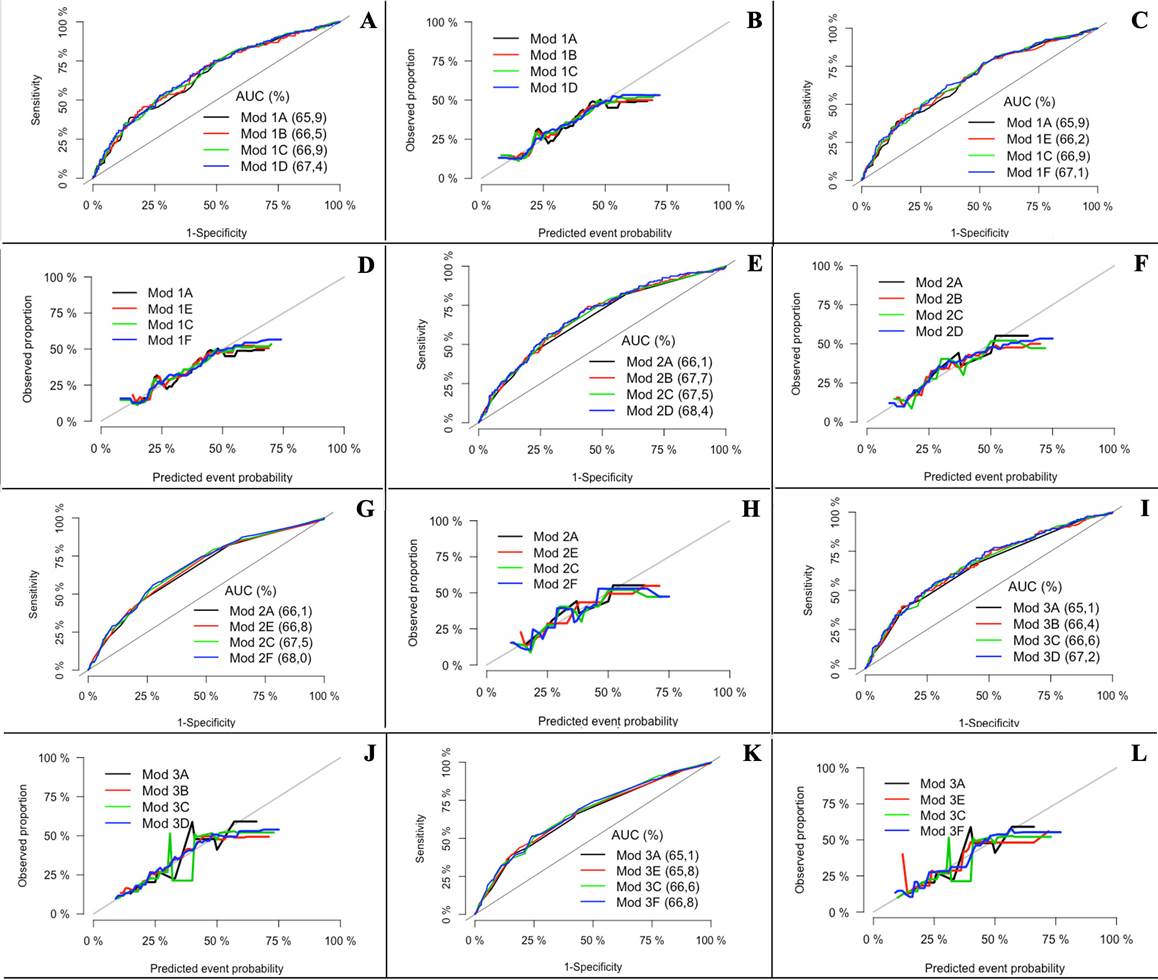
A, C, E, G, I and K: Discrimination curves, B, D, F, H, J and L: Calibration curves. Model 1A: IONV + Age (years) + PPONV. Model 1B: IONV + Age (years) +PPONV + BMI (kg/m2). Model 1C: IONV + Age (years) + PPONV + NBW3Cat. Model 1D: IONV + Age (years) + PPONV + BMI (kg/m2) + NB3Cat. Model 1E: IONV + Age (years) + PPONV + BMI3Cat. Model 1F: IONV + Age (years) + PPONV + BMI3Cat + NBWCat. Model 2A: IONV + Age2Cat + PPONV. Model 2B: IONV + Age2Cat + PPONV + BMI (kg/m2). Model 2C: IONV + Age2Cat + PPONV + NBW3Cat. Model 2D: IONV + Age2Cat + PPONV + BMI (kg/m2) + NBW3Cat. Model 2E: IONV + Age2Cat + PPONV + BMI3Cat. Model 2F: IONV + Age2Cat + PPONV + BMI3Cat + NBW3Cat. Model 3A: IONV + Age3Cat + PPONV. Model 3B: IONV + Age3Cat + PPONV + BMI (kg/m2). Model 3C: IONV + Age3Cat + ANVPO + PR-N3Cat. Model 3D: NVIO + Edad3Cat + ANVPO + IMC (kg/m2) + PRN3Cat. Modelo 3E: NVIO + Edad3Cat + PPONV + BMI3Cat. Model 3F: IONV + Age3Cat + PPONV + BMI3Cat + NBW3Cat. AUC: Area under the curve; BMI: Body mass index; Cat: Categories; IONV: Intraoperative nausea and vomiting; Mod: Model; NBW: Newborn weight; PPOVN: Previous postoperative nausea and vomiting. Source: Authors.
Figure 1 Calibration and discrimination curves of the models explored.
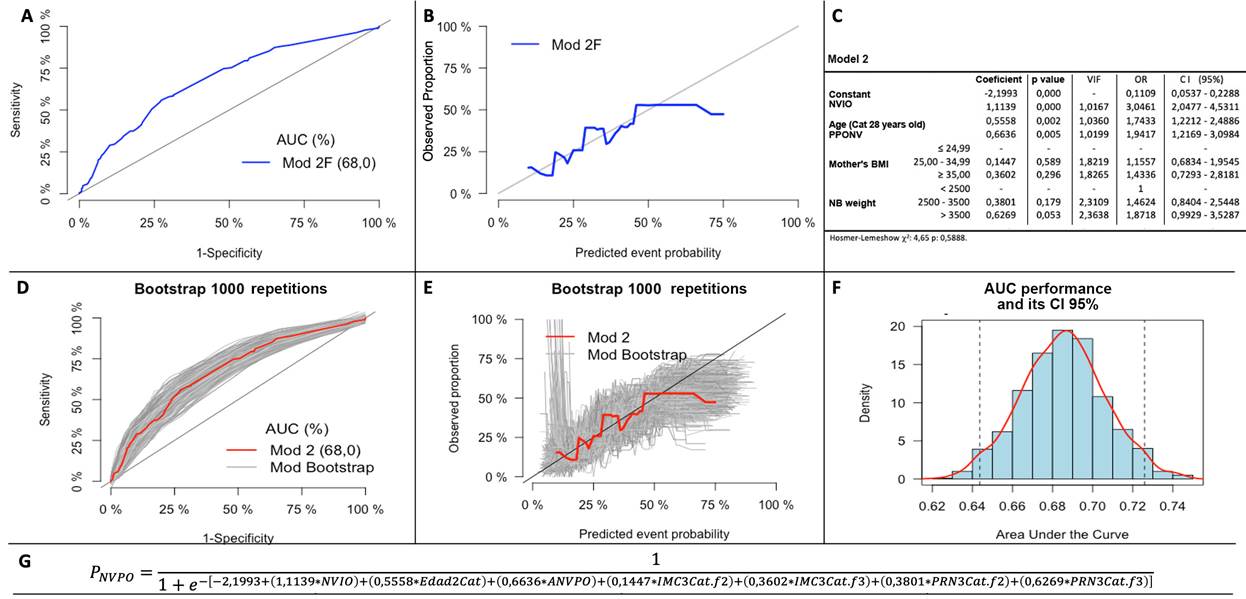
A and B: Discrimination and calibration curves of the selected model 2F, C: Logistic regression analysis of the selected model 2F, D and E: Discrimination and calibration curves of the Bootstrap samples, F: Distribution of the AUC ROC of the Bootstrap samples, G: Regression formula of the selected model 2F. Model 2F: IONV + Age2Cat + PPOVN + BMI3Cat + NBW3Cat. AUC: Area under the curve; BMI: Body mass index; Cat: Categories; CI: Confidence interval; IONV: Intraoperative nausea and vomiting; Mod: Model; NBW: Newborn weight; PPONV: Previous postoperative nausea and vomiting; VIF: Variance inflation factor. Source: Authors.
Figure 2 Final model selected.
The administration of metoclopramide as a predictive variable was investigated (OR: 0.8729 95% CI: 0.5744 to 1.3265) in accordance with the recommendations of the TRIPOD statement for variables with a potential significant impact on the result. 13 Similarly, the "Institution" variable was included to explore the impact of institutional care on the result (OR: 1.2938 95% CI: 0.9101 to 1.8393). None of the previous variables improved the calibration, the discrimination, or the prediction of the outcome in the final model.
In terms of the other variables which were not admitted into the model, they were investigated by including them one by one into the final model, both in their natural and recategorized forms, in order to assess calibration and discrimination improvements, but no major contribution was identified from any of these variables.
The internal validation was performed to assess any potential optimistic approach in the predictive model. The Bootstrap resampling model was used and a similar distribution was observed in the calibration and discrimination curves of the new resampled models as compared to the original model proposed. The AUC curves of the Bootstrap models were drawn, the 95% confidence interval was estimated, and compared against the proposed original model (0.6437 to 0.7259) (Figure 2).
The outcome probability for each patient was estimated with the adjusted coefficients of model 2 (Figure 2), and the 25 and 75 percentiles of the probabilities were used (16.20% and 33.02%) to classify patients into risk groups (low, intermediate, and high risk). Different percentages of the event were observed based on the risk groups (12.15%, 26.74% and 42,70%, respectively) and different distributions of the predictive variables among the groups were identified (Table 3).
Table 3 Distribution of the predictive variables in accordance with the outcome.
| Low risk | Intermediate risk | High risk | ||||
|---|---|---|---|---|---|---|
| PONV (+) | PONV (-) | PONV (+) | PONV (-) | PONV (+) | PONV (-) | |
| 22 cases | 159 cases | 92 cases | 252 cases | 76 cases | 102 cases | |
| IONV n ( %) | 0 (0.0) | 0 (0.0) | 3 (3.26) | 3 (1.19) | 62 (81.58) | 72 (70.59) |
| Age (years) Range Median (Q1 to Q3) |
24 to 41 33 (31 to 36)1 |
18 to 43 33 (30 to 36) |
18 to 41 26 (24 to 29) |
16 to 42 26 (22 to 30) |
14 to 44 27 (22 to 31) |
15 to 43 27 (23 to 30) |
| Previous PONV n ( %) | 0 (0.0) | 0 (0.0) | 12 (13.04) | 22 (8.73) | 27 (35.53) | 36 (35.29) |
| BMI (kg/m2) Range Median (Q1 to Q3) |
20.45 to 33.78 29.45 (24.97 to 31.43) |
19.61 to 35.38 28.60 (26.22 to 31.14) |
22.32 to 43.00 29.46 (27.51 to 33.40) |
19.13 to 43.96 29.55 (26.59 to 32.82) |
20.27 to 44.00 29.33 (27.02 to 33.61) |
19.47 to 44.92 29.41 (25.81 to 33.25) |
| NBW (grams) Range Median (Q1 to Q3) |
1.600 to 3.440 2.935 (2.525 to 3.190) |
1.700 to 3.500 2.930 (2.600 to 3.180) |
1.360 to 4.210 3.115 (2.665 to 3.555) |
1.635 to 4.185 3.150 (2.820 to 3.550) |
1.740 to 4.240 3.215 (2.955 to 3.525) |
2.100 to 4.700 3.130 (2.770 to 3.550) |
BMI: Body mass index; IONV: Intraoperative nausea and vomiting; NBW: Newborn weight; PONV: Postoperative nausea and vomiting.
Source: Authors.
A case example is included to illustrate the use of the tables. A 26-year old female with 37 weeks of gestation, BMI 24.44 kg/ m2, with PPONV, who developed IONV and with a NB weight of 2,870 g. She will have a 68.58% probability of developing PONV according to the score chart and based on the Nomogram, the score is 24.5 which corresponds to a probability of PONV of approximately 63%.
DISCUSSION
A prospective study was conducted to develop and validate a prognostic predictive model for PONV in cesarean section under spinal anesthesia. The following predictors for the development of intraoperative nausea and vomiting were included in the model: age <28 years, a history of nausea and vomiting in a previous surgical procedure, the mother's body mass index, and the newborn weight. The model showed an adequate calibration, but low discrimination.24
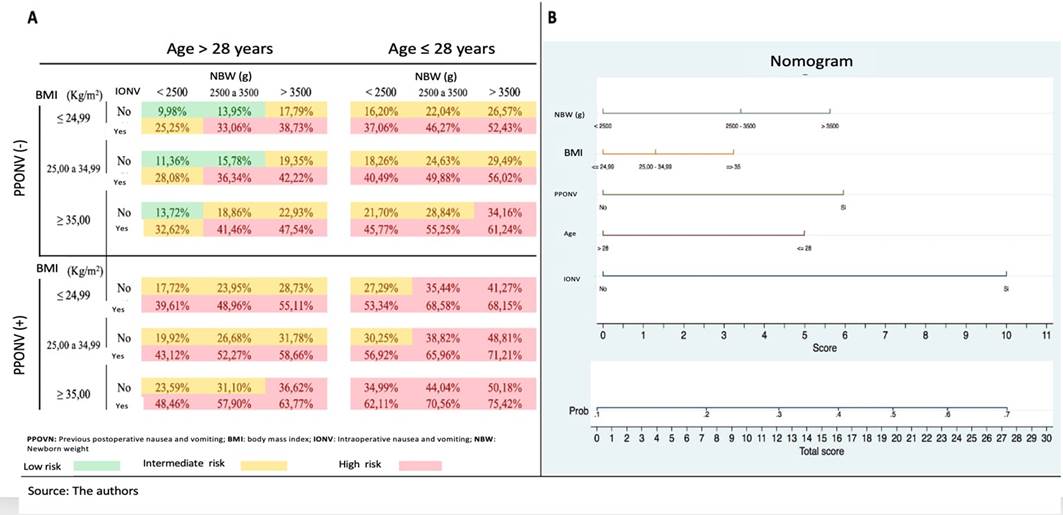
A: Score chart for PONV, B: Nomogram for PONV. Source: Authors.
Figure 3 Presentation formats of the predictive model developed.
The incidence of PONV was 27%; previous studies have indicated an incidence rate between 30% and 50% for general anesthesia (GA), with lower numbers for regional anesthesia (7 % to 18 %) 1,5,11,25-27. However, as a result of pregnancy-inherent conditions and due to the routine use of spinal morphine, the incidence of PONV in cesarean section has been reported to be higher, although a percentage number that may be generalized is not available. 2,3,28 The reports mention between 23% and 79% depending on the different analgesia regimens used and the PONV prophylaxis. 2
The timing and the number of outcome measurements differ among the various studies, with an observation period usually not exceeding 24 hours. 2,10,27 In this study, the outcome was measured 6 hours after surgery to develop a predictive model during the time the patients were in the PACU.
Three important predictors were identified: IONV, age < 28 years and PPONV. Two additional variables were included in the model: BMI and NBW since both slightly improved the discrimination and significantly improved the calibration. The rest of the variables failed to show a role as independent predictors of PONV in cesarean section delivery under spinal anesthesia, notwithstanding the fact that a strong association was identified with the outcome - PONV - in other populations. 1,10
Two different prognostic scale formats were constructed intended to allow the reader to select the one that is easier to use and facilitates its interpretation, based on the user needs and preferences.
Few variables have been studied as risk factors for PONV in cesarean delivery. Chao et al. 29 found that the use of antiemetic medications during and after surgery and their use in multimodal therapy versus monotherapy, was associated with a lower incidence and severity of PONV (p: <0.001 and p: 0.018, respectively); moreover, Balla et al. 30 identified three risk factors for PONV in an obstetric unit: nonsmoker, oxytocin infusion in the operating room, and spinal morphine. The effect of oxytocin was not measured in this study, and all patients received spinal morphine. However, being a non-smoker and the use of metoclopramide were not risk factors or predictors in the study population.
In the pediatric and non-obstetric population under GA, age and PPONV have shown to be predictors and risk factors for PONV. 1,10 Although their behavior in the obstetric population was unknown, this study showed that both age and PPONV are clear predictive and risk factors for PONV. Furthermore, to the extent of our knowledge, this is the first study exploring IONV, BMI and NBW as new risk factors in the obstetric population. 3,29,30
Smoking is an important protective factor against PONV (1,10), but is has not been thoroughly studied in the obstetric population and its association has not been clearly established. 30 In this study, 5.55% of the patients said they had occasionally smoked and only 2.27% said they had smoked during pregnancy. We believe that there is under-reporting because of the social stigmatization of smoking during pregnancy and this may have impacted the final prognostic model by excluding an important predictor.
It has been shown that motion sickness (MS), surgical time (ST) and intravenous fluid administration (IVFA) have shown to affect the development of PONV in the non-obstetric population under GA. 1,10. However, none of them showed to be a predictor or a risk factor of PONV in cesarean delivery in this study.
In general, the antiemetic efficacy of metoclopramide is uncertain, but it may be effective in the prevention of PONV under GA, particularly at high doses. 1,27 However, Domínguez et al. 31 found that it does not seem to be effective in the prophylaxis of PONV in pregnant patients receiving spinal morphine, which is consistent with the results of this study.
A history of migraine, fasting time and the preoperative or intraoperative administration of opioids, have not shown to be risk factors for PONV in the non-obstetric population under GA. 1,10,11 Similar results were achieved in cesarean delivery.
No overadjustment was seen in the internal validation, evidenced in the similarities of the calibration charts, discrimination and confidence intervals of the Bootstrap models with the model developed, probably due to the large number of patients included for the development of the model; furthermore, the authors of the study believe that the low discrimination obtained is due to smoking under-reporting or to the absence of other variables that were neglected, such as the indication for the cesarean section, the number of pregnancies, the use of oxytocin and other sociodemographic characteristics.
Four important limitations are identified in the study: concomitant tubal ligation with the cesarean section was only performed routinely in one of the institutions participating in the study. Considering that it is a risk factor and an important predictor for PONV due to its well-known visceral stimulating effect, an adequate assessment of this variable was not feasible since only half of the population could have been available for the analysis.
The use of populations from tertiary obstetric centers could hinder the extrapolation to primary care patients.
The low score of discrimination of the final model. Calibration and discrimination are statistical characteristics of the performance of a predictive model, but neither captures the clinical consequences at a particular level 13, and hence the authors believe that it has no significant impact on the value of the model developed. Nevertheless, these data are important since they will allow for a future comparison against new complementary or alternate models.
The inclusion of only patients receiving spinal morphine and dexamethasone for PONV prophylaxis is initially a disadvantage since not every anesthesiologist uses the same medications herein described. However, since this regimen is consistent with the international guidelines and recommendations, in the future this may become a strength allowing for further extrapolation of the data.
Significant strengths of the study may also be highlighted, such as its prospective nature and the possibility to develop a model with a sufficient sample size, resulting in 12.66 outcomes per variable studied.
The prognostic scale developed may be valuable in clinical practice since it does not require laboratory tests, questions are easy to answer, and is easy to administer since no time consuming calculations are required.
The recommendations for the management of PONV in the non-obstetric population are aimed at the identification and classification of intermediate to high-risk patients for the implementation of targeted therapies leading to improved satisfaction, less complications and lower costs. 1
This study is the first step towards introducing these recommendations in cesarean section; therefore, further research is needed to confirm the role of the factors herein identified, to provide external validation of the model developed and, if appropriate, to introduce changes and make an assessment that generates a predictive model for early identification of patients who may benefit from managing and reducing the incidence of PONV in cesarean section.
ETHICAL RESPONSIBILITIES
Endorsement of the ethics committee
This study was approved by the Bioethics Committee of the Institute of Medical Research of the School of Medicine, Universidad de Antioquia, Medellín, Colombia; proceedings N.° 019 of December 1st, 2016.
Protection of humans and animals
The authors declare that no experiments were conducted in humans or in animals for this research study. The authors declare that the procedures followed were consistent with the ethical standards of the responsible human experimentation committee and in accordance with the World Medical Association and the Declaration of Helsinki.
Confidentiality of the data
The authors declare that they have followed the protocols of their work center on the publication of patient data.
Right to privacy and informed consent
The authors declare that this article does not disclose any patient data. The authors have obtained the informed consent of the patients and / or subjects mentioned in the article. This document is in the possession of the corresponding author.
Contribution by the authors
MDLP and OLG: Participated in the design, analysis and interpretation of the study and in the drafting and revision of the manuscript.
DCA: Participated in the analysis and interpretation, as well as in the revision of the manuscript.
ADLP: Participated in the design and implementation of the project, as well as in the drafting and revision of the manuscript.
JJA and RM: Participated in the implementation of the project, as well as in the revision of the manuscript.

