texto en
  Inglés (pdf)
 Articulo en XML
 Referencias del artículo
 Enviar articulo por email
 Citado por SciELO
  Citado por Google
  Similares en
SciELO
Similares en
SciELO  Similares en Google
 Permalink
INTRODUCTION
Clinical epidemiology aims to gain insights into the distribution of health outcomes and identify associated factors in a given population 1 Although epidemiological measures are widely known, it has been found that healthcare professionals misuse them, use inadequate terms or misinterpret them out of lack of knowledge 2-5.
This article explains the main measures applied in epidemiology, organized in terms of frequency, association and impact, by epidemiological design, from the perspective of a positivist paradigm. The aim is to improve their understanding, linking the originating mathematical expressions with their interpretation. The types of epidemiological studies will be first explained, followed by the measures used for each design which will be presented with step-by-step examples of how the equation is developed, providing the reader with the tools for adequate interpretation. Instead of mechanical formulas becoming a mechanical action, the idea is that their application should be guided by an understanding of the subject and of what they represent. This article is designed to be a teaching tool for professionals and students of different academic ranks that will help them apply their knowledge of epidemiology and biostatistics when reading a scientific paper or planning a research study.
EPIDEMIOLOGICAL STUDIES
Study designs depend on factors such as objectives, limitations, and available resources. In the quantitative realm, there are two large groups of primary studies: experimental and non-experimental or observational, each with their own subtypes 6.
Experimental studies include laboratory studies, community interventions and randomized clinical trials (RCT). RCTs are conducted under controlled conditions in which subjects are randomly assigned to the study intervention, or to a control group in which they receive either the standard of care or placebo. The purpose of randomization is to ensure that the groups are very similar at the baseline so that their characteristics will not become confounding factors when the outcomes for both groups are compared. Subjects are followed for a period of time, after which their response to management is assessed and outcomes are compared; differences between the groups suggest either a beneficial or adverse effect from the new treatment. To prevent outcomes from being influenced by information on what subjects are receiving, studies should ideally be masked so that neither the investigator nor the participants know what the subjects were assigned to. In RCTs, generalization of some of the findings could be affected by participant selection; if the characteristics of the subjects are not similar to those of the target population and their condition is modified by the efficacy of the treatment, the study conclusions will only apply to the observed population 6,7. On the other hand, there are studies similar to the experimental studies, called quasi-experimental, the main difference being that they do not use randomization to assign the participants to a specific study factor. Policy studies and natural experiments, among others, are part of this group 6.
In turn, non-experimental or observational studies can be descriptive or analytical. Descriptive studies are selected when there is little information about the occurrence of the health outcome or the natural history of the disease, and they are designed to estimate the extent of occurrence and generate etiologic hypotheses. Analytical studies are performed when there is enough knowledge about the disease and the aim is to test specific etiologic hypotheses, identifying risk factors or estimating the effects of exposure in order to suggest potential interventions. In these studies, given that participants are not randomly selected, there is a higher risk of initial imbalance in terms of the characteristics of the exposed and non-exposed subjects. This may result in potential differences attributable to baseline characteristics but not to the exposure 6,7. These designs require the use of different strategies to minimize this potential error; however, it is important to bear in mind that this does not apply in all scenarios, although it is specifically true when assessing interventions, particularly pharmacological interventions.
The main subtypes are cohort, case-control (analytical) and cross-sectional (descriptive) studies. Regarding cohort studies, the investigator selects a group of people in which the outcome has not occurred and then assigns them either to an exposure group or index cohort and or a non-exposed group or reference cohort. The investigator identifies the outcomes that occur during a follow-up period in each cohort and makes a comparison to assess the exposure effect. These are forward-direction studies, which means that they starts from the presence or absence of the exposure until the outcome occurs. In case-control studies, cases are defined based on the presence of the disease or outcome, and controls are defined on the basis of its absence. Exposure distribution is observed in both groups in order to determine a difference that can point to a relationship. These are a backward-direction studies where the researcher begins by determining whether the exposure is present or absent. Finally, cross-sectional studies consider the entire target population or a representative sample thereof at a specific point in time, and it is selected regardless of whether the subjects have been exposed or nor, or whether a disease is present or not. They are designed to assess the state of exposure or disease within a specific period of time, and compare the occurrence of the event of interest between groups of different exposures in order to determine potential associations or generate hypotheses. Unlike the previous studies, these have no directionality 1,6,7.
MEASURES IN EPIDEMIOLOGY
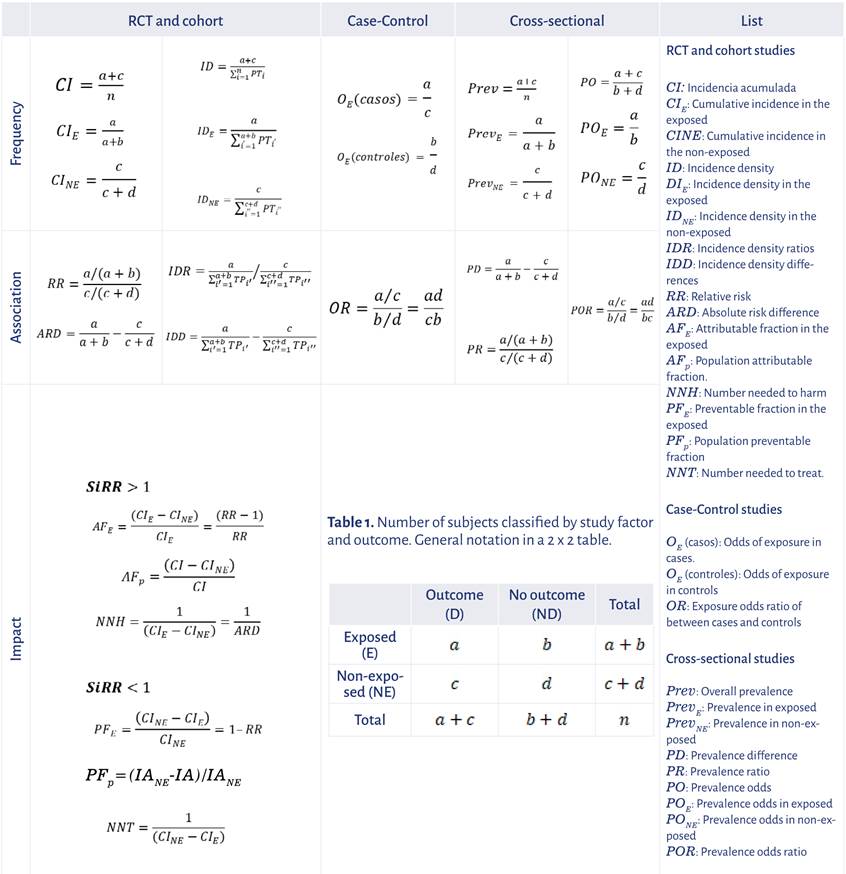
There are three types of measures that serve different purposes. First, frequency measures assess the magnitude of occurrence of an outcome or study factor; association measures, on the other hand, assess potential changes in outcome occurrence among the varying degrees of exposure to the study factor. Finally, impact measures which indicate to what extent the occurrence of the event is attributable to the study factor. In epidemiological designs, when the outcome of interest and the study factor are dichotomous, they can be summarized in a 2 x 2 table which includes, in each cell, the number of subjects classified by exposure and outcome occurrence (Table 1). Therefore,
Table 1 Number of subjects classified by study factor and outcome. General notation in a 2 x 2 table.
| Outcome (D) | No outcome (ND) | Total | |
|---|---|---|---|
| Exposed (E) |
|
|
|
| Non-exposed (NE) |
|
|
|
| Total |
|
|
|
Source: Authors.
The frequency, association and impact measures are described below by type of epidemiological study, including their calculation based on Table 1 and their interpretation based on real studies. The focus of this article is to describe point estimates of each measure and their interpretation; however, it is important to remember that these must be accompanied by their respective confidence intervals which consider the random error associated with the selection of the sample participating in the study.
MEASURES BY EPIDEMIOLOGICAL DESIGN
RCTs and cohort studies
The measures described below are obtained in cohort studies and RCTs. In terms of frequency measures, incidence is expressed as a risk or probability measure (cumulative incidence - CI), or as rate or instant change measure (incidence density - ID). The former refers to the number of people who show the outcome of interest during a specific time period or a specific geographical area determined in a population that is initially free of the event and has a risk of presenting it. It is estimated as CI=(a+c)/n and indicates the odds of the outcome occurring during the observation time defined in the study. Cumulative incidence can be obtained in both exposed and non-exposed subjects by replacing CI
E
=a/(a+b) and CI_NE=c/(c+d), respectively. Incidence density measures the occurrence of an event in a specified population in relation to time-person units (TP) at risk of the risk presenting itself; it is an expression of the "speed" of occurrence of the disease. It is obtained by dividing the number of outcomes in the numerator by the sum of the time during which the subjects were under observation, free of the disease, i.e.,
Cumulative incidence
One RCT assessed the effect of ivermectin in adult patients with mild COVID-19 vs. placebo in the presence of symptoms on day 21 8 (Table 2).
Table 2 Presence of COVID-19 symptoms after 21 days of ivermectin vs. placebo.
| With symptoms (D) | Without symptoms (ND) | Total | |
|---|---|---|---|
| Ivermectin (E) | 36 | 164 | 200 |
| Placebo (NE) | 44 | 156 | 200 |
| Total | 80 | 320 | 400 |
Source: Authors from 8.
CI=80/400=0.2 which means that the risk of having symptoms on day 21 is 0.2, or that 20% have symptoms on follow-up day 21.
Incidence density
A study conducted in Lombardy collected cases of upper respiratory infection (URI) in children under 6 years of age to assess the incidence of this condition 9; 111 children between 1 and 2 years of age and 49 children between 5 and 6 were followed during a four-month period before the pandemic (November 2019 to February 2020), recording the number of URI cases and the follow-up time contributed by each subject (Table 3).
Table 3 URI incidence in children before the COVID-19 pandemic in Lombardy, Italy.
| URI cases (D) | Exposure Time (ET) | |
|---|---|---|
| 1 to 2 years (E) | 183 | 111 x 4 months |
| 5 to 6 years (NE) | 53 | 49 x 4 months |
| Total | 236 | 160 x 4 months |
Source: Authors from 9.
Association measures are obtained from a comparison of frequency measures between exposed and non-exposed subjects, by means of quotient or subtraction. Based on cumulative incidences, relative risk (RR) is expressed as follows: RR = [a/(a+b)]/[c/(c+d)] and indicates that the risk of the outcome being present in the exposed group is that number of times (higher or lower) than the risk of the non-exposed group. The absolute risk difference (ARD) is expressed as follows: ARD=[a/(a+b)]-[c/(c+d)] and indicates risk increase or decrease in absolute terms in the exposed group, as compared to the non-exposed. If RR>1 or ARD>0, the risk of presenting the outcome is greater in the exposed vs. the non-exposed group, and if RR<1 or ARD<0, the risk of the outcome being present is greater in the non-exposed vs. the exposed group. Similarly, based on incidence densities in the exposed and non-exposed groups, there is an incidence density ratio (IDR) or incidence density difference (IDD) whose interpretations are equivalent to those mentioned previously, but this time in reference to the rate or instantaneous risk of presenting the outcome 1.
In the ivermectin study for COVID-19, the relative risk is equal to RR = 0.18/0.22=0.82, i.e., the risk of those who received ivermectin having symptoms on day 21 is a fraction of 0.82 times the risk of symptoms being present in the placebo group. The ARD=0.180.22=-0.04, i.e., a negative 4% difference that indicates that this is the magnitude by which the risk of symptoms being present in the placebo group is higher.
When the outcome of interest is an unfavorable event such as death or adverse events, impact measures indicate how much of the event is "attributable" or "preventable" by the exposure. If RR>1, the attributable fraction in the exposed group (AF e ) is AF e =(CI e -CI ne )/ CI E =(RR-1)/RR and represents the proportion of unfavorable outcomes in the exposed group that are attributable to this exposure. The attributable fraction for the population (AF p ),which is AF p =(CI-CI NE )/CI, is also obtained and represents the percentage of unfavorable outcomes attributable to exposure in the population. Finally, the number needed to harm (NNH) which is NNH=(1/(CI E -CI NE )=1/ARD is also obtained and represents the number of subjects to expose in order to cause an additional outcome vs. the non-exposed. If RR<1, the impact measure is called preventable fraction in the exposed (PF E ), which is PF E =(CI NE -CI E )/CI NE =1-RR and expresses the percentage of potential unfavorable outcomes prevented in the exposed group as a result of the exposure. The preventable fraction for the population (PF p ), which is PF p =(IA NE -IA)/IA NE expresses the proportion of potential unfavorable outcomes prevented in the population as a result of the exposure. Finally, the number needed to treat (NNT), which is NNT=1/(CI NE -CI E ), represents the number of subjects that need to be exposed in order to avoid one outcome as compared to the non-exposed 1,6.
Therefore, in the ivermectin study
RR<1,
then
PF
P
=(0.22-0.2)/0.22= 0.09, which means that 19% of potential patients with symptoms on day 21 were prevented in the exposed group due to the medication.
Case-control studies
In this type of study, the number of cases and controls is determined by the researchers and, for that reason, no frequency measures for the outcome can be obtained. Case-control studies allow to determine exposure frequency in the cases and compare it with exposure frequency in the controls. Based on this comparison, the association measure is the odds ratio or OR 1.
The exposure odds for cases and controls are required in order to obtain the OR. In general, the odds represent the ratio between the probability of an event happening, divided by the probability that it will not occur. The odds of exposure in the cases are O E (casos) = (a/ (a+c))/[1-(a/(a+c))]=a/c and the odds of exposure in the control are O E (controles)=(b/(b+d))/[1-(b/(b+d))]=b/d. The ratio between these two odds is the OR, i.e., OR=(a/c)/ (b/d) = (axd)/(cxb) 6,7,10.
The OR takes values between zero and infinite and is interpreted as the number of times that the odds of being exposed occur in cases in relation to the odds of controls being exposed. OR<1 indicates that exposure is associated with a reduction of the risk of occurrence of the event of interest, OR=1 indicates that there is no association between exposure and the risk of presenting the event, and OR>1 means that exposure increases the risk of the event occurring 1.
The effectiveness of vaccination for the SARS-CoV-2 delta variant was assessed in the United States 11 (Table 4). Cases were people with the delta variant infection and controls were individuals with a negative SARS-CoV-2 test. Exposure was having two doses of the Moderna mRNA-1273 vaccine.
Table 4 Effectiveness of two doses of the mRNA-1273 vaccine against infection by the SARS-CoV-2 delta variant.
| Cases (D) | Controls (ND) | |
|---|---|---|
| Exposed (E) | 232 | 4,588 |
| Non-exposed (NE) | 1,795 | 5,547 |
Source: Authors from 11.
Of the 2,027 infected cases, 232 (11.4%) had two doses of the vaccine, and of the 10,135 controls, 4,588 (45.3%) had received the two doses. OR=(232/1,795)/(4,588/5,547)=0.13/0.83=0.16, and it means that the odds of being vaccinated in the group of infected individuals are a fraction equal to 0.16 of the odds of being vaccinated in the group of non-infected individuals.
The odds of exposure in cases are 0.13 and 0.83 in controls, which means that, in cases, for every 100 non-vaccinated individuals, there are 13 who are vaccinated, while in the controls, for every 100 non-vaccinated individuals, there are 83 who are. This indicates that vaccination with the Moderna mRNA-1273 biologic protects against infection by the SARS-CoV-2 delta variant.
OR can be found in the literature as indirect relative risk, given that it is close to the IDR or the RR obtained from a cohort study or from a RCT if the assumption is that the study population is stable and that the control sample is a representation of the population at risk of presenting the outcome. For the case of RR, the outcome cumulative incidence must be low (CI<0,1). If CI>0,1, as the incidence of the outcome of interest increases, the OR overestimates RR (if RR>1), or underestimates RR (if RR<1) 1,6,7,10.
Cross-sectional studies
Frequency measures are point prevalence and period prevalence, and are interpreted as the probability of an individual having the outcome at a specific point in time or period. Overall prevalence (Prev) is equal to the number of subjects who presented the outcome over the total number of subjects, i.e., Prev=(a+c))/n. Prevalences for the exposed group (Prev E ) and for the non-exposed group (Prev NE )can also be obtained, as follows: Prev E =a/(a+b) and Prev NE =c/(c+d)1,6.
Another way to express outcome frequency is by means of prevalence odds (PO), which represents the times an outcome occurs for every instance in which it did not occur, i.e., PO = (a+c)/(b+d) . Similarly, prevalence odds can be derived in the exposed (PO E ) and the non-exposed (PO NE ) using the following expressions: PO E =a/b and PO NE =c/d1,6.
Association measures are derived from outcome prevalence comparison between exposed and non-exposed, either by subtraction or quotient. First, the prevalence difference (PD) is PD = [a/(a+b)]-(c/(c+d)] and is interpreted as the difference in the possibility of the outcome being present in the exposed vs. the non-exposed; and second, the prevalence ratio (PR) is (PR=[a)/(a+b)]/[c)/(c+d)] and is interpreted as the relationship between the possibility of the outcome being present in the exposed vs. the same possibility in the non-exposed. Another association measure can also be built from the prevalence odds ratio (POR) between exposed and non-exposed, i.e., POR=(axd)/(bxc) and is interpreted as the relationship of prevalence odds in the exposed vs. the prevalence odds in the non-exposed 1,6.
In the COVD-19 vaccination report entered in Our World Data 12, 4,451,584,807 people completed the initial scheme out of a total world population of 7,874,965,730, that is to say that 56.5% (Prev=(4,451,584,807/7,874,965,730)x100) of the population completed the vaccination scheme. This result, expressed as odds, indicates that for every individual who had not completed the scheme, 1.3 (PO=0.565/(1-0.565)) people had already completed it. Table 5 shows the number of vaccinated individuals and the number of inhabitants in two regions of the world: the countries of the European Union (EU) and the African continent (AC).
Table 5 Complete initial COVID-19 vaccination scheme in EU and AC countries.
| Complete scheme | |||
|---|---|---|---|
| Regions | Yes | No | Population |
| European Union (EU) | 324,864,451 | 122,325,464 | 447,189,915 |
| African Continent (AC) | 195,379,026 | 1,178,107,446 | 1,373,486,472 |
Source: Our World in Data. Cut-off date: March 10, 2022.
Of the EU population, 73 % (Prev EU =324,864,451/447,189,915) had completed the scheme, i.e., for every individual who had not completed the scheme, 2.66 (PO EU =0.73/ (1-0.73)) had already done so. In the AC, only 14% (Prev_AC=195,379,026/1,373,486,472) had completed the vaccination scheme, which indicates that for every 100 non-vaccinated individuals, only 17 were vaccinated (PO AC =0.14/(1-0.14)).
The prevalence of vaccinated individuals increases by 58% (PD=0.73-0.14) in the EU when compared to the AC, and the prevalence of vaccinated individuals in the EU is 5.11 (PR=0.73/0.14) times the prevalence of vaccinated individuals in the AC. Finally, the odds ratio between the EU and the AF indicates that the odds of vaccinated individuals in the EU is 16.01 (POR=2.66/0.17) times the odds of vaccinated individuals in the AC.
CONCLUSIONS
This article describes basic concepts in epidemiology such as study types and their frequency, association and impact measures. It highlights the importance of understanding study designs as the basis for the adequate interpretation of epidemiological measures and for correct decision-making in clinical practice. Given that mathematical expressions are the basis for deriving the measures and understanding what they each mean, it is important to know how to apply them without risking initial rejection on the grounds of the nomenclature used. This terminology is important and concept-unifying, and hence the imperative need to understand it and use it correctly. Understanding frequency, association and impact measures, their aim and their interpretation is essential to avoid mechanical use of the formulas, thus strengthening a clearer understanding of the subject.