


Serviços Personalizados
Journal
Artigo
 Inglês (pdf)
 Artigo em XML
 Referências do artigo
 Enviar este artigo por email
Indicadores
-
 Citado por SciELO
 -
 Acessos
Links relacionados
-
 Citado por Google
 -
 Similares em
SciELO
Similares em
SciELO -
 Similares em Google
Compartilhar

 Permalink
Desarrollo y Sociedad
versão impressa ISSN 0120-3584
Desarro. soc. n.68 Bogotá jul./dez. 2011
Anemia and Child Education: The Case of Colombia
Anemia y progreso escolar de los niños: el caso colombiano
Alejandro Gaviria y Alejandro Hoyos*
* Authors are listed in alphabetical order. Contact information: Alejandro Gaviria, Economics Department, Universidad de Los Andes, email: agaviria@uniandes.edu.co. Alejandro Hoyos, World Bank, email: ahoyossuarez@worldbank.org. We thank Profamilia for providing the ENSIN dataset. We are grateful to Laura Nivia, Holly Kosiewicz, Emily Conover, Adriana Camacho and Natalia Millán for their comments and suggestions. Any mistake within the paper is our own and the findings, interpretations, and conclusions herein do not necessarily represent the views of the World Bank or its Board of Directors.
This paper was received November 29, 2010, modified January 19, 2011 and finally accepted August 18, 2011.
Abstract
Welfare programs in Colombia have focused on both reducing malnutrition and hunger and increasing school attendance. But there is not much evidence on the hypothesized relationship between nutrition status and schooling outcomes. Using the National Survey of Nutritional Status in Colombia - 2005 (ENSIN) and the Demographic and Health Survey - 2005 (DHS), this paper estimates the impact of nutrition on schooling outcomes. The results suggest that anemic children have a higher probability of being overage in school. Malnutrition, defined by anthropometric measures, does not have an impact on the probability of being overage. School attendance seems to be unrelated to nutrition measures. The results are consistent under different specifications.
Key words: School attendance, overage, nutrition, micronutrients.
JEL classification: I12, I20, O15.
Resumen
Varios programas sociales en Colombia aspiran a reducir la desnutrición e incrementar la asistencia escolar. A pesar de ello, la evidencia sobre la conexión entre los indicadores de nutrición y los de progreso educativo es escasa. A partir de los datos de la Encuesta ENSIN, este trabajo estudia empíricamente el efecto de una mala nutrición (medida, alternativamente, a partir del nivel de hierro en la sangre, la estatura y el peso) sobre la asistencia educativa y el rezago escolar. Los resultados muestran que los niños anémicos tienen una mayor probabilidad de estar rezagados, pero no tanto así los niños que sufren de desnutrición crónica y bajo peso. En general la asistencia escolar no parece estar afectada por ninguno de los indicadores de desnutrición.
Palabras clave: asistencia escolar, rezago escolar, nutrición, micronutrientes.
Clasificación JEL: I12, I20, O15.
Introduction
Human capital is amply recognized as a determinant of economic growth and social wellbeing in general1. Welfare programs have focused on reducing malnutrition and hunger, and on increasing school attendance in developing countries. The Copenhagen Consensus 2004 ranked the reduction of malnutrition and hunger through the provision of micronutrients as the second most desirable intervention among a large number of social programs and government regulations (Lomborg, 2006).
Gwatkin, Rutstein, Johnson, Suliman, Wagstaff and Amouzou (2007) report that, in 1995, 9.5% of Colombian children up to 5 years of age were moderately stunted, and 2.1% severely stunted2. The moderate and severe stunting rates in Latin America and the Caribbean were 13.9% and 6.7%, respectively. Despite the fact that malnutrition for Colombia is lower than the region's average, it´s a cause of concern because of its effects on education, productivity and economic growth. In the last decade, the Colombian government expanded social protection programs aimed at reducing malnutrition and hunger and boosting school attendance.
For instance, Familias en Acción, a conditional cash transfer program, grew from 300 thousand families in 2002 to almost three million in 2010. This program imposes two conditions upon families: one based on controls of weight and height of children up to 6 years of age, and the other based on school attendance of older children. In 1996 the Colombian government implemented the National Food and Nutrition Program. Some of its main objectives were to enrich basic food products with micronutrients, providing iron and other supplements to pregnant women and children up to 5 years of age. In 1996, Decree 1944 established that flour should be fortified with vitamin B1 and B2, iron, folic acid and niacin. The Decree also mandated that salt must be appropriately iodized.
Malnutrition and deficiency in micronutrients in the early years of life have been shown to have a significant and negative impact on cognitive development, long-term health outcomes, productivity and wages (Ghuman, Behrman and Gultiano, 2006). Jukes, Drake and Bundy (2007) show that children with iron deficiency are easily tired, less attentive and have poor cognitive abilities in adolescence. Furthermore, Hanushek and Wößmann (2007) present evidence suggesting that the quality of education has a positive and significant effect on individual earnings, income inequality and economic growth.
Taken together these results suggest that interventions which improve an individual's nutritional status will have a significant effect on both cognitive skills of individuals and educational and economic outcomes of communities. For example, Behrman, Cheng and Todd (2004) find that a relatively modest nutrition program in Bolivia had a positive and significant effect on cognitive and psycho-social skills of children. Bernal, Fernández, Flórez, Gaviria, Ocampo, Samper and Sánchez (2009) find that cognitive development is correlated with the exposure of children to a similar intervention in Colombia. Maluccio, Hoddinott, Behrman, Quisumbing, Martorell and Stein (2006) find that, in Guatemala, a nutrition supplement was associated with gains in cognitive skills and educational attainment after 25 years.
Several studies suggest that poor nutrition and poor health could lead to low school attendance. For example, Bobonis, Miguel and Puri-Sharma (2006) study some interventions in which preschool children in India are provided with an iron supplement. They find that these interventions significantly reduce school absenteeism. Ghuman et al. (2006) use a longitudinal dataset to evaluate the impact of hemoglobin levels on school enrollment among children in Philippines. They find that higher levels of hemoglobin are associated with greater school enrollment. But these findings do not necessarily imply causal effects as they might be driven by omitted variables.
One particular difficulty of trying to explain the educational outcomes with nutritional and health status is that these two dimensions are in many ways parental decisions potentially correlated with unobserved characteristics, such as the extent of parental involvement and care. Alderman, Behrman, Lavy and Menos (2001) use an instrumental-variables approach to correct for this problem. They find that health and nutritional outcomes are three times more important for school enrollment than is suggested by other estimates that do not take into account the potential endogenity of the main variables of interest.
Many studies have examined the determinants of school attendance, school achievement and nutritional status in Colombia. However, few studies have estimated the impact of nutritional status and health on schooling outcomes3 and as the Colombian government has expanded social programs in education and health, this paper could provide valuable information to understand the complementarities of an intervention focus on these two dimensions (education and health).
This paper estimates the impact of nutrition on school attendance and on the probability of being overage4. Two types of measures of nutrition are used: anthropometric measures (z-scores of height-for-age, z-scores of weight-for-age and Body Mass Index (BMI)) and micronutrients measures (hemoglobin). Data is taken from the National Survey of Nutritional Status in Colombia - 2005 (ENSIN), the sample used in the ENSIN is a subsample of the Demographic and Health Survey - 2005 (DHS). Few, if any, studies in Colombia have measured nutritional status using micronutrient levels in blood. The database used is a cross-section of households, which makes it difficult to correct the omitted variables bias. Various robustness checks are included in order to validate the estimates but causal interpretations are not always warranted.
The results suggest that anemia appears to increase the probability of being overage but do not have a discernable impact on school attendance. Malnutrition, defined by anthropometric measures, does not have an impact either on school attendance or on the probability of being overage. This paper is structured as follows: section I discusses the literature on nutrition and its impact on education and economic growth. Section II describes the database. Section III lays out the empirical strategy. Section IV presents the main results. Section V presents some robustness checks and section VI concludes.
I. Literature review
A. Nutrition and child development
According to Stoltzfus (2001), the World Health Organization (WHO) defines anemia as "a condition in which the hemoglobin content of the blood is lower than normal as a result of a deficiency of one or more essential nutrients, regardless of the cause of such deficiency". DeMaeyer and Adiels-Tegman (1985) identify that iron deficiency is the main cause of anemia. Hence deficiencies in this mineral are commonly identified by measuring the hemoglobin level in the blood.
Inadequate diet and hunger are the main causes of insufficient iron intake, and therefore of anemia (Olivares, 1997). But they are not the only causes. Assis, Barreto, Gomes, Prado, Santos and Santos (2004) identify low levels in other micronutrients, intestinal diseases - which implied loss of blood -, poor sanitation and environmental conditions as alternative causes of anemia.
What are the consequences of a poor nutritional status in general? Jukes et al. (2007) present a comprehensive description of the consequences of malnutrition. These authors examine the way stunted or underweight children tend to suffer health disorders that are in turn linked to poor mental development. They find that iodine deficiency is associated with mental retardation and poor cognitive development, and that vitamin A deficiency is linked to an increased risk of mortality. They also show how iron deficiency may cause irreversible damages in brain development:
Iron has many functions in the brain. It is necessary for the production of myelin, the fatty coating around neurons that speeds the transmission of electrical signs; it facilitates the production of neurotransmitters [...]; it is involved in the function of neuroreceptors [...]; and is essential for the metabolic processes that provide energy to the brain (Jukes et al. 2007, p. 65).
The adverse consequences of malnutrition may be mitigated with interventions that include micronutrient supplements, improvements in diet, deworming, and others. Some authors have offered a guideline for successful nutritional interventions (Stoltzfus and Dreyfuss, 1998; Zlotkin, Schauer, Christofi des, Sharieff and Tondeur, 2005). Others have evaluated the impact of a series of interventions on nutritional and health status, cognitive development, productivity and the long-term development of children5.
B. School outcomes and nutrition
Different approaches have been used to examine the relationship between nutrition and educational outcomes (enrollment and achievement). Several studies have consistently found that a better nutritional status leads to a greater chance of school attendance, earlier enrollment and less grade repetition. Bobonis et al. (2006) carried out a random evaluation of a health intervention in India, through which preschool children, between two and six years of age, were provided with iron, vitamin A supplements and deworming drugs. They found that treated children experienced a gain of 5.8 percentage points in the probability of school attendance and a significant improvement in weight. Children with higher anemia rates at the baseline experienced the greatest improvements. This evaluation provides strong evidence of the positive relationship between nutritional status and school attendance.
Ghuman et al. (2006) use a longitudinal dataset to gauge the effect of nutritional status on school enrollment in early childhood in Philippines. They measure nutrition using both anthropometric measures (such as height-for-age) and measures based on micronutrient deficiencies (anemia). They implement an instrumental-variable approach in order to correct for potential endogeneity problems, and use the quality of daycare service providers as their instrument. It supposes that the health and nutritional status of a child should be explained, at some point, by the quality of the daycare service provider when they were younger. They find a positive and significant effect of hemoglobin levels on school enrollment. However, it seems difficult to argue that the instrument used by the authors is not related with school attendance, the quality of daycare service providers is not related with school attendance directly or at least through other channels different to nutrition and health.
Alderman et al. (2001) use a dynamic model to show that regress school enrollment on a contemporaneous measure of nutritional status might lead to incorrect estimates. The reason is that the previous nutritional status and current school enrollment are driven by contemporaneous decision of the parents. Thus, the current nutritional status could be determined by the current school enrollment and the causal effect of a contemporaneous measure of nutrition on school enrollment could not be estimated. For this reason, these authors emphasize the importance of using longitudinal datasets that permit measurement of nutrition prior to school enrollment. They use a longitudinal dataset for a period spanning five years (1986-1991) in rural Pakistan. The nutritional status is instrumented with price shocks during pre-school age. Results suggest that the effect of nutrition (height-for-age) on school enrollment is significant and positive. Interestingly, the effect is three times larger for girls than for boys.
Jukes et al. (2007) discuss some reasons why malnutrition may have a negative impact on school enrollment. The main reasons are associated with parental decisions. Parents perceive smaller children as both physically and mentally immature and consequentially decide to wait until children are older to enroll them in school. Besides, healthy children have higher marginal benefits from education and are enrolled with priority over their less healthy siblings. Field, Robles and Torero (2009) find that an intervention in Tanzania, which provides iodized oil capsules to pregnant women in order to reduce fetal iodine deficiency disorders, has a positive impact on children's schooling. The impact appears to be associated with improvements in cognition rather than with reduction in absenteeism due to illness.
Other studies have focused on estimating the effect of nutrition on cognitive functions. Jukes (2006) reviews various studies that evaluate the impact of nutritional interventions on cognitive abilities. His own studies show that, on average, nutritional interventions in early childhood have a positive impact of two thirds of a standard deviation on cognitive abilities. Other studies, reviewed by Jukes, suggest that preschool children who received some nutritional support experience long-term benefits in IQ scores, working memory and cognitive functions. Suffering from anemia may be associated with a loss in IQ score of between 4.5 and 10.5 points. Jukes concludes that early childhood health and nutritional interventions are highly cost-effective and have a consistently large impact on cognitive development.
This paper is not an evaluation of a nutritional intervention upon cognitive abilities or educational outcomes. We use a cross-sectional database in an attempt to estimate the impact of malnutrition on educational outcomes. The characteristics of the database limit the range of methodologies that might be applied and therefore cast some doubts on the causal inferences we can make. Despite its methodological limitations, this paper is probably the first to estimate the effect of iron deficiencies on educational outcomes in Colombia.
This study differs from most of the literature in the use of the probability of being overage as an educational outcome. This variable combines grade repetition, non-attendance for one or more periods (years) and late school enrollment. Most previous studies have focused exclusively on school enrollment, school attendance, and test scores. Finally it is important to note that we do not have data on standardized test scores or school grades which might allow us to evaluate the impact of nutrition on school achievement. This study is similar to the evaluation of Ghuman et al. (2006), however, we focus more on the overage and not as much on the school attendance. Moreover, the study of Ghuman et al. uses a longitudinal data set which is a better approach to explore the relation between nutrition and educational outcomes. Because of the limitation of the data used in this paper, the results should not be interpreted as casual effects.
II. Data
The dataset used in this paper is the National Survey of Nutritional Status in Colombia - 2005 (ENSIN), which is based on a subsample of the Demographic and Health Survey - 2005 (DHS). In addition to the information provided by the DHS-anthropometric measures of children, socioeconomic and health characteristics of mothers, among others, the ENSIN contains information of micronutrients (hemoglobin, ferritin, vitamin A, and Zinc), food safety and physical activity of individuals.
The ENSIN contains information from 17,740 households, divided into 1,920 segments and 209 primary sample units (mainly municipalities). It is representative of urban and rural areas, of six regions and fourteen sub-regions in Colombia. After restricting the sample to children between one to twelve years of age, the number of observations is reduced to 10,653 households. Of those, 75% belong to the urban areas and 25% to the rural areas.
We used three measures for children's education: school attendance, schooling gaps (years) and overage (dichotomous variable). As mentioned earlier, the last two variables implicitly combine grade repetition, later enrollment and periods of non school attendance (three outcomes of interest). Table 1 shows the median years of education by gender and age using the 10% of the 1993 Colombian Census from ipums-International. Schooling gaps are calculated as the maximum between zero and the actual schooling minus the median schooling of the population for the child's same gender and age minus one. It takes positive values for overage children and zero otherwise. A child is considered as overage in school if his or her years of schooling are strictly less than the corresponding median.
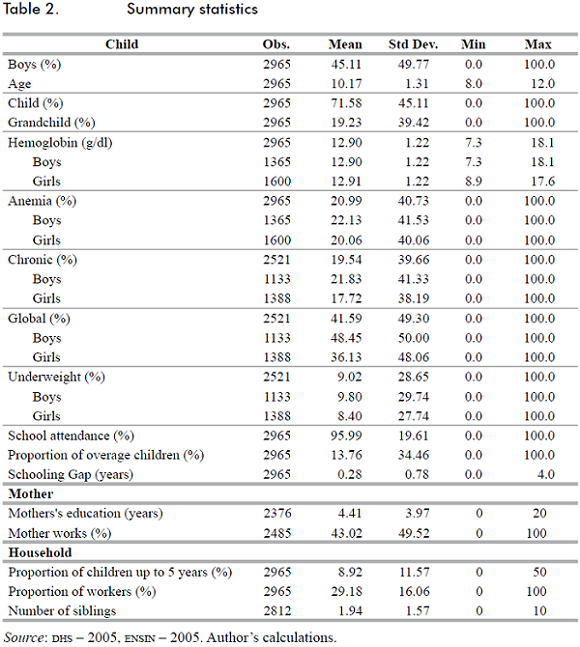
The sample used in this paper is limited to boys between 9 and 12 years, and girls between 8 and 12 years of age, the resulting sample has 2.965 observations. All the descriptive statistics and results correspond to this sample. The school-attendance rate is pretty high (95.9%), the proportion of overage children is 13.7%, and the average schooling gap is 0.28 years. The nutritional status of children was measured using micronutrients levels in the blood. In ENSIN, levels of hemoglobin, ferritin, vitamin A and zinc were measured by taking blood samples during the visit to households. Levels of hemoglobin were obtained using the HemoCue system, which enabled the interviewers to obtain a measure in a matter of seconds. In contrast, ferritin, vitamin A and Zinc had to be measured later on in the Colombian National Institute of Health laboratories.
The World Health Organization has established a hemoglobin level below 12 grams per deciliter of blood among children from 5 to 12 years as the cut-off level for assessing whether a child is anemic or not. According to this standard, about 21% of the children in the sample are anemic. Moreover, there is not a statistically significant difference in the anemia rate between girls and boys (20.1% and 22.1%, respectively). Table 2 presents descriptive statistics of the main variables and covariates used in the analysis.
There appears to be a consistent relationship between the economic conditions of a household, on the one hand, and the educational outcomes and the nutritional status of children, on the other. As the level of household wealth increases, rates of anemia fall as well as the proportion of overage children. Attendance rates are slightly higher for the fourth and fifth quintiles6. The fraction of anemic children is particularly different between the first three quintiles and the last two. Table 3 presents summary statistics by wealth quintiles.
There are six geographical regions in Colombia (Atlántica, Oriental, Central, Pacífica, Bogotá and Orinoquia-Amazonia). These regions differ greatly in their cultural and nutritional habits, as well in their topographical and agro-climatic conditions and in their levels of economic development. All of these differences might contribute to differences in educational and nutritional outcomes. The Atlántica region presents the highest proportion of overage children and anemic children, 19.9% and 47.7%, respectively. Bogotá has the lowest anemia rate (0.7%) and the Orinoquia-Amazonia region has the lowest fraction of overage children (7.4%). Table 4 presents summary statistics by geographical region.
Measures of nutrition based on micronutrients in blood were contrasted with anthropometric measures of nutrition based on height and weight. To compare the results of anemia and anthropometric measures, we restrict the sample to boys between 9 and 12 years, and girls between 8 and 12 years of age, who have information on anemia, weight and height. After restricting the sample, the sample is reduced to 2.521 children.
Chronic malnutrition is defined as a low height for the age and global malnutrition as a low weight for the age. Similarly, a child is said to be underweight if he or she has a low Body Mass Index for his or her age7. All measures are based on a set of reference parameters provided by the National Center of Health Statistics of the United States8. To determine that a child has some form of malnutrition, a z-score has to be constructed using the reference parameters9. Children with z-scores values below -2 are considered to be suffering from malnutrition (chronic malnutrition, global malnutrition or underweight). In the sample, the chronic malnutrition rate is 19.5%, the global malnutrition rate is 41.6% and the underweight rate is 9.0%. Global and chronic malnutrition are statistically different by gender. Underweight does not vary by gender.
Figure 1 shows the relationship between mean hemoglobin levels and the z-scores previously defined10. The correlation coefficients between mean hemoglobin and z-Body Mass Index, z-weight and z -height are 0.66, 0.36 and 0.32, respectively. The relationship between z-scores and mean anemia rates appears to be stronger. Figure 2 plots the anemia rates against anthropometric measures. The corresponding correlation coefficients are now -0.78, -0.65 and -0.50, respectively. As expected, malnourished children are more likely to suffer from anemia.
Finally, Figures 3 and 4 plot the fraction of overage children and the mean attendance rates against all four nutritional measures (rounded to the nearest tenths). There is a negative relationship between the nutritional status and the fraction of overage children. On the other hand, school attendance and nutritional measures appear to be uncorrelated. These results anticipate the main findings of the next sections of this paper.
III. Empirical strategy
This paper uses a similar methodology to Ghuman et al. (2006). But because the database used in this paper is not longitudinal, we use contemporaneous measurements of nutrition and education. We assume that the nutritional status is a cumulative process, which implies, among other things, that the current nutritional status has a high correlation with the previous nutritional history. Hence, we used the current nutritional status as a proxy for early nutrition.
Equation 1 presents the specification used in this paper. Eit is an educational outcome (overage or school enrollment) of child I, Nit is the nutritional status (anemia, global malnutrition, chronic malnutrition or being underweight), Iit is a vector of the individual's characteristics such as gender, age and relation with the household head, Mit is a vector of mother's characteristics such as years of education, age and whether the mother has a job, Hit is a vector of a household's characteristics such as the proportion of children up to 5 years of age, the proportion of household members actually working, the number of siblings, and the socioeconomic level (wealth quintile), and, finally, Rit is a vector of the region's characteristics.

Two dependent variables are used in the analysis: whether the child is overage and whether he or she is currently enrolled (school attendance). Overage is a dichotomous variable that takes the value of one if the years of schooling are strictly less than the median of the population for the child's same gender and age. School attendance is also a dichotomous variable that takes the value of one if the child is currently attending a school. We estimate equation 1 using a probit model and report the marginal effects. As a robustness check, we use the overage measured in years as an alternative dependent variable. This variable can take values between zero and four. In this case we use an ordered probit model instead.
IV. Analytical results
This section presents the main results of the paper. All the regressions are weighted to account for the sampling scheme. Standard errors are corrected for clustering at the municipality level; because of the design of the survey, the municipality is the primary sample unit. Table 5 presents the estimated coefficients of the specification described in equation 1. The results show the changes in the probability of being overage. Children who suffer from anemia are 4.6 percentage points more likely to be overage. Maternal education is significant and has the expected sign. Children with mothers who are more educated are less likely to be overage: an increase in one year of the education of the mother reduces this probability by 0.6 percentage points. The effect of a mother's occupation is not significant. The marginal effect of anemia is substantial: it is comparable to an increase of eight years in the mother's education.
The household's controls are not significant, except for the number of siblings. An additional sibling increases the probability of being overage by one percentage point. Individual controls, such as age and gender, are also included in the specification. No differences by gender are apparent but the probability of being overage increases with age.
The estimate of the effect of anemia on the probability of being overage varies significantly once parental and regional controls are included. This result suggests that anemia (and malnutrition in general) may be highly correlated to parental and regional characteristics that have a direct influence on educational outcomes. If we were to omit relevant variables at the regional or parental level, we would arrive at an incorrect estimate of the marginal effects. Some researchers have suggested in many studies that estimates of the effect of nutrition on educational outcomes may be biased due to omitted variables11. The database used in this paper does not allow us to fully correct for this problem12. We include in the empirical exercises a set of parental controls as well as regional fixed effects in order to reduce the potential bias. Section 6 presents robustness checks to validate the results presented in this section.
Table 6 shows the estimated effects of anemia on school attendance. The probability of attending school does not depend on anemia or hemoglobin levels. One possible explanation for not finding an effect of nutritional status on school attendance is that school attendance is almost universal (96 percent of students in the sample attend to school). As mentioned earlier, a child is overage either because of grade repetition, non-attendance during one or more periods, late school enrollment, or a combination of these problems. Results suggest that anemia has an impact on the probability of being overage, but not on school attendance. Thus, the impact of anemia on the probability of being overage must be associated with either late enrollment or with grade repetition. We are not able to distinguish between these two potential explanations.
Anthropometric measures of nutrition, such as global and chronic malnutrition, were used in order to compare and complement the previous results. Table 7 summarizes the effects on the probability of being overage of various anthropometric measures of nutrition. No significant effects were found. Whereas the effect of anemia is apparent in the data used in this paper, the effect of anthropometric measures is not apparent. Household and individual characteristics preserve the magnitude and significance shown in Table 513.

The different results obtained for the two types of nutrition measures used in this paper (anemia and anthropometric variables) do not deny the possibility of omitted variables bias. However, these results suggest some interesting possibilities. As stated earlier, anemia seems to increase the probability of being overage, but anthropometric measures do not. This will occur, for example, if being overage is the result of grade repetition, caused by poor cognitive development related in turn to deficiency of micronutrients in childhood. Anthropometric measures could incorporate other characteristics such as genetic and demographic background or ethnicity, and for this reason, it could not reflect necessarily the true nutritional status of an individual. In that sense, measures based on micronutrients (anemia for example) are probably a better indicator of nutrition.
Table 8 presents the estimation results of a regression that combines anemia and the anthropometric measures of nutrition. If the perception of parents about the nutritional status of their children is based on a visual examination of weight and height, we could expect those perceptions to be captured by the anthropometric measures. Hence this specification allows us to measure the effect of anemia on the probability of being overage controlling for the psychical appearance of the child. The results suggests that the effect of anemia on the probability of being overage is not driven by a pessimistic parental assessment of the children´s nutrition and health that in turn affect their decisions about whether and when to send the child to school. The coefficient on anemia is similar in magnitude and significance to the one estimated in Table 5.
Finally, Table 9 compares the prevalence of anemia with that of the anthropometric measures of malnutrition. The percentage of anemic children who are also chronically malnourished is 66.2%. For global malnutrition and being underweight, the corresponding percentages are 57.1% and 70.5%, respectively. Clearly, anemia is partially correlated with the other forms of malnutrition. Anthropometric measures, however, might be distorted by genetic and ethnic characteristics of the populations under analysis.
V. Robustness checks
In the first exercise, we redefine the dependent variable. Instead of using a dichotomous variable that takes the value one if the years of schooling are strictly less than the median of the population for the child's same gender and age minus one, we use a variable defined as the difference between the years of schooling and the median of the relevant population minus one. We refer to this variable as the schooling gap. The rationale of this exercise is to give more variation to the dependent variable and to verify whether or not the effect of anemia on schooling remains after that. Table 10 presents the estimate of an ordered probit where the dependent variable is the schooling gap in years. The reported coefficients are the marginal effects on the probability of not being overage. The results are almost the same as those presented in Table 5.
As mentioned earlier, the correlation between schooling and nutrition might be driven by the quantity and quality of social infrastructure (hospitals, schools, sewer systems, etc). If this is so, the results will be biased. Figure 5 plots mean anemia levels and the proportion of overage children at the municipality level. A positive correlation is apparent. To check whether or not the results are sensitive to omitted municipal variables or city characteristics, we perform two different exercises: first, we estimate the original specification using two different samples: the first is limited to the 13 main metropolitan areas of the country and the second to rural areas only; and second, we add to the specification the sewage coverage rate in the municipality as a proxy for social infrastructure.
Table 11 reports the estimation results for the restricted samples. As mentioned earlier, we first restrict the sample to the main 13 metropolitan areas of the country (Medellín, Barranquilla, Bogotá, Cartagena, Manizales, Montería, Neiva, Villavicencio, Pasto, Cúcuta, Pereira, Bucaramanga and Cali). Because all these cities have a relatively similar level of social infrastructure, the problem of omitted municipal variables is arguably less serious in this case. As shown, the magnitude and significance of the effect of anemia on the probability of being overage does not change substantially. Additionally we restrict the sample to rural areas. In this case, the coefficient of anemia is even larger than in the full sample. Probably some characteristics of rural areas, lack of infrastructure, for example, aggravate the supposed impact of anemia on schooling outcomes.
The second exercise adds the sewage coverage rate to the original specification. Arguably, this variable permits to control for the level of social infrastructure, thus reducing the possibility of omitted variables bias. The effect of anemia on the probability of being overage dropped to 4.1 percentage points in this case (not reported) but it is still significant.
Finally, we estimate the original specification using a different definition of overage. In the new definition an eight-year-old child is considered to be overage, if he or she has not passed first grade, a nine year old if he or she has not passed second grade, and so on. Table 12 presents the new results. The estimated effect is even larger than that reported in Table 5. Under the initial definition, being anemic increases the probability of being overage by 4.6 percentage points; under the new definition, by 5.1 percentage points.
VI. Conclusions
This paper provides evidence of the relationship between nutrition and education in Colombia. The evidence suggests that anemic children are more likely to be overage. Chronically malnourished and underweight children, on the other hand, are not more likely to be overage. Nutrition, in general, does not have a significant effect on school enrollment. Despite the limitations of the database and the potential endogeneity problems, the results passed all the robustness checks presented.
The results suggest that educational and nutritional policies in Colombia should focus on the reduction of micronutrients deficiencies. Interventions should include a preventive component, such as the supplementation of micronutrients for children from 6 to 24 months of age and for pregnant women. Probably, they should also include the fortification of food with micronutrients, the promotion of both breastfeeding and diet diversification.
Nutritional programs should be revised in order to incorporate effective strategies to combat micronutrient deficiency and not just to reduce hunger. Even more, preventive strategies should be implemented from pregnancy to early childhood. Educational outcomes should be part of the goals of any nutritional intervention. "There is also evidence that for malnourished populations, such as those living in many developing countries, the gains from investments in better nutrition may be substantial - perhaps even greater than the gains from schooling investments" (Behrman and Skoufias, 2004, p. 336).
This paper is perhaps the first to carefully study the effects of nutrition on educational outcomes in Colombia. However, the methodology employed is susceptible to criticism. This is an observational study and so we cannot rule out potential biases due to omitted variables. Further research is needed to both validate the results presented here and to study the impact of nutrition on mental development, psychosocial outcomes and long-term outcomes such as wages and labor productivity.
FOOT NOTES
1 See for example: Barro (1996), Schultz (1997), Fogel (2001), Bhargava, Jamison, Lau and Murray (2001), Bloom, Canning and Sevilla (2004) and Weil (2007).
2 Moderate stunting are children with a height-for-age Z-score between -2 and -3 standard deviations of the reference standard. Severe stunting are children with a height-for-age Z-score below -3 standard deviations of the reference standard.
3 Floréz, Ribero and Samper (2003) present evidence of the impact of nutrition and health status on human capital accumulation for adult women in Colombia.
4 We consider that a child is overage if his or her years of schooling are strictly less than the median of the population for the child's gender and age minus one.
5 See for example Jukes (2006) and Grantham-McGregor and Ani (2001) for a review of studies that evaluate the impacts of some interventions.
6 The fifth quintile corresponds to the richest households, and the first to the poorest. Wealth quintiles were constructed from existing data on household assets, dwelling characteristics and access to public services using Principal Components.
7 Body Mass Index is the weight in kilograms divided by the square of the height in meters.
8 Parameters of references may be consulted in the web site of the National Center of Health Statistics: http://www.cdc.gov/nchs/about/major/nhanes/growthcharts/datafiles.htm.
9 Z - Scores are constructed as:  , where x is the anthropometric measure of a child, M is the median of reference, S is the generalized coefficient of variation and L is the power in the Box-Cox transformation. M, L and S are the parameters of reference.
10 For a particular z-score, say x, we compute the average hemoglobin level for all children with z-scores in the interval [x - 0.05, x + 0.05]. We do this for all 41 values in this sequence: -2, -1,9, -1,8,...1,8, 1,9, 2.
11 See, for example, Alderman et al. (2001) and Behrman and Lavy (1997).
12 We attempt to implement an instrumental variables approach. However, instruments like price shocks and quality of pre-school service providers proposed by other authors are not available for us to use.
13 The sample was restricted to children with information of anemia in order to compare the results of anemia and anthropometric measures. When the sample is not restricted, the results are very similar.
References
1. ALDERMAN, H., BEHRMAN J. R., LAVY, V. y MENOS, R. (2001). "Child health and school enrollment: A longitudinal analysis", The Journal of Human Resources, 36(1):185-205. [ Links ]
2. ASSIS, A. M., BARRETO, M. L, GOMES, G. S., PRADO, M. S., SANTOS, N. S., SANTOS, L. M. et al. (2004). "Childhood anemia prevalence and associated factors in Salvador, Bahia, Brazil", Cad Saude Publica, 20:1633-1641. [ Links ]
3. BARRO, R. (1996). Health and economic growth. Cambridge, MA. Harvard University. [ Links ]
4. BEHRMAN, J. R., CHENG, Y. y TODD, P. (2004). "Evaluating preschool programs when length of exposure to the program varies: A nonparametric approach", Review of Economics and Statistics, 86(1):108-132. [ Links ]
5. BEHRMAN, J. R. y LAVY, V. (1997). "Child health and schooling achievement: Association, causality and household allocations" (Working Paper 97-023). Penn Institute for Economic Research, University of Pennsylvania. [ Links ]
6. BEHRMAN, J. R. y SKOUFIAS. E. (2004). "Correlates and determinants of child anthropometrics in Latin America: Background and overview of the symposium", Economics and Human Biology, 2(3):335-351. [ Links ]
7. BERNAL, R., FERNÁNDEZ, C., FLÓREZ, C. E., GAVIRIA, A., OCAMPO, P. R., SAMPER, B. y SÁNCHEZ, F. (2009). "Evaluación de impacto del Programa Hogares Comunitarios de Bienestar del ICBF" (Documento CEDE 2009-16). Facultad de Economía, Universidad de los Andes. [ Links ]
8. BHARGAVA, A., JAMISON, D. T., LAU, L. J. y MURRAY, C. J. L. (2001). "Modeling the effects of health on economic growth", Journal of Health Economics, 20(3):423- 440. [ Links ]
9. BLOOM, D. E., CANNING, D. y SEVILLA, J. (2004). "The effect of health on economic growth: A production function approach", World Development, 32(1):1-13. [ Links ]
10. BOBONIS, G. J., MIGUEL, E. y PURI-SHARMA, C. (2006). "Anemia and school participation", Journal of Human Resources, 41(4):692-721. [ Links ]
11. Decreto 1944 de 1996. Ministerio de Salud Pública. República de Colombia. Octubre de 1996. [ Links ]
12. DEMAEYER, E. M. y ADIELS-TEGMAN, M. (1985). "The prevalence of anaemia in the world", World Health Stat Q., 38:302-316. [ Links ]
13. Documento Conpes 2847. Departamento Nacional de Planeación. República de Colombia. Mayo de 1996. [ Links ]
14. FIELD, E., ROBLES, O. y TORERO, M. (2009). "Iodine deficiency and schooling attainment in Tanzania", American Economic Journal - Applied Economics, 1(4): 140-169. [ Links ]
15. FLÓREZ, C. E., RIBERO, R. y SAMPER, B. (2003). "Health, nutrition, human capital and economic growth in Colombia 1995-2000" (Documento CEDE 2003-29). Facultad de Economía, Universidad de los Andes. [ Links ]
16. FOGEL, R (2001). The impact of nutrition on economic growth. The University of Chicago. Third International Conference The Economics of Health. [ Links ]
17. GHUMAN, S., BEHRMAN, J. R. y GULTIANO, S. (2006). Children's nutrition, school quality and primary school enrollment in the Philippines (Working Paper Series Vol. 2006-24). The International Centre for the Study of East Asian Development, Kitakyushu. [ Links ]
18. GRANTHAM-MCGREGOR, S. y ANI, C. (2001). "A review of studies on the effect of iron deficiency on cognitive development in children", The Journal of Nutrition, 131: 649S-668S. [ Links ]
19. GWATKIN, D. R., RUTSTEIN, S., JOHNSON, K., SULIMAN, E., WAGSTAFF, A. y AMOUZOU, A. (2007). Socio-economic differences in health, nutrition, and population. Washington, D. C., The World Bank. [ Links ]
20. HANUSHEK, E. A. y WÖßMANN, L. (2007). "The role of school improvement in economic development" (NBER Working Paper 12832). National Bureau of Economic Research. [ Links ]
21. JUKES, M. (2006). Early childhood health, nutrition and education. Background paper for EFA Global Monitoring Report 2007. [ Links ]
22. JUKES, M., DRAKE, L. J. y BUNDY, D. A. P. (2007). School health, nutrition and education for all levelling the playing field. Cambridge, MA., CAB International Publishing. [ Links ]
23. LOMBORG, B., (ed.) (2006). How to spend $50 billion to make the world a better place. Nueva York, Cambridge University Press. [ Links ]
24. MALUCCIO, J. A, HODDINOTT, J., BEHRMAN, J. R., QUISUMBING, A. R., MARTORELL, R. y STEIN, A. D. (2006). The impact of nutrition during early childhood on education among Guatemalan adults. Washington, D. C., IFPRI, mimeo. [ Links ]
25. Minnesota Population Center. Integrated Public Use Microdata Series - International: Version 4.0. Minneapolis: University of Minnesota, 2008. From: National Administrative Department of Statistics. [ Links ]
26. National Center for Health Statistics. National health and nutrition examination survey - Growth Charts. Available at: http://www.cdc.gov/nchs/about/major/nhanes/growthcharts/datafiles.htm. [ Links ]
27. OLIVARES, M. (1997). "Anemia ferropriva", en J. Meneghello, E. Fanta, E. Paris y T. Puga (Ed.), Pediatría (5th ed., pp. 1745-1749). Buenos Aires, Editorial Médica Panamericana. [ Links ]
28. Profamilia (2005). Encuesta Nacional de Demografía y Salud. [ Links ]
29. Profamilia (2005). Encuesta Nacional de la Situación Nutricional en Colombia. [ Links ]
30. SCHULTZ, T. P. (1997). "Assessing the productive benefits of nutrition and health: An integrated human capital approach", Journal of Econometrics, 77(1):141-158. [ Links ]
31. STOLTZFUS, R. J. (2001). "Defining iron-deficiency anemia in public health terms: A time for reflection", The Journal of Nutrition, 131:565S-567S. [ Links ]
32. STOLTZFUS, R. J. y DREYFUSS, M. L. (1998). Guidelines for the use of iron supplements to prevent and treat iron deficiency anemia. Washington, D. C., International Nutritional Anemia Consultative Group. [ Links ]
33. WEIL, D. (2007). "Accounting for the effect of health on economic growth", The Quartely Journal of Economics, 122(3):1265-1306. [ Links ]
34. ZLOTKIN, S. H., SCHAUER, C., CHRISTOFI DES, A., SHARIEFF, W., TONDEUR, M. C., et al. (2005). "Micronutrient sprinkles to control childhood anemia", PLoS Med 2 (1): e1. [ Links ]

