


Serviços Personalizados
Journal
Artigo
 Inglês (pdf)
 Artigo em XML
 Referências do artigo
 Enviar este artigo por email
Indicadores
-
 Citado por SciELO
 -
 Acessos
Links relacionados
-
 Citado por Google
 -
 Similares em
SciELO
Similares em
SciELO -
 Similares em Google
Compartilhar

 Permalink
Desarrollo y Sociedad
versão impressa ISSN 0120-3584
Desarro. soc. n.68 Bogotá jul./dez. 2011
Voters' Rationality Under Four Electoral Rules: A Simulation Based on the 2010 Colombian Presidential Elections
La racionalidad de los votantes con cuatro reglas electorales: simulación basada en las elecciones presidenciales de Colombia en 2010
Julián Parada*
* Université Paris-Est, Erudite. Email: juliandpb@gmail.com.
I am especially grateful to all the persons who kindly helped me to gather the participants and to distribute the questionnaire. I also thank all the disinterested voters who voluntary contributed to this work. Thanks to Karine van der Straeten, Silvia Concettini, Giacomo Nervegna, María del Rosario Franco, Darío Maldonado, Patrick Feve, George Casamatta, Andrés Zambrano, Santiago Melo and an anonymous referee for their useful comments and suggestions. All remaining mistakes are my responsibility.
This paper was received October 13, 2011, modified October 20, 2011 and finally accepted October 20, 2011.
Abstract
In this work we analyze the impact of the voting rule on individual behavior. We use a sample of individuals naturally motivated by real candidates. Then, in our methodology we do not induce preferences. Moreover, up to our knowledge, this is the first work in which both individual behavior and aggregate results are studied with a relatively large sample. We implemented an online simulation during the presidential campaigns for 2010 in Colombia. Voters were asked to submit experimental ballots under four different voting rules: plurality rule, approval voting, Borda rule and majority rule with runoff elections. We compared the observed individual behavior with two benchmarks. The fist one considers sincere voting and the second one instrumental behavior. Our results show that under approval voting and Borda rule we observe a lower level of sincerity and instrumental behavior in comparison to the other two rules. However, both models predict well the aggregate outcomes under all the voting rules.
Key words: Voting rules, instrumental strategic voters, sincere voting, social choice.
JEL classification: D71, D72, C9.
Resumen
En este trabajo analizamos la incidencia de la regla de votación sobre el comportamiento individual. Empleamos una muestra de individuos estimulados naturalmente por candidatos reales; por consiguiente, en nuestra metodología las preferencias no son inducidas. Más aún, hasta donde sabemos, este es el primer trabajo en el que tanto el comportamiento individual como los resultados agregados son estudiados con una muestra relativamente grande. Implementamos una simulación durante las campañas electorales para presidencia de 2010 en Colombia. Solicitamos a los votantes depositar balotas experimentales con cuatro reglas de votación diferentes: regla de pluralidad, voto aprobatorio, sistema Borda y regla mayoritaria restringida a dos vueltas. Posteriormente comparamos el comportamiento individual observado con dos marcos teóricos de referencia. El primero considera votación sincera y el segundo considera comportamiento instrumental. Nuestros resultados muestran que la votación sincera y el comportamiento instrumental son menores con voto aprobatorio y regla Borda que con las otras dos reglas. Sin embargo, ambos modelos predicen bien los resultados agregados con todas las reglas de votación.
Palabras clave: reglas de votación, votantes instrumentales, votación sincera, elección social.
Clasificación JEL: D71, D72, C9.
Introduction
Human beings may adopt different ways to organize their societies and may develop different institutions to achieve social outcomes. Every society can adopt a variety of organizational systems in which social choices can be made by a reduced set of individuals (even by only one) or by larger groups. Most societies have adopted democracy as a way to make social decisions. Its adoption has been mainly justified because it promotes equality among all of its members; theoretically, they all have the same power to decide over the set of social outcomes. Another argument in favor of democracy was provided by Condorcet in his jury theorem: when the number of individuals involved in making decisions goes to infinity, the probability of making mistakes goes to zero1.
In this document we focus our attention on the social decision making process in democracies. If individuals are all equal within a society, and if they all participate in the process of choosing an option, an ideal social outcome under a democracy should reflect the will of each one of its members. However, given that individuals within each society are heterogeneous, it seems impossible to aggregate satisfactorily their preferences over a set of options in order to choose only one2. For that reason, a desirable (second best) outcome is one that at least reflects the preferences of the majorities. To this end, democratic societies can adopt different institutions, each one having particular properties that may help (or may difficult) majorities to achieve their will.
Here, we specifically study one set of democratic institutions: voting rules as electoral systems to choose candidates in large elections.
Besides the problem of aggregation, Gibbard (1973) and Satterthwaite (1975) provided negative results about individuals' incentives to report their preferences truthfully. Particularly, in our context, they showed that every non-dictatorial electoral system is not strategy-proof, i.e. individuals do not necessary vote for their most preferred candidate. However, each electoral system might show different abilities to induce thuthtelling and to achieve outcomes in which individual preferences are better represented. To illustrate the importance of this point, let us use an example similar to the one provided by Jean-Charles de Borda in 17813:
Suppose that in a democratic society there are three types of voters, each one characterized by her preferences over three candidates. The 30% of the population are type A voters, another 30% are type B, and the remaining 40% are type C. Voters of types A and B are rightists, but they differ in that the former are extremists; and voters of type C are leftists. Candidate Blue represents the extreme right party, candidate Purple belongs to the moderate right party, and candidate Red belongs to the left party. Then, voters of type A are strictly better off when candidate Blue wins, but for them it is still fine if candidate Purple wins. Similarly, voters of type B are strictly better off when candidate Purple wins, but they are still fine if candidate Blue wins. Moreover, both types of voters, A and B, are strictly worse off if candidate Red wins: in that case, they do not get any satisfaction. In contrast, type C voters are strictly better off when candidate Red wins, and they do not have any satisfaction when either candidate Blue or Purple wins. To sum up, 60% of voters are rightists and 40% are leftists. Now, suppose that this distribution of types and their preferences are common knowledge. Suppose as well that in this democracy the three candidates are running for a position and the voting rule is pluralism4. If democracy works well, any of the two rightist candidates should win the elections because they are preferred by the majority.
Notice, however, that if each voter would reveal truthfully her type (i.e. if she would vote for her most preferred candidate), candidate Red would win the elections. Nevertheless, individuals of type A and B may forecast this result, and, in order to avoid candidate Red's victory, they could coordinate their vote to favor any of the two rightist candidates. Given this observation, and considering that coordination may be difficult, Jean-Charles de Borda designed a voting rule, the Borda count system, that may help avoid the coordination problem when individuals vote truthfully: when casting her ballot, a voter has to rank the competing candidates by allocating a different number of points (votes) to each one of them. In our example, a voter must allocate in her ballot the three different votes available -zero, one, and two- among the three candidates. Therefore, if all voters cast her ballots truthfully, there would be a tie between candidates Blue and Purple, and, according to our assumption, the winner would be elected randomly between these two candidates.
From the example above, let us highlight the fact that concerns us the most in this paper: different voting rules may affect individual behavior in different ways. In particular, each voting rule provides specific incentives to vote truthfully or not. In this document we seek to answer the following question: How is individual behavior affected by voting rules? In order to answer this question, we conducted an online simulation during the campaign for the Colombian presidential elections that took place in 2010. We asked participants to cast votes for the real contesting candidates under four different voting rules: plurality, approval voting, Borda rule and majority rule with runoff elections. We also asked them to reveal their preferences over the set of candidates. With these preferences we built two theoretical (behavioral) benchmarks for each voting rule and we compared them with the observed behavior. The first benchmark, called sincere voting, was constructed with ballots that individuals cast if they rank the candidates following their preference order5. The second benchmark, instrumental voting, relies on Myerson and Weber's (1993) theory of voting equilibria, and was made up of ballots that individuals cast if they vote following an optimizing behavior according to our assumptions. Hence, under our framework, we were able to determine whether individuals behaved sincerely, instrumentally, both, or none. Moreover, we can determine which benchmark better predicts the outcome.
Our results show that voters behave more sincerely and instrumentally under plurality and majority rules than under approval voting and Borda rule. However, both models predict relatively well the aggregate outcome observed. This occurs because most of the not sincere and/or not instrumental ballots are allocated to candidates ordered in the middle of the preferences. This behavior may be attributed to either heuristic or strategic behavior.
Previous literature has focused its analysis on either aggregate electoral outcomes or individual behavior in small elections, but not on both of them with relatively larger samples. Moreover, most of these works build on artificial settings. To our knowledge, our work is the first in which both the aggregate and individual dimensions are analyzed from a large sample of individuals naturally stimulated.
Forsythe, Rietz, Myerson and Weber (1996) ran a laboratory experiment under three voting rules: plurality, approval voting and Borda rule. Through a series of elections, their main goal was to study the impact of polls on aggregate outcomes. Blais, Laslier, Sauger and Van der Straeten (2009) implemented an experiment with four systems -plurality approval voting, majority runoff and single transferable vote (STV)- in order to evaluate the performance of rational choice theory to predict individual behavior. Bassi (2008) studied strategic voting for small elections under three systems through a series of experiments: Borda rule, approval voting and plurality, and investigates which one of these systems is more vulnerable to strategic manipulation by voters. Contrary to these works, in our simulation we did not induce preferences but we asked individuals to reveal them. Moreover, given the nature of our setting we did not implement a series of elections but we conducted the simulation once.
The methodology we present here is more close to that of Laeslier and Van der Straeten (2008) as they implemented their experiment during the 2002 French presidential elections. Despite they used real candidates too, their methodology differs from ours in three aspects: while we distributed forms through the Internet three weeks before the real elections, they ran their experiment in real time and in real space6. Second, instead of comparing their results under the four voting rules we suggest here, they only considered two of them: approval voting and majority runoff. Third, they do not analyze individual behavior.
The document is organized as follows. In the following section we describe our simulation. In section II we present and discuss each benchmark under each voting rule. In section III, for each individual and for each rule, we present the results by comparing the observed submitted ballot with the sincere (instrumental) ballot, and we determine two main issues: 1. What proportion of the observed ballots is sincere (instrumental)?; and 2. If the voter did not cast a sincere ballot, what did she do? In section IV we compare the theoretical output predicted by our models with the output observed in the simulation for each voting rule. Finally, we conclude.
I. The simulation
A. Environment
The simulation design sought to exploit the natural pre-electoral environment in Colombia during May of 2010. The Colombian voting rule for Presidency in 2010 was a majority runoff election. While the official national presidential election began on May 30th, when the first round took place, we implemented the simulation between the 4th and the 15th of the same month7.
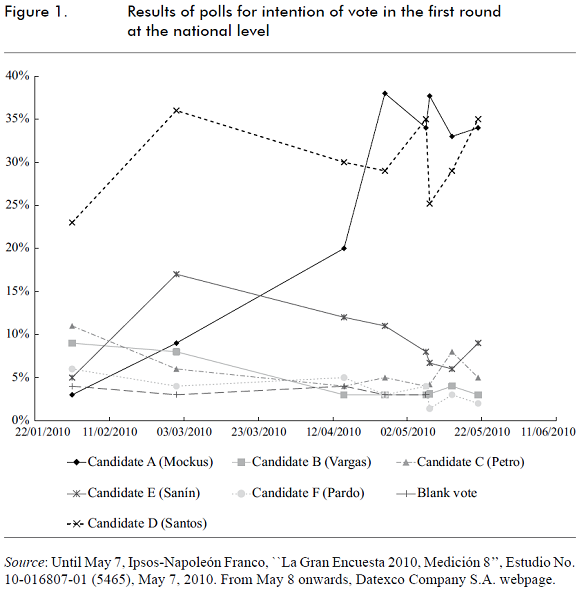
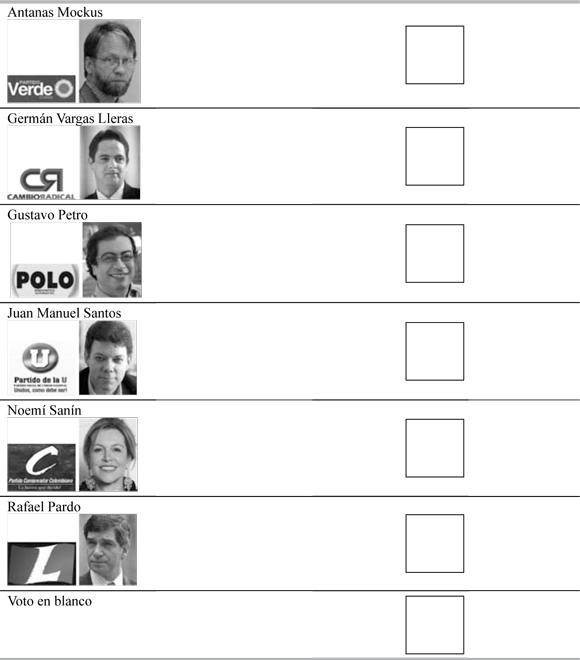
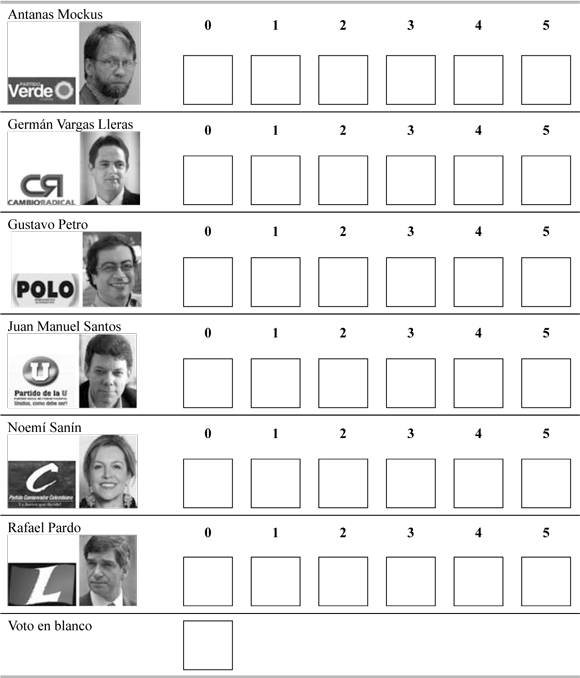
There were nine candidates, but the public opinion considered relevant only six of them8 Voters focused their attention on the following candidates (ordered alphabetically): Antanas Mockus (Candidate A), Germán Vargas (Candidate B), Gustavo Petro (Candidate C), Juan Manuel Santos (Candidate D), Noemí Sanín (Candidate E) and Rafael Pardo (Candidate F).
During the time in which we ran the simulation, the two leading candidates, A (Mockus) and D (Santos), competed in a close race during the campaign. Figure 1 shows the results of the published polls in Colombia during 2010 at a national level. Nevertheless, in the final results Santos reached a comfortable victory over Mockus: 46,67% vs. 21,51% in the first round, and 69,13% vs. 27,47% in the second round.
B. Recruitment and treatment
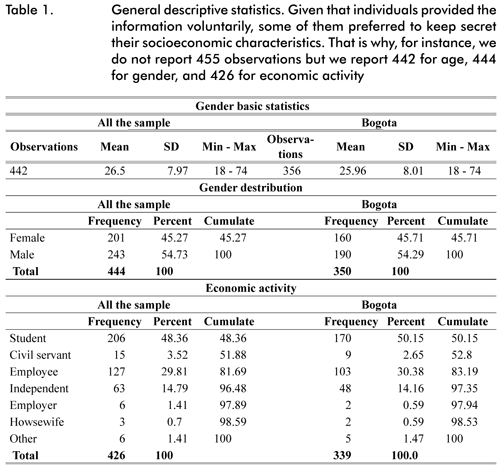
544 subjects participated in the simulation through the Internet and there were 455 valid respondents -i.e. 455 individuals out of 544 reported a complete vector of payoffs (preferences) and casted ballots correctly under the four voting rules. We sent a personal message via electronic mail to individuals over 18 years, which is the legal age to vote in Colombia9. In the message we asked individuals to voluntarily participate in a simulation related to the presidential elections, but we did not provide any additional information about the exercise. Individuals interested in participating followed a link attached to the message which gave them access to a form, where each voting rule was briefly but clearly explained. Table 1 presents a brief description of the characteristics of the sample considering only valid questioners (more statistics are presented in appendix 1).
The form was designed to simulate ballots for the four voting rules: plurality rule (PR), approval voting (AV), Borda rule (BR) and majority runoff rule (MR). In the form participants were asked to cast votes under each voting rule for the six real candidates, which were listed alphabetically to avoid ordering effects on individual behavior [2]. Afterwards, subjects were asked to report their preferences over the set of options: following the scale used by 93myersonweber, we asked them to report a number between 0 and 10 according to the level of satisfaction that they would get if candidate i were elected. Therefore, our setting relies on the assumption that preferences depend only on the electoral outcome. Finally, we asked them to report voluntarily their socioeconomic characteristics. The original form (in Spanish) can be found in appendix 210.
Notice that in order to exploit the natural environment we did not induce individuals' preferences over the set of six candidates. Furthermore, we did not provide information about other voters' preferences and we allowed individuals to behave according to their real beliefs. Later, in section II, we make assumptions on how individuals form their beliefs in order to model instrumental behavior.
Even though the form was electronically distributed mainly in three cities -Bogota, Cartagena and Cali- we received filled questionnaires from other 51 cities. However, 456 observations (80.54%) came from Bogota and the rest were almost uniformly distributed among the remaining cities. Hence, our sample is not random nor representative and it is biased toward candidate A, who was mayor of Bogota11. In section II, as we study individual behavior and the bias toward one specific outcome is meaningless for the purposes of the study, we include all the voters (455) who submitted ballots correctly.
II. Individual behavior
In order to determine how the voters' behavior is affected by the voting rule, we modeled two behavioral benchmarks that we compared with the observed behavior. Now we introduce the foundations of our models in order to define each benchmark.
In our setting, individuals are heterogeneous and they differ in their preferences. Voters' preferences are modeled as the payoffs that they would obtain under each electoral outcome. We assume that there is a space Ω ⊂ ℜ6+ of individuals' types. Each element un = (unA,...unF) in Ω is a vector that contains the payoffs that an individual of type n would get if each candidate were elected. Thus, uin is the payoff that the voter of type n would get if candidate i ∈ Λ were elected, where Λ = {A,B,C,D,E,F} is the set of candidates. Following Myerson and Weber (1993), we assume that payoffs are integers in the interval [0,10].
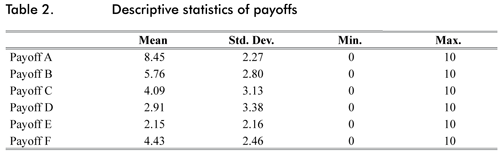
From the data we collected in the simulation we found 445 types of individuals in the reported payoffs. In table 2 we report basic statistics for these payoffs.
Let Vrn be the set of possible ballots that the individual of type n may submit under the voting rule r, where r = PR, AV, BR, MR. Then, a ballot vnr = (vnA,r,...,vnF,r) in the set Vrn contains the number of votes that one individual of type n assigns to each candidate under the voting rule r when she casts vnr. For instance, under PR individuals may cast only one vote for one candidate, or may cast no votes (case in which they cast a blank vote). Consequently, the cardinality of the set VnPR is 7, as all the possible ballots that individual of type n may cast are: (1,0,0,0,0,0), (0,1,0,0,0,0), (0,0,1,0,0,0), (0,0,0,1,0,0), (0,0,0,0,1,0), (0,0,0,0,0,1), and (0,0,0,0,0,0). Notice, of course, that the set Vrn is identical for all types of individuals, so in order to save notation we henceforth drop the index n.
A. Sincere voting
In the first benchmark, for each individual and for every voting rule, we construct a set Vrs ⊂ Vr made up of vectors vrs = (vsA,r,...,vsF,r), each one of them having as elements the number of votes that individual of type un assigns to each candidate whenever she votes sincerely. Thus, vrs is a sincere ballot if the number of votes assigned to candidate i, vsi,r is a sincere vote for all i = A,...,F. For all the voting rules, the blank vote, vr0 = (0,0,0,0,0,0), is sincere if the voter reports a vector of payoffs equal to u0 = (0,0,0,0,0,0). We now define sincere ballot for each voting rule.
1. Sincere voting under plurality rule
Under PR individuals are allowed to submit a ballot in which they can either cast a vote for only one candidate or cast a blank vote. Therefore, a valid ballot under PR is a ballot vPR such that either vi,PR = 1 for only one i, and vj,PR = 0 for every j ≠ i whenever the subject votes for one candidate; or vi,PR = 0 for every i whenever she submits the blank vote. The winner of the elections is the candidate that gets the highest score in the first and unique round.
Let Γ = {i ∈ Λ :  = max { uA,...,uF}} be the set of most preferred candidates. A submitted valid ballot is sincere under PR if the only possible vote is casted for any of the favorite candidates in Γ, or if the blank vote is casted only when the individual is of type u0. Formally,
Definition 1 A ballot vsPR ∈ VPR is sincere if and only if is valid and either
• vsi,PR; = 1 for one i ∈ Γ when
•
Therefore, when a voter is indifferent between two or more of her most preferred candidates, any valid ballot is sincere whenever she allocates the only available vote to any of her top candidates. Moreover, when the voter is of type u0, any valid ballot is sincere because she is indifferent between all candidates.
2. Sincere voting under approval voting
Under approval voting, individuals may cast one vote at the most for each candidate, and they can vote for as many candidates as they wish. The winner of the elections is the candidate who gets the highest score in the first and unique round. Then, a valid ballot under AV is such that, for all i, vi,AV.
For this voting rule we use two definitions. In both cases we assume that a voter casts a vote for a candidate only if the associated payoff is higher than certain threshold. In other words, we assume that when a payoff reported for a candidate is higher or equal than the threshold, the voter perceives the candidate as acceptable; in that case, the voter should allocate one vote to her or him. Otherwise, no vote should be allocated. Our two definitions are different in the value of the threshold.
In the first case, in a sincere ballot a voter must cast one vote for each candidate with an associated payoff of at least 6. Otherwise, the voter should not approve the candidate12.
The threshold of the second definition is the mean of the reported payoffs (4.6322). Given that we use integer numbers, we assume that an individual approves a candidate if his or her associated payoff is at least 5.
Consequently, when individuals are of type u0, we assume that they do not approve any candidate. Thus, for these individuals we only regard as sincere the blank vote. Formally,
Definition 2 Let α be the threshold of approval. A ballot vsAV ∈ VAV is sincere if and only if is valid and
• vsi,AV = 1 if ui ≥ α, and
• vi,AV = 0 otherwise.
As we will see in section III.A, the results for sincere voting under approval rule are highly sensitive to the value of α. In fact, we also used thresholds of one and two standard deviations below and above 4.6322 and we confirmed this sensitiveness. However, we suspect that individual behavior is more determined by our first assumption. For that reason we only report results for the two cases above.
3. Sincere voting under Borda rule
Under BR, individuals have to cast a ballot in which they allocate to each candidate either five, four, three, two or zero votes, but they cannot allocate the same number of votes to two different candidates. Hence, a voter submits a valid ballot under BR when she casts vi,BR ∈ {0,...,5} and vi,BR ≠ vj,BR, or when she cast a blank vote. The winner is the candidate with the highest score in the first and only round.
In a sincere ballot under BR the voter allocates the available votes in a magnitude consistent with her reported preferences. For instance, a voter who presents the following order of preferences: A  B C D E F must cast the ballot vsBR = (5,4,3,2,1,0). If the individual is indifferent between two or more candidates, any ballot which respects the order of preferences is sincere. Moreover, if a voter reports equal and positive payoffs for all candidates, any ballot is sincere (even a blank vote). On the contrary, whenever > 0 and > uj for at least one j, the blank vote is insincere. Formally,
Definition 3 A ballot vsBR ∈ VBR is sincere if and only if it is valid and
• vsh,PR > vsi,PR > vsj,PR > vsk,PR > vsl,PR > vsm,BR if uh ≥ ui ≥ uj ≥ uk ≥ ul ≥ um; or
• vsi,BR = 0 for all i if uh = ui = uj = uk = ul = um.
4. Sincere voting under majority runoff
In MR elections, each voter may cast either only one vote for one candidate or a blank vote. The winner of the elections is the candidate who gets a score higher than 50%. If there is no winner in the first round, the two candidates who obtained the higher scores compete in a second round under the same winning rules.
In this case, the rule used to define sincere vote is identical to the one used under PR (see definition 1).
B. Instrumental voting
In this section we build our second benchmark based on Myerson and Weber's (1993) model. Under that setting rational individuals with preferences over the set of outcomes maximize their expected utility according to their beliefs about others' preferences, which are derived from the perceptions about the pre-electoral polls.
A key assumption of this model is that, for each individual, her vote influences her payoff only if it may change the winner of the election. In short, when deciding the number of votes to allocate between two candidates, a voter perceives that the more votes she allocates to one of the candidates the more likely it is that the outcome changes in favor of that candidate. Likewise, this perception is proportional to the probability of a tie in the first place between the two candidates: the less likely it is that the two candidates compete for the first place, the less probable it is that the vote influences her payoff. In other words, when individuals make their decisions for each pair of candidates, they compare the expected changes in their payoffs when they change the number of votes that they allocate to one candidate against the other, and such changes must be weighted by the probability of a tie between them. For an individual of type n this logic is summarized by the utility function of submitting the ballot vr under the voting rule r:

where H is the set of all possible pairs ij. Thus, for a given vector of probabilities p, a voter decides her vote by choosing a ballot from Vr that maximizes equation 1. Notice that the set of maximizing ballots is not necessary made up of one element.
According to the above rationale, a keystone to predict individual decisions under 93myersonweber model is the knowledge about the probabilities of tie in the first place between all pairs of candidates. To simplify the problem, the authors assume that this information comes from the knowledge about the distribution of types in the electorate. More precisely, given that voters are rational, when they observe the results (each candidate's score) of a pre-electoral poll, and assuming that they know the distribution of types in the society, they are able to infer the probabilities that support the observed scores. This is because polls are in fact an equilibrium in which all voters maximize their utility.
Technically, for a given score publicly known, the set of all possible expected payoffs from all voters that may justify that score, forms a system of simultaneous equations where the probabilities of tie are the unknowns. The solution to this system provides the set of probabilities of tie, which in turn justifies the equilibria observed in the poll.
In our data we have 445 types of individuals. We also have the results of the national pre-electoral polls in Colombia during May of 2010. However, we do not know the distribution of types that justify the observed scores, so we cannot find the probabilities of tie from the available information. Even if we neglect the importance of our bias in the sample toward candidate A, and if we assume that our sample is representative and that from it we can use the observed distribution of types, we would end up with a system of around 3100 equations in the easiest cases (PR and MR) and with around 327600 in the case of BR. Moreover, considering that there may be multiple equilibria, finding the probabilities of tie relying on this assumption would be quite cumbersome.
In order to solve this problem, we propose a functional form for the probabilities of tie in the first place13. This function considers the scores reported in the polls and hence encompasses the beliefs of individuals about other voters' actions14.
Let  be the highest score reported in the polls and dij =| Si - Sj | the distance between the published scores for candidates i and j, where Si is the score of candidate i and Sj the score of candidate j. The probability of a tie between candidates i and j is given by:
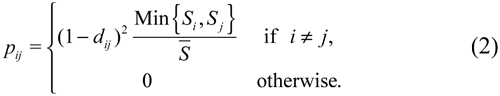
The first term of this equation, (1 - dij )2, captures the voters' perception of a tie between candidates i and j. Notice that the higher the distance between their scores, the lower the probability of tie among the two candidates. We add convexity in this term to model the intuition that the perception of tie becomes even lower for greater distances. The second term in equation (2),  , captures how viable is for the voter that the candidates compete for the first place. For example, if we want to compute the probability of a in the first place between candidates A and B, given that candidate B is far away from the first score (according to the last published poll), such probability must decrease. Thus, the probability of tying in the first place decreases with the highest reported score.
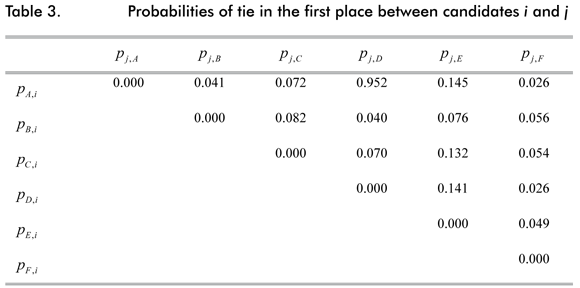
In table 3 we report the probabilities of tie in the first place obtained according to the information provided by the last poll published in the media on May 22, 2010 (see figure 1)15.
With this probabilities we computed the set of all possible expected payoffs for every ballot in Vr for each voting rule and for each individual. Once obtained the whole set of expected payoffs we took the ballots that maximize utility and we built the set of optimal ballots Vr* under each system. For instance, under BR, we computed 327600 expected payoffs (720 for each individual) and we chose among them the set of ballots that maximizes all voter's utility. A ballot belonging to this set is called instrumental ballot, which in turn is optimal.
Let us highlight and discuss two implications of our benchmark. First, an equilibrium under Myerson and Weber's (1993) model may be multiple: the vector of probabilities in equilibrium may not be unique. Therefore, given that we are fixing the probabilities with equation 2, we may be analyzing only one potential equilibrium. This must be considered when interpreting our results.
Second, the key assumption of this approach is that voters behave under each voting rule having in mind the same probabilities of tie. The scores published in the polls arise from asking individuals to suppose they are voting under an MR system, so the perceptions of ties are dependent on these scores. However, the way of counting votes differs across rules and this affects each candidate's score. In other words, an ideal scenario is one in which we could use a particular vector of probabilities for each voting rule. Therefore, the results of instrumental behavior presented in the following section must be interpreted having this point in mind.
In spite of our limitations, at this point it is of vital importance to recall our main objective. We do not want to test the model of Myerson and Weber. Instead, in order to evaluate individual behavior, we build a benchmark where individuals behave instrumentally (optimizing), and the predictions of this benchmark are compared with the observed results.
III. Results for individual behavior
In this section we compare the observed behavior with the theoretical behavior under each benchmark. In particular, we count the number of submitted ballots that satisfy sincere, instrumental, both or none of the theoretical predictions (i.e. we check for each voting rule whether the submitted ballot belongs to either Vrs or Vr*). Likewise, in the case of sincere behavior we try to find out what was the alternative action carried out by individuals when they did not cast sincere ballots.
A. Results for sincere voting
Table 4 compares the level of sincerity observed under each rule. We observe that the system in which individuals behave more sincerely is PR. On the contrary, behavior under AV is less sincere. The results for AV reported in table 4 are those obtained when the threshold level (α) is 6. When we use the second definition of approval voting (α = 5) the percentage of sincere ballots decreases to around 25 (116 sincere votes). We discuss this issue in detail further on.
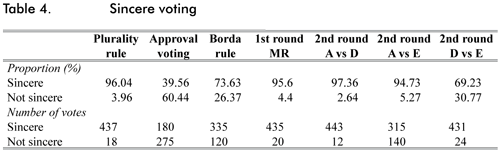
In general, the level of sincerity decreases with the number of candidates for which individuals are allowed to cast votes. However, this pattern is not present when candidates D and E are faced in a second round under MR. In that scenario, we observe that most individuals casted blank votes instead of casting votes for any of the two contesting candidates, even when these have a positive associated payoff. We will come back to this point by the end of the section.
Now we describe what individuals did when they did not cast sincere ballots.
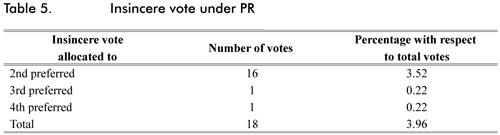
In table 5 we present the alternative choices that voters made when they did not show a sincere behavior under PR. We observe that individuals who did not vote sincerely, mainly voted for their second preferred candidate. We observed this behavior especially when the first preferred candidate is candidate B and the second one is candidate A. Then, the insincere vote may be associated to the fact that voters perceived B's probability of winning too low, and, in order to avoid a less preferred candidate to win, they chose their second best option. Two more voters casted a vote for their third and forth option respectively, but in this case we suspect that they made a mistake.
For both definitions of AV, table 6 shows the number of sincere votes casted to each candidate. Notice that here a sincere vote does not imply a sincere ballot, and despite the fact that we observe a high level of sincerity for each candidate, in table 4 we observe a low level of sincere ballots. This is because our definition of sincere ballot is strong and requires every vote to be sincere. By looking in detail to the data, most ballots do not satisfy our definitions of sincerity because the votes submitted to candidates ordered in the middle of the preference rank tend to be insincere. Voters seem to have clear that they must approve their favorite candidate and reject their worst option, but when they have to allocate their votes to the candidates of the middle they may be insincere. This helps explain two issues: first, the lower level of sincerity for candidates B, C and F, which are the middle-preferred candidates according to our sample (see table 2); and second, the fact that our results are highly sensitive to the threshold used.
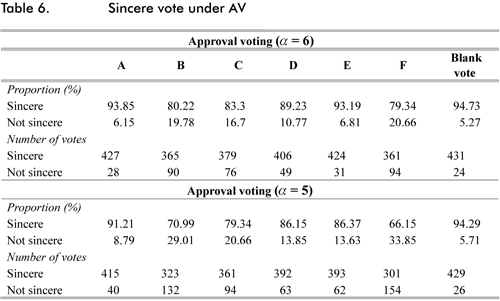
In order to check the sensitivity to our thresholds, we also used α = 4 and α = 7. We observe that the number of sincere votes increases with α, but what is more interesting is that the absolute variation in the number of insincere votes is higher for the middle-preferred candidates. Top and worst candidates are approved and disapproved in a more sincere manner, respectively. This is because they are ranked in the extremes of the ordinal preferences, so the number of sincere votes allocated to them does not change dramatically when we change α. However, the amount of sincere votes allocated to candidates in the middle is highly affected when α changes. This observation may confirm that there is a threshold of acceptance, and perhaps it is not common among individuals, but we suspect that its average may take values around 5 where the variations are more sharp. We present this observations in table 7.
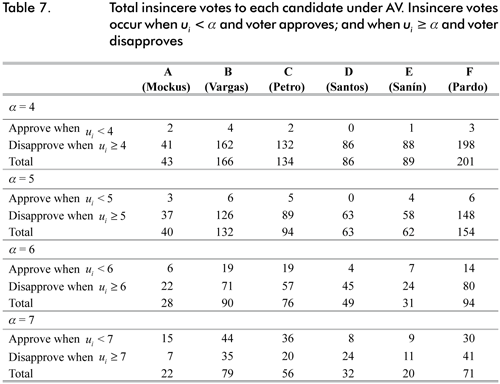
A complementary interpretation of tables 6 and 7 is that voters may use middle candidates strategically. This is a consequence of the change in the manner that votes are counted under this rule, which in turn changes the probabilities of tie perceived by the electorate. For instance, when a voter observes that her favorite candidate has chances of winning, she can disapprove middle candidates insincerely to increase her chances of winning. This effect may be reinforced if individuals know that middle candidates have a significant level of acceptance among the electorate. In other words, if they know that middle candidates may play a role of consensus candidates, voters can anticipate others' actions to realize that a high number of approved votes for these candidates may put on risk the victory of their most preferred one. This interpretation is consistent with the relatively high number of disapprovals for middle candidates observed in table 7.
The results presented in table 8 for BR are similar. Each column corresponds to the number of individuals that allocated 0, 1, 2, 3, 4 or 5 votes insincerely. Each row shows the candidate's ranking in the preferences from whom the insincere vote was allocated. For example, the value in the first cell means that 3 individuals casted 0 votes for their most preferred candidate when they instead should have casted 5 votes to him or her. Similarly, 1 individual gave 0 votes to his or her second preferred candidate when he or she should have casted 4 votes. 14 subjects gave 0 votes to their third preferred candidate when they should have casted 3 votes, and so on. Consequently, 63 individuals voted insincerely when they allocated the lowest possible number of votes (0) under BR. Notice that, similarly to the results presented in table 6, these results show sincere votes instead of sincere ballots, so one individual might be repeated across columns.
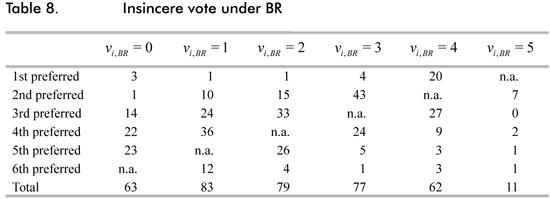
In general, we observe a similar pattern to the one observed in the case of AV: more sincere votes are allocated to the candidates of the extremes, especially to the favorite candidate. By contrast, when individuals allocate votes to the middle candidates, they tend to disregard the order of their preferences.
In the case of MR, the results are identical to the results of PR. Then, the values presented on table 5 are analogous for this case.
In the second round we observe a high percentage of sincere ballots when candidate A is part of the contest. Nevertheless, individuals casted a higher number of insincere ballots when D and E were confronted in the second round (see table 4). Indeed, they submitted a large number of votes in blank. One interpretation that may explain the low level of sincerity observed in this scenario is the following: notice that candidates D and E are the less supported by our sample; the average payoff reported by D is 2,91 and by E is 2,16 (see table 2). Notice as well that the most preferred candidate of the sample is not present anymore. This may suggest that negative perceptions about less preferred candidates may increase when preferred candidates leave the contest. In such case either of the following two effects may take place: preferences may be altered or voters punish the result of the first round.
If preferences got altered, our results are overestimating the number of insincere ballots and we should recover again a vector of preferences with only two candidates. On the other hand, if preferences remain unchanged, our results capture the effect of nonconformity embodied in the insincere ballots: if the worst candidates beat the best ones in the first round, the blank vote may represent a way to show nonconformity.
B. Results for instrumental behavior
Table 9 presents the general results for instrumental behavior.
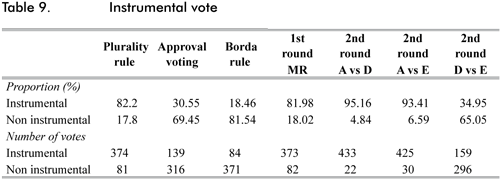
Table 9 reveals an interesting fact: If the proposed probabilities are consistent with the theory of voting equilibria, then, even if the rational model predicts relatively well the outcomes under both AV and BR (see table 11 in section IV), it fails to explain individual behavior. Likewise, the model explains relatively well individual behavior under PR and MR elections in the first round.
This fact is consistent with Blais et al.'s (2009) results: Given that under PR and BR individuals are allowed to submit votes for a higher number of candidates, a rational behavior might demand from voters a more difficult number of computations. In such cases voters can behave in an more heuristic manner in order to avoid such complicated calculations (Blais et al., 2009).
In order to summarize the results, the last exercise we performed consists on crossing the information to check if the behavior was sincere, instrumental, both or none. Table 11 shows the results.
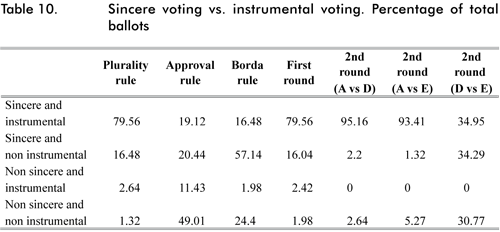
A considerable share of ballots casted under AV and BR corresponds to a behavior which is not instrumental nor sincere. When inspecting in detail observation by observation, a consistent story with this results arises:
Given the nature of the sample, it is possible that under AV and BR an important share of individuals behaved strategically to reduce the probability of a tie for first place between their favorite candidate (A) and his most threatening competitor (D). Even if other candidates have lower associated payoffs than the payoff of candidate D, strategic voters allocate a larger number of votes to the former, preferable to those with small chances of winning. This occurs in spite of a reduction in the expected utility. Therefore, strategic ballots submitted by this group are both not sincere because they rank better (or approve more) middle candidates regardless of their preferences, and not instrumental because with their action they seek to reduce the probability of tie in favor of candidate A16.
IV. Aggregate outcomes
The results of the electoral outcome when comparing the observed data with each benchmark are presented in the table 11. Under each column labeled as textit{Sincere and textit{Instrumental we present the theoretical results that we could obtain in case that all individuals behaved either sincerely or instrumentally.
Under all voting rules, the electoral outcome does not seem to vary significantly across both observed data and sincere behavior. Thus, aggregate predictions of the sincere benchmark seem more accurate than the predictions of the instrumental model, given that the latter performs well only under AV and BR.
Not surprisingly, under all the results we observe that candidate A (Mockus) wins the elections in our setting. If individuals behaved instrumentally, his score would increase in more than 13 points under PR and under MR. If subjects behaved sincerely, his score would remain around the same level except in the case of AV, where his score decreases in more than 5 points. On the other hand, if we focus our attention on PR and MR, we observe that candidate B (Vargas) would be better off as long as individuals voted sincerely and not instrumentally. In contrast, under the same voting rules, candidate D (Santos) is better scored under the instrumental predictions. This is due to the fact that he is well positioned in the polls, so the high probability of a tie in the first place with other candidates increases the expected utility of casting votes in his favor. Indeed, there seems to be a reallocation of votes from irrelevant candidates to him.
Results in table 11 are consistent with previous results. Under AV and BR, middle-preferred candidates are favored (Myerson and Weber, 1993; Forsythe et al., 1993; Forsythe et al., 1996). We observe that candidates B, C and F improve their scores under these two voting rules. In particular, candidate F passes from the fifth position under PR and MR to the third position under BR. Candidate C rises from the forth place under PR and MR to the third place under AV. And Candidate B, who is placed third under PR, rises to the second position under both AV and BR.
On the other hand, candidate E, who is the least preferred candidate in the sample, remains in the last place under all the voting rules.
V. Concluding remarks
In this paper we report the results of a simulation implemented in May of 2010, when the presidential elections took place in Colombia. We conducted this simulation in order to study individual behavior and aggregate outcomes under four different voting rules.
Our two models do not adequately explain individual behavior under AV and BR, even when the outcome can be reasonably predicted. In the case of sincere voting, individuals vote sincerely mainly for the candidates ordered in the extremes of their preferences. However, they vote insincerely for the candidates of the middle.
In the case of instrumental voting, this observation might be associated with two facts. First, such behavior can reflect a heuristic reasoning which arises when the complexity of the voting rule demands difficult calculations from voters. Second, voters may behave strategically in order to prevent threatening candidates from beating their favorite one. In that case, in order to increase their favorite candidate's probability of winning, individuals may allocate votes to candidates with lower payoffs rather than to the threatening candidate, even when the expected utility decreases.
Contrary to AV and BR, instrumental voting predominates among voters under PR and MR with runoff elections. However, the rational choice theory does not predict well electoral outcomes for these two rules.
In general, we observe that our model of sincere voting predicts better the aggregate outcome.
FOOT NOTES
1 See Austen-Smith and Banks (1996) for a discussion about Condorcet's theorem.
2 Arrow's (1952) theorem is constituted as the main result in this line.
3 Cited in Myerson and Weber (1993).
4 Under pluralism there is only one round and the winner is the candidate that obtains the highest number of votes. If there is a tie, under our example, the winner is chosen randomly.
5 We provide formal definitions of sincere voting under each voting rule in section II.
6 Laslier and Van der Straeten (2008) conducted their experiment in two towns, Gy les Nonains and Orsay, and they installed experimental voting posts in the vicinity of the official voting posts. Though we tried to implement a very similar setting, we did not get authorization from the Colombian authorities. For that reason we implemented the experiment through the Internet.
7 We also conducted a first version of the simulation by mid-April with a pilot group of 20 participants.
8 For example, the main TV channels transmitted three live debates and only these six candidates participated.
9 Individuals could forward the message if they wished. For that reason we do not report a total number of contacted citizens.
10 The form was built with the application Forms of the software Adobe Acrobat Professional. This program allowed us to distribute the form electronically and, once filled, individuals clicked on a button to submit it for the software to store it in a single comma-separated values (CSV) file.
11 329 individuals reported candidate A as their most preferred candidate.
12 This assumption seems arbitrary but can be justified with the following argument. Across generations, the Colombian education system has used a cardinal rule to mark students. Until 1997, all secondary schools marked their students with grades in the scale from 1 to 10, and one student would lose a course if she obtained a grade lower than 6. Although that system changed, all universities still use a scale ranging from 0 to 5. It is also common that a student fails a course if her grade is lower than 3. Therefore, it is reasonable to assume that the voters in our sample tend to approve a candidate as long as the payoff he represents is greater than 5. This is particularly due to the fact that our sample is made up mainly by students.
13 In the literature reviewed, there are no experiments in real large elections. Usually, groups of around 20 individuals participate in experimental elections where the distribution of types is of common knowledge (Forsythe et al., 1993; Forsythe et al., 1996; Bassi, 2008; Blais et al., 2009). Therefore, assumptions about rational behavior for experimental voters becomes much simpler than under our environment. For that reason, we did not find previous works in which the probabilities of tie were computed according to a setting of large elections.
14 The form distributed to individuals asks in question D.8 whether they saw the results of the last poll in the media. From 435 individuals that answered this question, 88. 71% of them answered "Yes". This relatively high percentage gives us a good level of confidence to apply our methodology.
15 We do not report the probabilities used for the second round in MR, but we use the second round's scores obtained from the same poll.
16 Recall that the main assumption of the instrumental model is that the probability of tie in the first place is given. Hence, individuals cast ballots attempting to affect the outcome and not such probability.
References
1. ARROW, K. (1952). Social choice and individual values. Nueva York, Wiley. [ Links ]
2. AUSTEN-SMITH, D. y BANKS, J. S. (1996). "Information aggregation, rationality, and the condorcet jury theorem", American Journal of Political Science, 90(1):34-45. [ Links ]
3. BASSI, A. (2008). Voting systems and strategic manipulation: An experimental study. NYU, Department of Politics. [ Links ]
4. BLAIS, A., LASLIER, J. F., SAUGER, N. y VAN DER STRAETEN, K. (2009). "Strategic, sincere and heuristic voting under four election rules: An experimental study" (Working Paper 559). IDEI. [ Links ]
5. FORSYTHE, R., RIETZ, T., MYERSON, R. y WEBER, R. (1993). "An experiment on coordination in multicandidate elections: The importance of polls election history", Social Choice and Welfare, 10:223-247. [ Links ]
6. FORSYTHE, R., RIETZ, T., MYERSON, R. y WEBER, R. (1996). "An experimental study of voting rules and polls in three-way elections", International Journal of Game Theory, 25:355-383. [ Links ]
7. GIBBARD, A. (1973). "Manipulation of voting schemes: A general result", Econometrica, 41(4):587-601. [ Links ]
8. LAESLIER, J. F. y VAN DER STRAETEN, K. (2008). "A Live experiment on approval voting", Experimental Economics, 11:97-105. [ Links ]
9. MYERSON, R. y WEBER, R. A. (1993). "A theory of voting equilibria", American Political Science Review, 87:102-114. [ Links ]
10. SATTERTHWAITE, M. (1975). "Strategy proofness and arrow's conditions: Existence and correspondence theorems for voting procedures and social welfare functions", Journal of Economic Theory, 10(2):187-207. [ Links ]
Appendix
1. Other characteristics of the sample
In this section we present complementary statistics of the socioeconomic characteristics in the sample. Recall that voters answered voluntarily to these questions, for that reason the number of answers do not necessary coincides with the total number of observations used in the study.
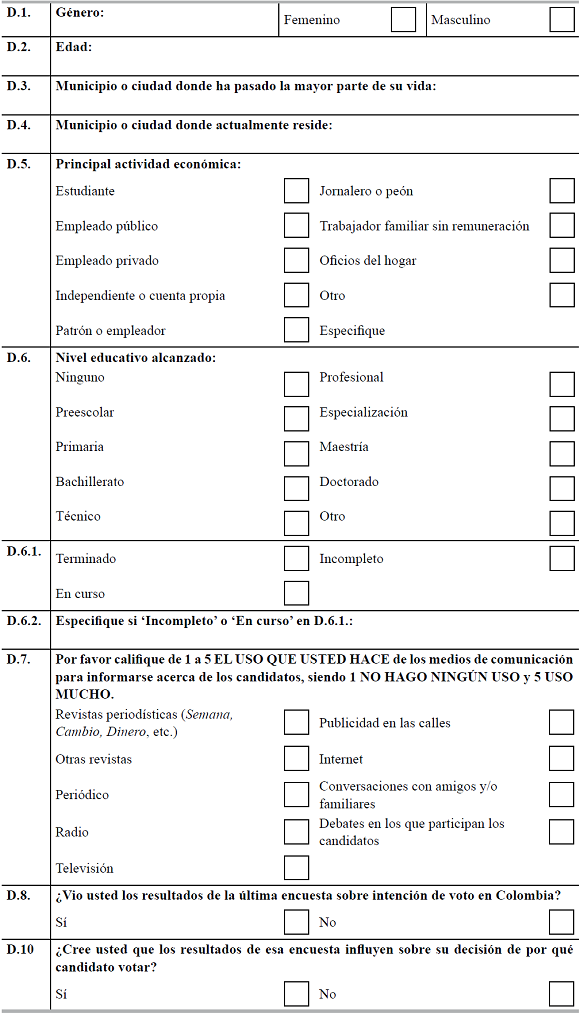
2. Questionnaire
Estudio del sistema electoral en Colombia
Toulouse School of Economics mayo de 2010
A. Indicaciones
Gracias por participar y contribuir en esta simulación. Por favor lea cuidadosamente las instrucciones.
Los resultados de esta actividad serán utilizados estrictamente para propósitos científicos y académicos. No solicitamos ninguna información que le ponga en riesgo.
En esta simulación usted no tardará más de 15 minutos. Si desea conocer los resultados de nuestro proyecto, al final de la encuesta registraremos sus datos para ponernos en contacto con usted posteriormente.
A través de esta actividad buscamos evaluar la sensibilidad de los resultados electorales bajo diferentes formas de participación ciudadana empleadas en otras democracias del mundo.
El éxito del proyecto depende de la seriedad con que usted tome esta actividad.
En adelante, por favor suponga que las elecciones presidenciales tienen lugar hoy. En esta simulación usted votará para elegir al Presidente de Colombia (y su respectiva fórmula vicepresidencial) bajo cuatro circunstancias diferentes. En cada caso, por favor suponga que el Presidente de Colombia será elegido de acuerdo con las reglas especificadas allí.
Su voto y el voto de muchos otros ciudadanos colombianos que participan de esta simulación son muy importantes para el resultado de estas elecciones hipotéticas. Sus preferencias electorales permanecerán en secreto y no serán reveladas a nadie por ningún motivo.
A continuación usted iniciará la simulación. Por favor recuerde que su voto ayudará a determinar el resultado electoral.
Por favor NO utilice el teclado para marcar sus elecciones. Utilice el ratón para marcar sus elecciones. Únicamente use el teclado cuando sea necesario introducir texto.
Al finalizar la simulación por favor envíe sus respuestas pinchando sobre el botón ENVIAR FORMA (SUBMIT FORM) ubicado en la parte superior derecha. Si experimenta problemas por favor envíe el formulario diligenciado al correo juliandpb@gmail.com.
B.1. Votación bajo regla de pluralidad
Por favor vote siguiendo las indicaciones descritas a continuación:
Bajo la regla de pluralidad usted solo puede votar por un único candidato. El único ganador de las elecciones es el candidato que obtenga el mayor número de votos en la primera y única vuelta. Por favor marque con una X el recuadro que aparece en frente del candidato por el cual usted vota.
Los candidatos aparecen en orden alfabético:
B.2. Votación bajo voto aprobatorio
Por favor vote siguiendo las indicaciones descritas a continuación:
Bajo el voto aprobatorio usted puede aprobar (votar por) tantos candidatos como usted desee. El único ganador de las elecciones es el candidato que obtenga el mayor número de votos en la primera y única vuelta. Como se mencionó arriba, usted puede votar por tantos candidatos como desee. Por favor marque con una X en frente del (los) candidato(s) por quien(es) usted vota.
Los candidatos aparecen en orden alfabético:

B.3. Votación bajo sistema Borda
Por favor vote siguiendo las indicaciones descritas a continuación:
Bajo el sistema de votación Borda, usted debe ordenar los candidatos asignando un número diferente de votos a cada uno de ellos. Dado que tenemos 6 (seis) candidatos, usted debe asignar entre 0 y 5 votos a cada candidato. Usted NO puede asignar a dos candidatos diferentes el mismo número de votos. El único ganador de las elecciones es el candidato que obtenga el mayor número de votos en la primera y única vuelta.
Los candidatos aparecen en orden alfabético:
B.4. Votación en dos vueltas
Por favor vote siguiendo las indicaciones descritas a continuación:
En este caso usted puede votar solo por un candidato. Si en la primera vuelta ningún candidato obtiene más del 50% de los votos, entonces los dos candidatos con mayor votación se enfrentan de nuevo en una segunda vuelta. El único ganador de las elecciones es el candidato que obtenga más del 50% de los votos en alguna de las dos vueltas electorales.
B.4.1. Votación en primera vuelta
Los candidatos aparecen en orden alfabético:

B.4.2. Votación en segunda vuelta
En este caso hemos seleccionado a los candidatos con mayor opción de pasar a la segunda vuelta de acuerdo con las encuestas nacionales sobre intención de voto.
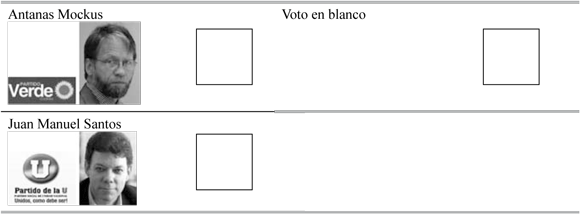
B.4.2.1. Si en la segunda vuelta se presentaran Antanas Mokus y Juan Manuel Santos, ¿por cuál de ellos usted votaría?
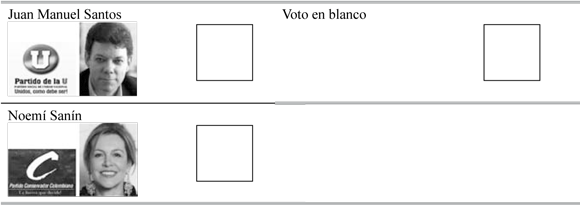
B.4.2.2. Si en la segunda vuelta se presentaran Juan Manuel Santos y Noemí Sanín, ¿por cuál de ellos usted votaría?
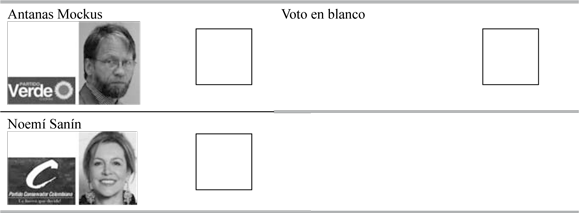
B.4.2.3. Si en la segunda vuelta se presentaran Antanas Mokus y Noemí Sanín, ¿por cuál de ellos usted votaría? No marque ninguno si su voto es en blanco.
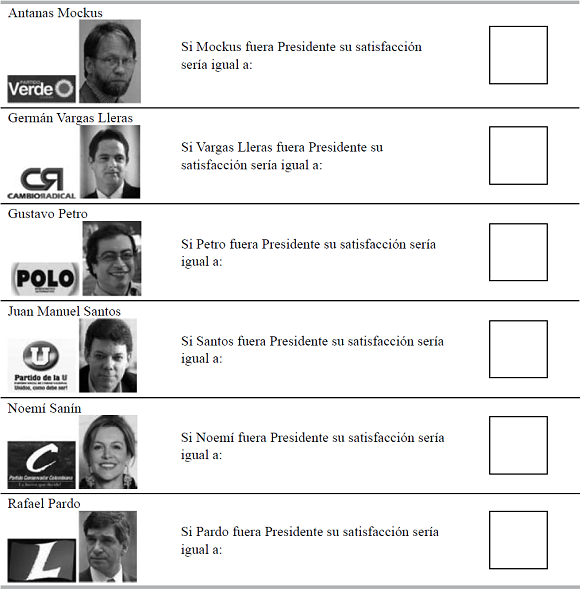
C. Preferencias
Por favor califique de 0 a 10 su grado de satisfacción si determinado candidato saliera elegido Presidente, siendo 0 el más bajo grado de satisfacción y 10 el más alto.
D. Información básica
La simulación ha terminado
Si desea mayor información sobre esta actividad por favor comuníquese con Julián David Parada (coordinador):
Correo electrónico: juliandpb@gmail.com
Teléfono: (+33) 637727018, Toulouse, Francia.
Si desea conocer los resultados de este estudio por favor escriba su nombre y su correo electrónico y más adelante le haremos llegar la información:
Nombre:
Correo electrónico:

