Services on Demand
Journal
Article
Indicators
-
 Cited by SciELO
 -
 Access statistics
Related links
-
 Cited by Google
 -
 Similars in
SciELO
 -
 Similars in Google
Share
Desarrollo y Sociedad
Print version ISSN 0120-3584
Desarro. soc. no.74 Bogotá July/Dec. 2014
https://doi.org/10.13043/DYS.74.1
DOI: 10.13043/DYS.74.1
The Efficiency of Education Expenditure in Latin America and Lessons for Colombia
La eficiencia del gasto público educativo en Latinoamérica y lecciones para Colombia
Andrés Felipe Salazar Cuéllar1
1 MSc. in Economics from Tilburg University (The Netherlands) and advisor of the Public Policy Monitoring and Evaluation Office of the National Planning Department. It is a pleasure to thanks Professor Thijs ten Raa for his comments on a previous version of this paper and to Luisa Suzunaga for her edition work. Certainly all-remaining errors are responsibility of its author. The institution is not responsible or engaged to the conclusion that here are stated, neither to the public policies that are proposed. Bogotá, Colombia. Contact e-mail: asalazar@dnp.gov.co or afsalazarc@gmail.com.
Este artículo fue recibido el 14 de abril de 2014; revisado el 10 de julio de 2014 y, finalmente, aceptado el 11 de octubre de 2014.
Abstract
This paper appraises quantitatively the efficiency of public expenditure of 15 Latin American countries using cross-country data for averages between 2000 and 2009. For this purpose two non-parametric methods are used: Data Envelopment Analysis (DEA) and Free Disposal Hull (FDH). Selected output indicators in primary and secondary school are evaluated respect to public spending in education per student. As a study case, Colombia's efficiency scores are compared with the most efficient peers in each of the educational levels to identify best practices and achieve better results.
Key words: Education, efficiency, Latin America, benchmarking.
JEL classification: H11, H52, I22.
Resumen
Este artículo evalúa cuantitativamente la eficiencia del gasto público de 15 países latinoamericanos usando datos promedio entre los años 2000 y 2009. Para este propósito se utilizan dos métodos no-paramétricos: Data Envelopment Analysis (DEA) o análisis envolvente de datos y Free Disposal Hull (FDH) o libre disponibilidad de factores. Una selección de indicadores de producto en educación primaria y secundaria es evaluada respecto al gasto público en educación por estudiante. Como caso de estudio, los puntajes de eficiencia de Colombia son comparados con los pares más eficientes en cada uno de los niveles educativos para identificar mejores prácticas y alcanzar mejores resultados.
Palabras clave: Educación, eficiencia, Latinoamérica, benchmarking.
Clasificación JEL: H11, H52, I22.
Introduction
The public intervention in education, especially at the elementary learning level, has been accepted as one of the most important public policies for the social and economic development.2 According to Mukherjee (2007) the so-called 'New Growth Theories' justify the public intervention on education because of three reasons: a) the long-term increase in the expected income of its citizens, b) higher growth of the economy, and c) lower poverty levels.
Nevertheless, the most important conclusion is that the process of improving educational outputs should be focused on strengthening the educational systems and uses the resources efficiently to reach the necessary educational level for the development of the region. In other words, the main challenge for Latin America is not just how to spend more resources in education, but also how to spend them better.
In this sense, this paper appraises quantitatively the efficiency of public expenditure of 15 Latin American countries using cross-country data for averages between 2000 and 2009. For this purpose two non-parametric methods are used: Data Envelopment Analysis (DEA) and Free Disposal Hull (FDH). Selected output indicators in primary and secondary school are evaluated respect to public spending in education per student. As a study case, Colombia's efficiency scores are compared with the most efficient peers in each of the educational levels to identify best practices and achieve better results.
Mainly, this paper answers the question: How much better could the Colombian educational system perform in primary and secondary school, given the current levels of public expenditure in the sector? The frontier analysis will help us to identify the most efficient countries on delivering educational outputs and determine the relative efficiency of Colombia and the rest of the countries.
This paper is organized in six parts as follows. The first part presents the motivation and the financing education context in Latin America. The second part shows the theoretical framework about efficiency from the Theory of the Firm and describes how to overpass some limitations on the translation of this concept to the public sector. The third part presents the methodological framework, including the formal description of DEA and FDH, the specification of the calculations, and the reasons to select the inputs and outputs variables used. The fourth part uses both methods to measure the efficiency of public expenditure for each Latin American country in primary and secondary school, complemented by an efficiency analysis of teachers per student at both levels. The fifth part evidences Colombia's position in the region and compares it with the most efficient peers to identify best practices and achieve better results. The sixth part concludes and summarizes public policies to apply in Colombia.
I. Motivation and Context of Financing Education in Latin America
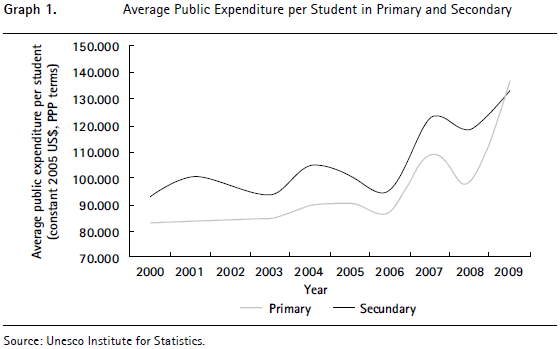
During the last decade Latin America has been characterized for an environment of economic growth, complemented by the increase of the public expenditure per student in primary and secondary school (Graph 1). Nevertheless, there are still some hurdles to be able to generate "education for all" by 20153 and create complemented policies on the provision of high quality secondary education. In this sense, the region still has on average 4.3% of illiterate youth people, 5.8% of children of official primary school age who are not enrolled in the education system, 6.2% of all the students in the last grade who do not finish the primary cycle and 38.1% of children of official secondary school age who are not enrolled; besides so many other problems in access, equity and quality.
Since Latin American governments have to make decisions on educational public policies subject to a budget constraint, one of the key issues for the governments is not just how to expand the public expenditure on education, but also how to improve the efficiency of the current resources.4 This concern has brought to the table the importance and the need to evaluate the government performance on education, specially the public expenditure, from an aggregate and international framework.5
This exercise has been made in the education sector by Afonso, Schuknecht and Tanzi (2003) and Afonso and Aubyn (2004, 2005) on the calculation of public expenditure efficiency in 25 OECD countries, by Clements (2002) for the European Union countries, by Gupta and Verhoeven (2001) in 37 African countries, by Herrera and Pang (2005) in 140 countries, and by Machado (2006) in 19 Central America and the Caribbean countries. All these studies use non-parametric techniques and measure the inputs in monetary terms. Nevertheless, we know just few about the efficiency of public spending in education in Latin America.
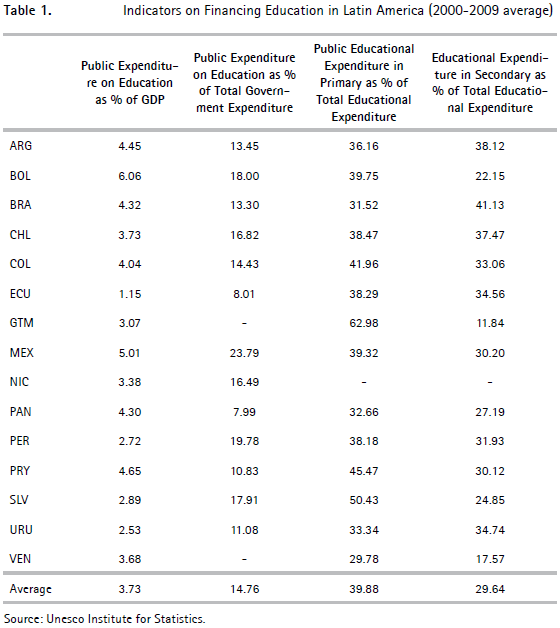
Table 1 shows that during the last decade, on average, Latin American countries finance their education with 3.7% of its GDP, which represents 14.8% of the total government expenditure. From this resource, the government allocates 39.9% in primary school and 29.6% in secondary school. Nevertheless, there are big differences on how each country finance it educational system; for example Bolivia spend 6.1% of its GDP for education, while Ecuador just spend 1.15%. If we compare this effort as percentage of the government expenditure, we find that Mexico spend 23.8% and Panama and Ecuador just 8%.
From a raw financing perspective, the region has focused its funding in achieving better results in primary education, understanding that the expansion of the education enrolment at this level is the base of the learning process and further development for the countries. Nevertheless, Argentina, Brazil and Uruguay have allocated more of their resources in secondary than in primary levels, which is a natural step for those countries that are closer to the universalization of primary school. Similar situation happens to Chile which also has implemented universalization policies at this level and keeps a balanced expenditure on primary and secondary school.
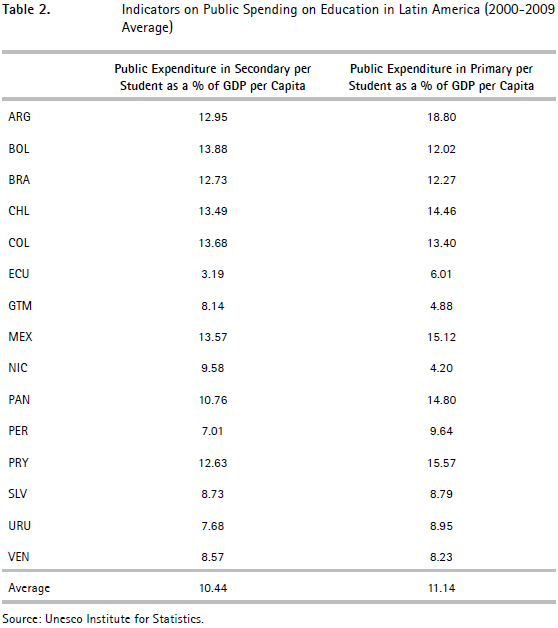
From a public spending perspective, if we express public educational expenditure per student as a percentage of GDP per capita for primary and secondary school, we can see the opposite situation than the one described before (see Table 2 and Graph 1). In this case, Latin America spends relatively more resources per student in secondary (11.1%) than in primary (10.4%). This is because secondary level has fewer students and the inputs (teachers, technology, infrastructure, etc.) are more specialized and expensive than those in primary.
The last decade has been characterized by a positive environment for economic growth and the expansion of the public expenditure in education. However the social crisis of the region and the importance of the education spending on the total public expenditure have called the attention of authorities, academics and the people, to government spending performance. In this sense, this paper appraises quantitatively the efficiency of public expenditure for each country relative to the most efficients in the region. From my knowledge and the literature review, this exercise has not been made yet for Latin America.
II. Efficiency Theoretical Framework
A. From the Efficiency Concept in the Private Sector to the Public Sector
The definition and usage of the efficiency concept is well known from the economic Theory of the Firm, but we have little knowledge about its implications to measure the government performance.
According to the basic economic theory, one of the main functions of a firm is to use a productive process in order to transform limited inputs into outputs. Similarly for the government, one of its objectives is to produce public goods and services at the lowest cost possible (due a certain budget constraint), and find mechanisms to increase its effects on the population; which also brings the importance of the effectiveness in the process.
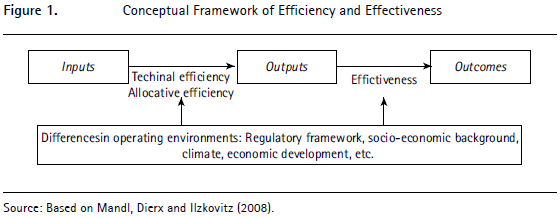
In general economic terms, productivity is defined as the ratio between outputs and inputs. Efficiency can be decompose in two ways: technical efficiency is the extent to which an agency maximizes the outputs produced from a given set of inputs or minimizes the input cost of producing a given set of outputs, and allocative efficiency is the extent to which an agency properly combines its limited inputs and/or outputs to ensure the minimal cost for the given market prices.6 Finally, the effectiveness is defined as the extent to which an agency's outputs are capable to produce a desired outcome (all definitions are based on Hughes, 2002).
Figure 1 shows schematically the relationship between inputs, outputs and outcomes. Moreover, it shows that the efficiency of the production and the effectiveness of the outcomes may be influenced by differences in operating environments such as the regulatory framework, socioeconomic conditions, climate, economic development, and any other external factor that may change the production function.
According to Nispen tot Pannerden and Klaassen (2009, p. 6) "a specific value of productivity does not say much yet [...], but only if it is related to a standard, it provides insight into the efficiency of the production process". This point of view has been applied on the measurement of the government performance because it shows that what is important is not only increasing the productivity or efficiency level, but also tries to get closer to certain standards, desired values or best practices of those peers who best use their resources.7 This method is called benchmarking and it should be understood, in this context, as a tool to determine the best usage of public resources by comparing the relative performance of an organization with its peers in order to identify "best practices", which can be implemented in those organizations that are not efficient. According to ten Raa (2009, p. 7) benchmarking "is useful because it maps the potential of a Decision Making Unit (DMU)8 quantitatively -comparing actual outputs with potential outputs- and qualitatively -by identifying the best practices" that would eliminate the gap with the potential output.
Although the benchmarking analysis is a tool that allows the government to understand the efficiency of the public sector (in our case the education sector), there are technical and methodological limitations that should be overpass in order to measure this concept.
B. Overpassing the Limitations to Measure Efficiency in the Public Sector
Extrapolate the concept and usage of efficiency from the private sector to the public sector has limitations. This theoretical challenge has brought new additional elements to understand the particularities of the production process in the sector. Nispen tot Pannerden and Klaassen (2009) explain three kinds of problems: a) technical and methodological limitations to calculate the efficiency levels, b) organizational or behavioral incentives, and c) bottlenecks regarding facilities. These problems are very important on the public administration and cannot be ignored on an implemented evaluation system for public performance. Nevertheless, just the first one will be described deeply because it is the only problem that could concern on the exercise presented in this paper.
According to Nispen tot Pannerden and Klaassen (2009) and Trillo (2002) some of the most common technical and methodological problems are:
- Identifying public outputs: The identification and comparison between public outputs (goods and services) are the main limitations mentioned in the literature about government performance evaluation. This problem is based on the fact that the government usually intervenes where markets do not exist or are incomplete, which brings problems on the identification, definition, measurement, and price determination of public goods and services.
In order to overpass this limitation, Prior, Vergés and Vilardell (1993) propose to identify a leader or dominant product that clearly shows a sign of the activity carried out by the government. In this order of ideas, a group of dominant outputs can give a closer overview of the government performance to achieve a determined public objective.9 - Identifying and differentiating the shared inputs to the corresponding outputs: Since it is hard to identify the public outputs, it is also difficult to identify the corresponding inputs. Moreover, in the public sector the relation between inputs and outputs is not always clear. This problem is reinforced by what it is called a "multi-production function nature".10 This means that the government use many shared inputs that are overlapped to produce different outputs. This characteristic also brings the problem on the determination of a specific shape of the public production function.
As we just mentioned, the first step to overpass this limitation is through the selection of the leader inputs. In this sense, most of the public performance analyses have been focused on the evaluation of public expenditure, since this is one of the main mechanisms that the government has to transform the economic and social environment. The second step is through the selection of techniques that allow us to understand the relation between inputs and outputs under the conditions described above. In this sense, we suggest the usage of non-parametric techniques (DEA and FDH) to measure technical efficiency11 (sections III.A and III.B formally explain the methods), mainly because of the following advantages:- They do not use any particular parametric cost function so other complex non-linear relationship between inputs and outputs can be found. This advantage is particularly useful because in the public sector the shape of the production function is not defined.
- They are based in a multidimensional linear program where it is possible to evaluate the relationship between multiple inputs and multiple outputs. This characteristic allows us to solve the problem of the "multi production function nature".
- They do not use market prices12 to maximize profits of the DMUs. The optimum is characterized by the weights (or accounting prices13) used in the linear program to calculate the location of the inefficient country. It avoids the problem on price determination in non-competitive markets where the government operates, but it restricts the analysis to productive efficiency.
- Inputs and outputs can have different units without assuming any a priori trade-off between them.
These techniques have also disadvantages. First, they are not able to draw conclusions about influence of external factors or factor correlations with the efficiency scores.14 Second, there are limitations to statistically test causality between inputs and outputs or the significance level of the variables, which is the main advantage of parametric models. Nevertheless, some authors as Simar and Zelenyuk (2011) have improved DEA and FDH estimators, by allowing the introduction of statistical noise and outliers. For this paper, the existence of outliers has been checked by the consistency of the time series data as suggested by Trillo (2002).
The selection of inputs, outputs, and techniques to measure technical efficiency in an international framework, opens the discussion about the sensitivity of the public policy implications suggested by the efficiency analysis. In this order of ideas, the following section presents the technical explanation of the techniques selected and the reason to use them, the public objectives in primary and secondary school that we want to evaluate, and the reasons to select the indicators (inputs and outputs) to measure them. All this in order to clarify the scope of the analysis.
III. Efficiency Analysis
In order to appraise quantitatively the efficiency of public expenditure of Latin American countries for the period between 2000 and 2009, we purpose the usage of two non-parametric methods: Data Envelopment Analysis (DEA) and Free Disposal Hull (FDH)15. The reason to use these two non-parametric techniques is because the result that we address is to find a range where it is possible for each country to increase its outputs at the same level of inputs. This is possible because the aim of DEA is to find the most efficient 'virtual peers' for each country, by assuming a convex relation that envelop the observed data (input-outputs relation), while the aim of FDH is to seek just for the most efficient peers without assuming any convex combination between them.
A. Specifications for the Efficiency Analysis
This analysis considers a group I of 15 Latin American countries.16 The government of each country i  I uses an input xi (e.g., public education spending per student) to produce educational outputs yi , that as a whole represent the educational status of the country i.
The public objective that we want to evaluate is the efficiency of the governments to achieve "education for all" at primary level, and give access to high quality secondary education.
In terms of public policy implications, we want to know how much each education system in Latin America could improve its educational outputs in primary and secondary school respect to the rest of the countries, given the current levels of public expenditure in the sector.
For this matter, this paper proposes two specifications to calculate the efficiency scores.
- Efficiency of public expenditure in primary level. This is a single-input three-outputs analysis where public education spending per student in primary school (xi

 ) is compared with the output vector (yi
 3) which is constituted by literacy rate of youth, net enrolment in primary school and the primary completion rate.
 - Efficiency of public expenditure in secondary level. This is a single-input twooutputs analysis where public education spending per student in secondary school (xi

 ) is compared with the output vector (yi
 2) which is constituted by net enrolment in secondary and the PISA average score.
It is commonly accepted that public expenditure is the most important input to expand the educational outputs. Nevertheless, input variables may include not only public expenditure per student, but also physical indicators such as teachers per student ratio, number of instruction hours, and availability of computer, among others. Of course these physical indicators are the result of public expenditure in the sector. In this order of ideas, we suggest a complementary analysis using teachers per student ratio (as a non-monetary input) instead of public expenditure in education.
The added value of this exercise is that we can pay attention on the efficiency usage of the most important non-monetary input in the learning process: teaching staff. In terms of public policy implications, we want to know how much each education system in Latin America could improve its educational outputs in primary and secondary school, given the current supply of teacher per student.
For this matter, the two specifications to calculate the efficiency scores are:
- Efficiency of teachers per student in primary level. This is a single-input three-outputs analysis where teachers per student ratio in primary school (xi

 ) is compared with the output vector (yi
 3) which is constituted by literacy rate of youth, net enrolment in primary school and the primary completion rate.
 - Efficiency of teachers per student in secondary level. This is a single-input two-outputs analysis where teachers per student ratio in secondary school (xi

 ) is compared with the output vector (yi
 2) which is constituted by net enrolment in secondary and the PISA average score.
B. Selection of Inputs and Outputs
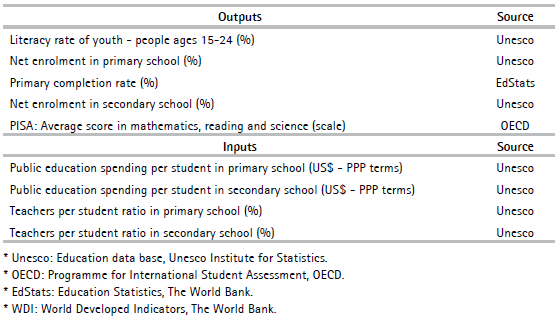
The data base is a selection of variables from the Unesco Institute of Statistics, the World Bank Education Statistics (EdStats) and the OECD Programme for International Student Assessment17 for averages between 2000 and 2009.
The following is the list of the variables and the explicit reasons to include them in the calculations.
Inputs:
- Public education spending per student (2005 US$ - PPP terms): This variable was selected to capture the governmental spending (capital investment) in the education sector. It involves the fact that the expansion of public spending will generate more educational outputs on the whole population. I agree with Gupta and Verhoeven (2001) when they state that the meaning of efficiency measures varies with the way the input is measured. This variable is measured by the annual expenditure on education per student (full-time equivalents) in US dollars (2005, constant prices) converted using Purchasing Power Parities. The input is comparable between countries and it is controlled by the size of the education system (measured by students). I avoid the usage of a common indicator such as public spending as a percentage of GDP because it shows the relative national priorities but not the public spending by itself. This is, if GDP decreases the spending ratio will increase even if the public expenditure does not change.
- Teachers per student (%): This variable was selected to capture the human capital (or non-monetary) resource allocated in education. In other words, it involves the fact that pupils can perform better by having a frequent interaction with teachers in smaller classes. Moreover, the availability of teachers also allows the expansion of education attainment and improvement of the quality.
These two inputs are split by primary and secondary levels. This differentiation is important because it allows us to have a more accurate measurement of the efficiency at each level. The usage of separate indicators is an overpass of the "level of aggregation limitation" faced by Herrera and Pang (2005), when they suggest that ideally, the inputs should be use separately in primary and secondary education (p. 11).
Outputs:
Primary
- Literacy rate of youth (%): This variable is included to evaluate the capability of the government to provide young population (15 - 24 years old) with basic reading and writing skills, which is one of the basic public policies in developing countries. This indicator is considered as a first measurement about a country's human capital. Notice that even the target population is between 15 and 24 years old, the variable is evaluated in primary school because the achievement of these skills are developed through this level. Literacy rate of adults (people ages 15 and more) is not included because the literacy level of population older than 25 years old do not depend on the resources invested during the last decade, which is the period evaluated in this paper.
- Net enrolment in primary (%): This variable is commonly used to assess the capacity of the government in achieve universal education at this level (e.g., achieve 100% in this indicator). This objective is one of the most important goals for all Latin American countries after the "World Conference on Education for All" in 1990 and the commitment with UN Millennium Development Goals on education for 2015. I do not use gross net enrolment rates because it includes over-age students and it is not an accurate indicator to measure universalization of education.
- Primary completion rate (%): This variable shows the effort of the government in keeping pupils enrolled during the whole elementary cycle and graduates them from this level. Again, this objective is also part of the UN Millennium Development Goals. Notice that this indicator includes all the students in the last grade of the primary cycle, and not just those students at the corresponding school age level.
Secondary
- Net enrolment in secondary (%): This variable is used to assess the capacity of the government in achieving universal education at this level. Although this is not a UN Millennium Development Goal for 2015, it is the second most important public policy of the developing countries to generate human capital accumulation.
- PISA (Programme for International Student Assessment) average score in mathematics, reading and science (score): This variable shows the ability of 15-years-old students to use their knowledge in real-world contexts. Although this variable has been considered as an outcome more than a governmental output, the core of the analysis is to evaluate the quality in secondary education across countries.18
IV. Efficiency Results and Analysis
As it was described before, this section presents the relative technical efficiency of public expenditure on education in the Latin American countries. As a complementary analysis, the relative technical efficiency of the available teaching staff is also presented and compared with the first one. These exercises are presented for primary and secondary education, separately. Although input and output-oriented efficiency scores are calculated and presented in the tables, the interpretations will be focused on the output-oriented results because the main core of the public sector is to determine the percentage of public services that can be increased without decreasing the inputs used. Even more, from a budgetary policy point of view the government should not try to reduce the public expenditure to achieve the same amount of output (input-oriented analysis). But it should evaluate how much more output could produce at the same level of public expenditure (output-oriented). The inputoriented scores are used just as a reference to determine the wasted resources to achieve the current educational outputs.
Finally, some general considerations related with the demographic and economic profiles of the countries in the region are going to be stated in order to have a better understanding of the results presented.
A. Education Efficiency Results in Primary School
1. Public Spending Efficiency in Primary School
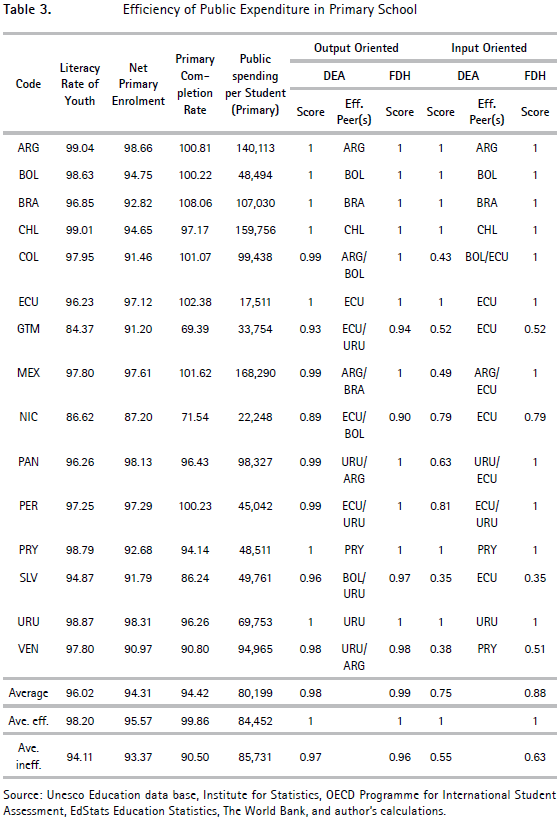
Table 3 shows the efficiency of public expenditure in primary school of each of the Latin American countries.
Notice that the results from the input and output-oriented problems are not equivalent or complementary. The reason is because they address different objectives and have different public policies implications as it was described in section III.A. From one hand, the output-oriented result shows that the inefficient countries could increase between 3 and 4% the primary output indicators with the same public spending per student at primary level. On the other hand, from an input-oriented point of view the inefficient countries in the region are wasting between 37 and 45% of its resources on achieve the current output levels.19
As it can be seen on table 4, most of the countries appear as efficient by FDH, but just Argentina, Bolivia, Brazil, Chile, Ecuador, Paraguay and Uruguay appear as efficient when DEA is used. This result is based on the fact that most of the countries have very close results on the output indicators at very close medium-input level. On the other hand Guatemala, Nicaragua, El Salvador and Venezuela do not appear as efficient in any of the methods. Specially, the three first on this group are countries with low public expenditure, so they are still in the "soft" area of the educational production function, where is possible to increase the public spending and have higher results on the educational outputs.
The efficient countries, Argentina, Chile, and Uruguay are considered leaders in the region because their early implemented policies on universalization of primary education. Particularly, Uruguay has a middle average public expenditure per student on education, and it scores a high level on the three indicators.20 On the other hand, Argentina and Chile perform a bit higher in some indicators, but spending more than twice.
The educational system in Uruguay has been recognized several times as one of the best in Latin America. Since early years it reached high levels in primary enrollment and literacy rate21, which shows the commitment of several governments in increasing the educational opportunities for the whole population. The success of the Uruguayan model is based on several public policies and reinforced by the reform made between 1995 and 1999, where the country established four guidelines to transform the sector: improvement on education quality, equity, dignity of teaching, and modernization of the education management. According to Cuadra (2000) Uruguay was one of the best countries in the enrollment rates, even comparable with industrialized countries, because of its successful policies in the universalization of primary education and semi-universalization at the pre-primary level. According to this author Uruguay, Chile and Argentina are a selected group of countries that have been above the Latin American averages on education levels since more than three decades ago.22
Brazil is an interesting case because it has one of the highest gross primary enrollment rates23 of the region, so it is easy for it to have the highest primary completion rate. At the same time Brazil has a relative high level on literacy of youth and average net enrolment at this level. This educational profile suggest that Brazil is performing well in enrolling children to primary school but it still has a large population of the age group which do not officially corresponds to the level of education, basically because of repeaters, and kids that were lately enrolled.
Finally, Bolivia, Ecuador, and Paraguay appear as efficient because they have relative low public spending in primary (all of them below the average), and achieve relative high levels on the three output selected. Particularly, Bolivia implemented an educational reform on 1995 based on an administrative decentralized system with a target on providing education on the country side areas and prioritizing the access on primary education for all the children. This commitment has placed Bolivia on a high position in literacy of youth and has increased the net enrolment rate close to other countries such as Chile. Ecuador also has an educational system with compulsory primary level, and it has been close to achieve the universalization at this level since 2006. This process has been aligned with the rise on the literacy of youth and the process to keep a low repetition rate and high completion rate of the whole level (Unesco, 2011). Finally, education in Paraguay is also compulsory and free for all the kids in primary. Although the country has achieved high results on literacy rate, it has a net enrolment rate in primary below the average of the region and very close to the average on primary completion rate. In this sense, the lowest resources used to achieve this result place it as relative efficient in the region.
2. Teachers per Student Efficiency in Primary School
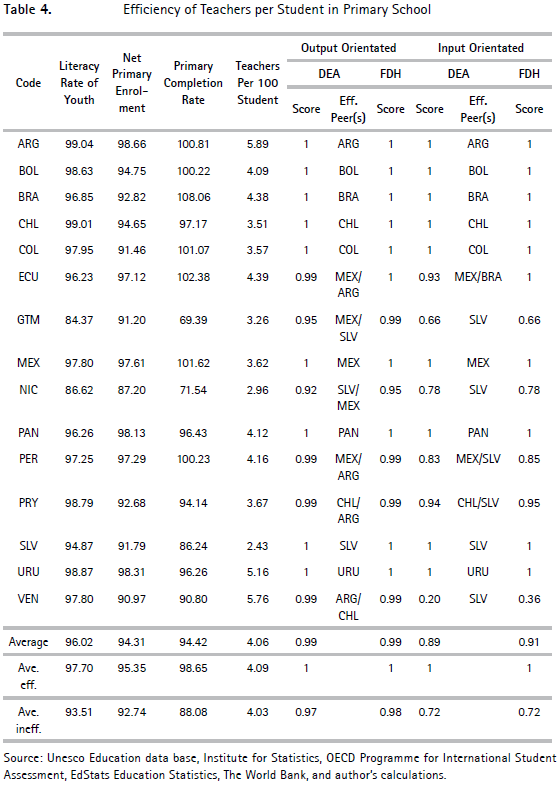
Table 4 shows the efficiency of teachers per student in primary school of each of the Latin American countries.
From an output-oriented point of view, inefficient Latin American countries, on average, could increase between 2 and 3% the primary output indicators with the same amount of teachers per student at primary level. On the other hand, from an input-oriented point of view the inefficient countries in the region are wasting 28% of its input (teachers per student) on achieving the current output levels.24
Comparing Table 4 and 5, most of the countries that are efficient using public expenditure in primary school are also part of the efficient group when teachers per student ratio is evaluated. Argentina, Bolivia, Brazil, Chile, Ecuador, and Uruguay are efficient using both inputs, separately. Nevertheless, it does not mean that it is because the two inputs are highly related; actually the correlation coefficient is positive, but weak (0.27). In this sense, the education public policies implemented in these countries have placed them as efficient using their teaching staff and the whole public expenditure in primary education, separately.
Other countries as Colombia, Mexico, Panama and El Salvador arise as efficient just when the second input variable is used. These countries have different characteristics to become efficient in the region. Colombia and Mexico are countries that are different in primary education spending, but very close in the available teaching staff at this level. This characteristic put them in a similar position with Chile, where each of them is more specialized producing a different output indicator within the three of them at the relative same level of teaching staff per student. Chile has the highest literacy rate of youth (99.01%), Colombia has the highest completion rate (101.07%), and Mexico has the highest net enrolment rate (97.61%) for the three countries.
Panama appears as efficient because it has a relatively high availability of teachers per student, and it performs better in net enrolment rate than the three countries mentioned before. This result shows that the country is getting closer to the universalization of primary education through the expansion of the teaching staff, even if it is inefficient in the usage of the whole public expenditure in primary school.
Finally, El Salvador has the lowest teachers per student rate of the region, and achieves relative low levels in the three outputs indicators. Nevertheless, it performs better than other countries such as Guatemala and Nicaragua. As it was explained before, these countries are still in the "soft area" of the education production process, where is possible to increase the inputs (public expenditure or teachers per student) and achieve better results in all the three outputs.
B. Education Efficiency Results in Secondary School
1. Public Spending Efficiency in Secondary School
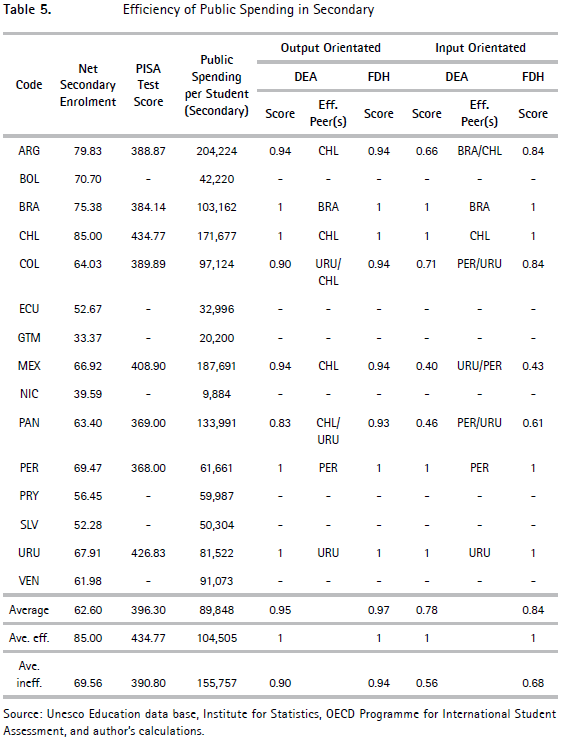
Table 5 shows the efficiency of public expenditure in secondary school of each of the Latin American countries.
Notice that in this exercise just eight countries have participated on the PISA test, so the analysis is restricted to this sub-set of countries.
From an output-oriented point of view the inefficient countries of those eight countries, on average, could increase between 6 and 10% the secondary school enrolment and the quality of it, with the same public spending per student. On the other hand, from an input-oriented point of view the inefficient countries in the region are wasting between 32 and 44% of its resources on achieving the current output levels.
Notice that Brazil, Chile, Peru and Uruguay appear as efficient using both DEA and FDH. Particularly, Chile and Uruguay have implemented policies on the universalization of primary school and obligatoriness of secondary level, which also make them focus on policies to improve the quality of the educational services.
The Chilean process to get the highest net enrolment rate in secondary school, achieves the highest quality and becomes one of the most efficient countries in the region, it is supported in several educational reforms implemented since 1980. According to Bellei (2003) during the eighties, the Military Regime implemented policies to commercialize the primary and secondary education. In this sense, the government was giving subsidies to the demand and giving incentives to schools to offer better educational services at lower costs. These policies increased the education attainment, but kept limited the quality and the teaching autonomy of the schools. The reforms from 1990 agreed on the policies implemented before to increase the efficiency of public educational resources. Nevertheless, the government focused its effort in implementing tools for monitoring, evaluating, and encouraging schools to increase enrolment, to achieve better results and to promote the school decentralization. Finally, in 2003 the government established the necessary reforms to make secondary education free and compulsory based on an educational model with bases established about materials, subjects and funding, which improved the quality at this level.
Chilean educational reform process has been focused on the need to bring learning processes of quality for all the students. According to Bellei (2003) most of the reforms were based on a deep intervention of the organizational structure, curricula, evaluation methods, external connection, and labor links. In other words, they were focused on the learning process and positive discrimination, which was possible after the universalization of primary level and obligatoriness in secondary school.
According to De Armas and Retamoso (2010) the Uruguayan education system has been recently intervened from 2000 to overpass the stagnation of the completion rates in primary and secondary. Specifically, the country has been working with UNICEF to strengthen the educational policies that allow the country to reduce the drop-out rates on secondary school and generate a high quality educational process.
Brazil appears as efficient basically because of the reform implemented on 1994 and reinforced after 2003 on the democratization of education. The main policies implemented were addressed to organize the funding of the educational system, the review of the educational law, the decentralization of the administration, and the establishment of subsidies programs as "Bolsa Escola", which is focused on providing economic help on the demand and supply side, especially to include vulnerable population to a high quality educational process.
Notice that Peru is the country that spend less in secondary school of these eight countries, and also achieve the lowest average score in the PISA test (similar score than Panama) and a high net enrolment rate (similar than Uruguay). This result is aligned with the conclusions presented by the Unesco (2011) report, where it is stated that Peru has been involved in a long process (since 1940) that has brought a constant increasing on school enrolment, but with trade-offs in other characteristics of the education system as quality and equity.
Surprisingly Argentina, which was relative efficient in primary school and has been recognized as a strong education system, is not efficient at secondary level. This result is based on the fact that the education system in secondary performs at low quality level despite the high rate of enrolment.
2. Teachers per Student Efficiency in Secondary School
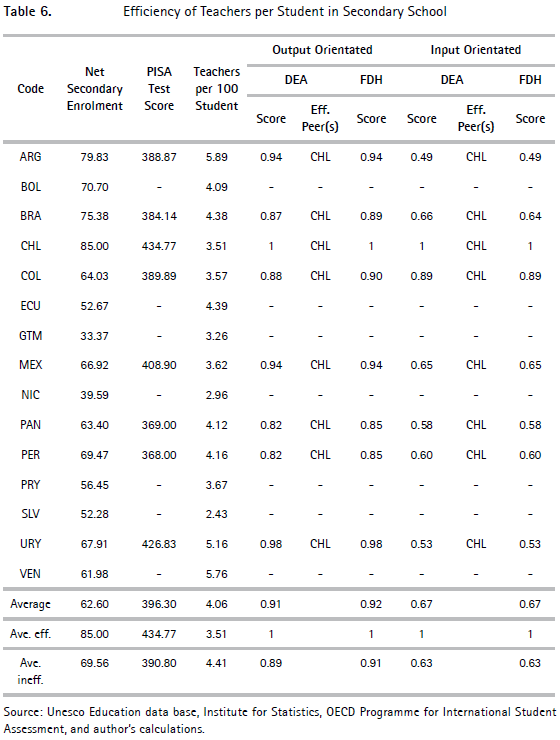
Table 6 shows the efficiency of teachers per student in secondary school of each of the Latin American countries.
From an output-oriented point of view, inefficient Latin American countries could increase between 9 and 11% the primary output indicators with the same amount of teachers per student at secondary level. On the other hand, from an input-oriented point of view the inefficient countries in the region are wasting 37% of its input (teachers per student) on achieving the current output levels.25
Chile appears as the only efficient country because it has the lowest available teaching staff per student of the eight countries, and it achieves the highest level of both output indicators. Comparing the inputs of this country in each of the calculations presented in secondary school, Chile has the third highest public expenditure, but the lowest teachers per student ratio. As it was explained before, this country implemented an educational reform in 2003 to make secondary education free and compulsory based on an educational model with bases established about materials, subjects and funding, but not necessary on the expansion of the teaching staff. In this sense, the country has kept a relative low teaching staff per student at this level, but better prepared for the teaching process.
On the other hand, Uruguay is the country that being inefficient is closer to the efficient frontier (output-oriented score: 98). The main reason is that during the so called "First Five Years of Reformist Policies" (Primer Quinquenio Reformista) -implemented since 2000- the country set the "quality of education" as a pillar in the education process. The main strategies were directed on the creation of a new curriculum and the establishment of a strong innovation at the teaching training level through the "teachers regional centers" (Cuadra, 2000). This reform was complemented with the Unicef's consultant to strengthen the secondary education cycle, reducing the drop-out rates and generating high quality educational process (De Armas and Retamoso, 2010).
These two countries are leaders on the production of high quality secondary education. Nevertheless, it does not mean that they are always efficient in the usage of each of the educational inputs, as it is the case of Uruguay. Although Brazil and Peru are not leaders at this level, it also apply that they are efficient using the public expenditure in education at this level, but they are not using their teaching staff per student.
C. General Considerations
Studying the Latin American education systems as a whole without a specific understanding of the characteristics of each country ignores the wide differences in social, demographic and economic levels within the region. According to Tadesco and Lopez (2002) the education sector in Latin America is hard to be enclosed as a whole, but it is possible to distinguish some characteristics and establish a typology according to the demographic profile and the development level of the countries.
The demographic profile -urban population and population growth- is a factor that facilitates or hinders the enrolment in each of the schooling levels and the achievement of other education outputs. Those countries with higher population in rural areas and high population growth have a harder challenge to achieve the universalization on schooling. On the other hand, the development level -measured through GDP per capita as a proxy- is related to a higher disposition from families and government to spend in educational goods and services. The interaction between these two characteristics allows us to differentiate four groups among the Latin American countries.26
Group 1: Modern demographic profile and high income. This group consists of those countries that are ranked in the top five of the three characteristics proposed. In this sense, they have a combination of high urban population, low population growth and high GDP per capita witting the region. These countries are: Argentina, Chile and Uruguay.
Group 2: Transitional demographic profile and high or medium income level. This group consists of those countries that are below the top nine in the demographic characteristics proposed and have medium-high income level. All the five countries classified in this group have a transitional demographic profile, and have medium-high income level. These countries are: Brazil, Colombia, Mexico, Panama, and Venezuela.
Group 3: Incipient demographic transition profile and medium income level. This group consists of those countries that are ranked below the nine places in a demographic characteristic and have medium level income. These countries are: Ecuador, Peru, and El Salvador.
Group 4: Traditional demographic profile and low income level. This group is made up of the four countries with the lowest income level, highest population growth and lowest concentration of their population in the cities. These countries are: Bolivia, Guatemala, Nicaragua, and Paraguay.
The selection of countries in each of the groups is based on a comparison between rankings in each of the three variable suggested. This methodology opens a discussion about the validity of including each country in its corresponding group.27 However, the objective of this exercise is to show that Latin American countries have differences and similarities that characterized some of the education achievements.
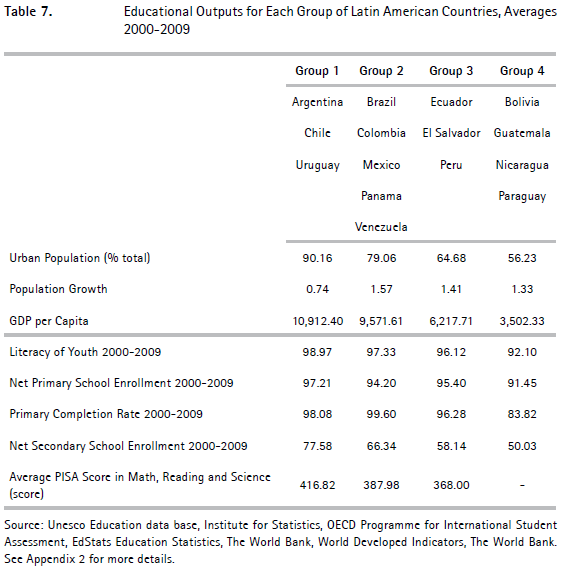
Table 7 shows the average of the five output indicators selected for each of the Latin American groups. Notice that most of the indicators decrease when one moves from group 1 to 4. However, in the specific case of net primary school enrolment the group 3 has a slightly higher rate than group 2, because Peru and Ecuador have implemented long term policies to universalize primary schooling with success, but without complete results. Meanwhile Brazil, Colombia and Venezuela are still behind to get this goal. In the case of primary completion rate group 1 is lower than group 2 because most of the countries in the second group have high gross enrolment rates that make them achieve completion rates higher than 100%.
About efficiency at these groups, notice that the members of group 1 are commonly efficient or very close to the frontier according to the analysis on the previous section. These countries have a high percentage of population living in urban areas (90.2%), a low population growth (0.74% per year) and a high income level (10,912 US$ per capita). These characteristics and their earlier commitment to the universalization of the basic educational cycle allow them to be always on the top of the education systems (see also the results of Tadesco and Lopez, 2002). On the other hand, those countries that appear as efficient in primary but can be considered as part of the "soft area" of the educational production process are part of the group 3 (Ecuador) and 4 (El Salvador and Paraguay). Bolivia is a surprising case because it has a low percentage of population living in urban areas (64%), a high population growth (1.9% per year) and a low income level (3,647 US$ per capita) but it achieve relative high levels in all the output indicators selected, which makes it become an efficient country. This result shows that even the demographical profile and the economic level can restrict the public policies on education; it is possible to achieve the goal on providing education for all the children in countries with developing economies. A more detailed analysis could be necessary to understand the conditions of providing these educational outputs in the country.
V. Lessons for Colombia
Specially using DEA, Colombia never appears as a country using the public expenditure efficiently in primary or secondary school to achieve better results on education. In other words, the country is always spending the same amount of resources than others in the region but getting lower results at both school levels. From the complementary analysis, it appears as efficient using the teaching staff per student in primary school, but not at the secondary level. In this sense, the benchmarking analysis will provide insight to analyze Colombian's position in the region through focusing the attention on the efficient peers group, selecting the best practices, and discussing some public policies that can be implemented in the country.
One of the main problems pointed on the literature about Colombian educational sector is that the education system reforms were lately implemented and the results on the education systems have been delay in several levels (MEN, 2001; Unesco, 2011). Just after the Constitution of 1991 the fundamentals principles of the education system were established, and since 1994 (General Law on Education, Ley 115/1994) the country has been implementing a specific framework to drive the development of the education future in the country.28 This lag in the law29 and therefore the commitment on the education public spending has delayed the achievement of the desired levels of education.
In terms of primary indicators of education, Colombia has mixed results. As the positive one, the country has achieved an average literacy rate of youth of 97.8% between 2000 and 2009 which is very close to the level of its most efficient peers Argentina (99%) and Bolivia (98.6%). This result is mostly achieved because of the implementation of the National Literacy Program (Programa Nacional de Alfabetización) in 2002. However, the main challenge in this field is to guarantee the basic learning skills for those kids victims of internal war or violent displacement.
On the other hand, Colombia achieves 91.5% of net enrolment rate in primary school, while its efficient peers Argentina and Bolivia have implemented policies of universalization of primary school reaching 98.6 and 94.7% respectively. This result shows that Colombia has not implemented a clear and resolute policy on universalization of the education at this level, to achieve the UN Millennium Development Goal for 2015. In this sense, Colombia should focus its effort to strengthen the educational and administrative decentralization to enroll all the kids in the country based in a rights-based policy.
Finally, 101% of the students in primary school finish the cycle in Colombia. This result is very close to its efficient peers Argentina (100.8%) and Bolivia (100.2%). Nevertheless, these results have to be carefully read, because it is not just a matter of increasing the completion rate respect to other countries in the region, but also to achieve the highest level according to the gross enrolment rate, which for Colombia is 119.2% between 2000 and 2009 due the inclusion of over-age students.
Due the close results on literacy rate of youth and primary completion rate, Colombia reports an output-orientated efficiency score of .99 (DEA), which implies that the country could raise its output levels by around 1% with the same public expenditure at this level, if it were as efficient as Argentina and Bolivia. From the complementary analysis of efficiency of teachers per student, Colombia appears as efficient because it has a relatively medium level of this input and achieves similar results than the countries named before.
About the secondary education the results show that Colombia still has a long process to work on. The net secondary school enrollment rate shows the critical situation at this level. During the period evaluated Colombia just enrolled 64% of the kids that should be in secondary school according to their age. As the comparable case, during the same period Uruguay enrolled 67.9% and Chile was able to enroll 85% on average at this level. This result is based on the fact that Colombia does not have an established policy to make the secondary education obligatory in the whole territory, because most of the monetary effort has been focused on decreasing the educational debts of the country in primary school (Tadesco and Lopez, 2002).
Moreover, this situation is reinforced with low level on achieving scores on quality tests as PISA. The country could increase its secondary outputs indicators between 6 and 10% (efficiency score of .90 with DEA and .94 with FDH) with the same input level and achieve similar results than Uruguay and Chile, which are its efficient peers. In order to keep improving the quality of the learning process in Colombia the World Bank (2008) identifies three elements to address in the quality of secondary public policy: a) keep participating in this kind of evaluations and learn from them, b) allow people in critical conditions (poverty, violent displacement, rural areas, etc.) having access to high standard schools, and c) using the physical, human and monetary resources more efficiently through evaluating the weaknesses and strengths of the schools to allocate better these resources.
Finally, it is important to recognize that the results presented here can be sensitive according to the selection of inputs and outputs. In this sense, it is important to limit the efficiency analysis to the indicators selected and do not generalize it to the whole education sector. Moreover, here we present the efficiency scores calculated by DEA and FDH to have a range where is possible for policy makers to determine how much is it possible to increase the output indicators, for a certain level of input. Although the ranges are not very large for output-oriented results, the policies implications could change if just one of them is selected.
VI. Conclusions
This paper appraises quantitatively the efficiency of public expenditure of 15 Latin American countries using cross-country data for averages between 2000 to 2009. For this purpose Data Envelopment Analysis (DEA) and Free Disposal Hull (FDH) were used to find a range where is possible for each country to increase its outputs at the same level of input (i.e., output-oriented result). Input-oriented results are also presented, but their explanation is not included in the conclusions because the question that this paper answer is addressed from a budgetary policy point of view (i.e., budget constraint) where is not possible to reduce the public expenditure for a certain level of outputs.
The following table shows the main results on the calculations for Latin America.
- The inefficient countries in the region could increase between 3 and 4% the primary outputs with the same public expenditure and between 2 and 3% with the same amount of teachers per student at primary level.
- The inefficient countries in the region could increase between 6 and 10% the secondary outputs with the same public expenditure and between 9 and 11% with the same amount of teachers per student at secondary level.
Argentina, Brazil, Chile, and Uruguay commonly appear as the countries that achieve high levels of educational outputs for a medium-high level of public expenditure on education which make them efficient (or very close to the frontier) on primary and secondary.
The success of the south cone countries (Argentina, Chile and Uruguay) is based on an early governmental disposition to alphabetize most of their population, to universalize the primary education, to increase the primary completion rate, and to make important steps on the universalization of high quality secondary education.30 All these achievements have been possible because of early implemented laws, a well-organized decentralization system (about funding and service delivery), and the government commitment with the human capital accumulation, besides their economic development and their favorable demographic profile. Brazil also appears as efficient in primary and secondary, although its demographic profile and economic development are different than the countries described before. This result is based on similar educational policies than those described, but without an explicit policy on the universalization at primary level.
Ecuador and Paraguay are countries that appear as efficient in primary but at a low input level, which put them at the "soft area" on the production of educational outputs, as well as Peru in secondary. Finally, Bolivia appears as a country with low public spending at the primary level but it achieves high outputs indicators.
As a study case, the efficiency scores of Colombia in primary and secondary were compared with the most efficient peers in the region to identify best practices and achieve better results. The following table shows the results on the calculations:
- Colombia could raise its outputs in primary school by around 1% with the same public expenditure, if it were as efficient as Uruguay and Bolivia. On the other hand, it appears as efficient when teachers per student in primary school are evaluated.
- Colombia could increase its secondary outputs indicators between 6 and 10% with the same public expenditure if it were as efficient as Uruguay and Chile. On the other hand, it could increase its secondary outputs indicators between 10 and 12% with the same amount of teachers per student in secondary school if it were as efficient as Chile.
The main problems of the country are the lag in the educational law and therefore the commitment on the education public spending to achieve the desired levels of education. These problems have set Colombia into a situation where it has been paying the past educational debts in terms of educational outputs.
Some of the main public policies that should be implemented or strengthened in Colombia in order to achieve better results and improve the efficiency of its resources are:
- To guarantee the basic learning skills for those kids victims of the internal war or violent displacement.
- To implement a clear and resolute policy on universalization the education at primary level to achieve the UN Millennium Development Goal for 2015.
- To pay attention on over-age pupils evaluating the learning process during the whole cycle to avoid drop-outs.
- To follow programs implemented in Chile and Uruguay about obligatoriness at secondary level.
- To follow the World Bank recommendations on keeping participating in cross-country quality evaluation tests and learn from them. To allow people in critical conditions (poverty, violent displacement, rural areas) having access to high standard schools and using the physical, human and monetary resources more efficiently through the evaluation of weaknesses and strengthens of the schools.
These policies should be implemented based in a rights-based policy and through the strengthening of the educational and administrative decentralization.
I suggest that further research should be focused on three ways. First, use the same methods to have a systematic analysis where efficient frontiers are calculated for different time periods to evaluate how these frontiers have been changed. Second, focus the analysis of the specific situation of Colombia. Thus, it would be possible to use both non-parametric methods to quantitatively appraise the efficiency of public expenditure in the 32 Departments in the country. Third, improve DEA and FDH calculations using environmental variables using a two-stage approach as suggested by see Coelli, Rao and Battese (1998).
_____________________________
Foot notes
2 Specifically the public expenditure is the most important mechanism that the government has to expand the educational outputs and increase the learning level of the population. However, most of the diagnoses about the education sector in Latin America agree that there is still a big gap between the ambitious desired output levels and the critical start point where the whole region is on. This gap is becoming bigger because of a lack of correspondence between the resources spent in the sector and the educational past debts, needs, and goals of all the countries (Tadesco and Lopez, 2002).
3 The goal "education for all" by 2015 was proposed by Unesco after the "World Conference on Education for All" in 1990. The main idea is that governments, educational institutions and non-governmental organizations have a commitment to provide basic education for all children, youth and adults. This commitment is the base of the United Nation Millennium Development Goal on education: "Ensure that, by 2015, children everywhere, boys and girls alike, will be able to complete a full course of primary schooling".
4 This idea is also supported by the New Public Management, which propose that the government can be more cost-efficient with a reform where the public sector is driven by market oriented policies without having negative effects on the governmental social objectives.
5 See Mukherjee (2007) for a review on aggregate public sector spending efficiency on education using cross-country data and different parametric and non-parametric techniques.
6 The distinction between technical and allocative efficiency was introduced by Farrell (1957) (see his work or Herrera and Pang (2005) for a technical explanation); however, these concepts have been in constant development. ten Raa (2008) shows the relation between Farrell's efficiency concept and Debreu's coefficient of resource utilization. He states that "the Debreu coefficient measures technical and allocative inefficiency, both in production and consumption, solving the formidable difficulty involved in assessing prices, while [...] Farrell refrains from this, restricting himself to technical efficiency and price-conditioned allocative efficiency" (p. 5). The exercise proposed in this paper stays away from this problem because it focuses on technical efficiency since this concept does not need price specifications to be calculated. Other considerations should be taken into account in order to measure allocative efficiency (see ten Raa, 2008).
7 Some other "desired levels" used in government performance analysis are: Averages, international levels, goals from local or national plans, policy targets, etc.
8 This term is used in benchmarking analysis instead of "firm" in order to include non-profit or public organizations.
9 See section III to understand the public objective that this paper wants to analyze and the selection of input and outputs to evaluate efficiency in the education sector.
10 Because of this limitation specific measurements such as Index numbers (Partial Factor Productivity and Total Factor Productivity) may be complicated to calculate depend of the sector and the public organizations selected.
11 The economic theory provides other ways to measure efficiency in the public sector. See Hughes (2002) for a review on other techniques such as Index numbers: Partial Factor Productivity (PFP) and Total Factor productivity (TFP) indexes and Parametric techniques: Ordinary Least Squares (OLS), Corrected OLS (COLS), and Stochastic Frontier Analysis (SFA). Although it is commonly shown that efficiency measument techniques are independent, ten Raa and Shestalova (2011) present a common theoretical framework that relates the Solow's aggregate production function model, Index Numbers, DEA, and the Domar aggregation approach (Input-Output analysis).
12 As it is shown by ten Raa (2009) market prices can be distorted because they may include monopoly power, trade preferences and many other non-cost based advantages, so the maximization process using market prices do not reflect performance.
13 "Accounting prices express the value of outputs in terms of costs, and leave not room for profits". Moreover, they are calculated in a hypothetical perfect competitive market and constitute the base of benchmarking analysis (ten Raa, 2009, p. 20).
14 Herrera and Pang (2005) use a censored Tobit model in order to "identify factors correlated with the inefficiency scores variation across countries". On the other hand, Afonso and Aubyn (2005) use the same technique to explain the influence of environmental variables (non-discretianary inputs) in the inefficiency scores for the OECD countries. Nevertheless, they recognize that the data limitations and the assumptions on the estimations would make this analysis sensible and possibly biased (p. 15); especially for small samples (see Coelli, Rao and Battese, 1998).
15 For a technical explanation of DEA and FDH see Appendix 1.
16 The countries evaluated are: Argentina, Bolivia, Brazil, Chile, Colombia, Ecuador, Guatemala, Mexico, Nicaragua, Panama, Paraguay, Peru, El Salvador, Uruguay, and Venezuela. Costa Rica and Honduras are not considered in the sample because of lack of information. The reason to use this set of countries is because we want to analyze the efficiency of public expenditure in education just for Latin American countries, since they share common education models (production functions) but very different output levels. Technically, non-parametric methods allow having estimation of the efficiency frontier in small samples and address conclusions about those efficient and inefficient DMUs (in this case, countries). Nevertheless, it is important to recognize that efficiency scores might be sensitive to sampling variation (Simar and Wilson, 1998) if new DMUs are more efficient than the already frontier estimated. Hence the efficiency scores assigned should not be considered as "global" relative assessment measures, but rather solely as "local" (Zervopoulos, 2012). Many authors have used non-parametric methods with small samples, such as Afonso and Aubyn (2004, 2005) for 25 OECD countries, Sutherland, Price, Joumard and Nicq (2007) for 27 OECD countries, Gupta and Verhoeven (2001) for 37 African countries, Sharma and Thomas (2008) for 22 countries, and Machado (2006) in 19 Central America and the Caribbean countries, between others.
17 The complete list of variables used in the paper, data sources and definitions can be found in Appendix 2.
18 This variable has been used in cross-country comparisons by Afonso and Aubyn (2004, 2005), Herrera and Pang (2005), and Barro and Lee (1997).
19 The input-oriented result is mainly pulled by Venezuela and El Salvador. The first country is wasting between 49 and 62% of its resources because it is spending around 1.9 times than its efficient peer Paraguay to achieve a relative similar combination of outputs. On the other hand, El Salvador is wasting 65% of its public expenditure in primary because it spends 2.8 times than its efficient peer Ecuador.
20 This result is aligned with the conclusions on Herrera and Pang (2005) where they found that Uruguay is part of the group of the most efficient countries in education attainment in a sample of 140 countries.
21 According to Cuadra (2000) since 1963 census the 90% of the population of more than 8 years old already had had basic schooling.
22 The effort of these three countries on improving the educational level has placed them on the first three positions in the Latin American HDI and on the 45th (Chile), 46th (Argentina) and 52nd (Uruguay) place on the worldwide HDI in 2010.
23 Gross enrolment rate is the ratio of total enrollment, regardless of age, to the population of the age group that officially corresponds to the level of education shown. In other words it includes overage students, mostly because of repeaters. The average gross enrolment rate in primary of Brazil is 137.4%.
24 This result is pulled by Venezuela, which is wasting between 80 and 64% of the teaching staff per student for the level of outputs in primary school achieved. Particularly, it is using 2.4 times teachers per student ratio than its peer El Salvador for a similar level of outputs. Notice that it has the second highest teachers per student ratio and it achieve relative low levels in net enrolment and primary completion rate.
25 The input-oriented result is pulled by Argentina, which has the highest teacher per student ratio and achieves the third worst PISA test score. In this case, the country could decrease its input in 51% to achieve the same level of output, if it were as efficient as Chile.
26 The name of the groups and the methodology of their clasification are based in Tadesco and Lopez (2002). Nevertheless, these authors do not use this approach to evaluate efficiency and just do it to have a general view of the educational situation in Latin America.
27 Countries as Peru have middle income level and its demographic profile is very close to the one of countries as Colombia and Venezuela, for which could be part of group 2. Tadesco and Lopez (2002) also find this problem in their classification of countries, which shows that some of them can easily pass from one group to another and change some results of the groups.
28 This law complements the Law on Superior Education (Ley 30/1992) and the Law on distribution of resources on the territories in Colombia (Ley 60/1993).
29 For a whole review on education law in Colombia, see Unesco (2011).
30 Although Argentina has implemented policies addressed to increase the quality of its educational system, it still performs below the average within the region.
31 See Coelli et al. (1998), Fried et al. (1993) or ten Raa (2009) for a whole review of the usage of other returns-to-scale in DEA.
References
1. AFONSO, A., AND AUBYN, M. ST. (2004). Non-parametric approaches to education and health: Expenditure efficiency in OECD countries. Mimeo. Technical University of Lisbon, Lisbon, Portugal. [ Links ]
2. AFONSO, A., AND AUBYN, M. ST. (2005). Cross-country efficiency of secondary education provision. A semi-parametric analysis with nondiscretionary inputs (Working Paper Series 494, June). European Central Bank. [ Links ]
3. AFONSO, A., SCHUKNECHT, L., AND TANZI, V. (2003). Public sector efficiency: An international comparison (Working Paper Series 242, July). European Central Bank. [ Links ]
4. BARRO, R. J., AND LEE, J. W. (1997). Schooling quality in a cross section of countries (Working Paper Series 6198, September). National Bureau of Economics and Research. [ Links ]
5. BELLEI, C. (2003). Reforma de la educación secundaria en Chile, 1994-2002. Document prepared for the World Bank, June. [ Links ]
6. CLEMENTS, B. (2002). "How efficient is education spending in Europe?", European Review of Economics and Finance, 1:3-26. [ Links ]
7. RAO, P., AND BATTESE, G. (1998). An introduction to efficiency and productivity analysis. Boston: Kluwer. [ Links ]
8. CUADRA, G. (2000). El sistema educativo uruguayo: estudio de diagnóstico y propuesta de políticas públicas para el sector. Banco Interamericano de Desarrollo, UR-011. Montevideo. [ Links ]
9. DE ARMAS, G., AND RETAMOSO, A. (2010). La universalización de la educación media en Uruguay. Tendencias, asignaturas pendientes y retos a futuro. Montevideo: Unicef. [ Links ]
10. FARRELL, M. J. (1957). "The measurement of productive efficiency", Journal of the Royal Statistical Society. Series A (General), 120(3):253-290. [ Links ]
11. FRIED, H., LOVELL, K., AND SCHMIDT, S. (EDS.) (1993). The measurement of productive efficiency. Techniques and applications. New York: Oxford University Press. [ Links ]
12. GUPTA, S., AND VERHOEVEN, M. (2001). "The efficiency of government expenditure, experiences from Africa", Journal of Policy Modeling, 23:433-467. [ Links ]
13. HERRERA, S., AND PANG, G. (2005). Efficiency of public spending in developing countries: An efficiency frontier approach (Working Paper 3645). World Bank Policy Research. [ Links ]
14. HUGHES, O. (2002). "Guide to the Measurement of Government Productivity", New South Wales Treasury, 5:64-77. [ Links ]
15. MACHADO, M. (2006). ¿Gastar más o gastar mejor? La eficiencia del gasto público en América Central y República Dominicana (Serie de Estudios Económicos y Sectoriales). Banco Interamericano de Desarrollo. [ Links ]
16. MINISTERIO DE EDUCACIÓN NACIONAL, MEN. (2001). Informe Nacional sobre el Desarrollo de la Educación en Colombia. 46th International Conference on Education. Geneba, September. [ Links ]
17. MANDL, U., DIERX, A., AND ILZKOVITZ, F. (2008). The effectiveness and efficiency of public spending (Economic Papers, 301). Belgium: European Commission. [ Links ]
18. MUKHERJEE, A. (2007). Public expenditure on education: A review of selected issues and evidence (Working Paper 1, March). Financing Human Development. [ Links ]
19. NISPEN TOT PANNERDEN, F. K. M. VAN AND KLAASSEN, H. L. (2009). The quest for efficiency in the public sector. Towards a refined action model. EGPA-conference on The Public Service: Service Delivery in the Information Age: Saint Julian's, Malta (2009, september 02 - 2009, september 05). [ Links ]
20. PRIOR, D., VERGÉS, J., AND VILARDELL, I. (1993). La evaluación de la eficiencia en los sectores privado y público. Madrid: Instituto de Estudios Fiscales. [ Links ]
21. TEN RAA, T. (2008). "Debreu's coefficient of resource utilization, the Solow residual, and TFP: The connection by Leontief preferences", Journal of Productivity Analysis, 30:191-199. [ Links ]
22. TEN RAA, T. (2009). The economics of benchmarking. Measuring performance for competitive advantage. Palgrave MacMillan, Tilburg University, The Netherlands. [ Links ]
23. TEN RAA, T., AND SHESTALOVA, V. (2011). "The solow residual, domar aggregation, and inefficiency: A synthesis of TFP measures", Journal of Productivity Analysis, 36:71-77. [ Links ]
24. SHARMA, S., AND THOMAS, V. J. (2008). "Inter-country R&D efficiency analysis: An application of Data Envelopment Analysis", Scientometrics, 76(3):483-501. [ Links ]
25. SIMAR, L., AND ZELENYUK, V. (2011). "Stochastic FDH/DEA estimators for frontier analysis", Journal of Productivity Analysis, 36:1-20. [ Links ]
26. SIMAR, L., AND WILSON, P.W. (1998). "Sensitivity analysis of efficiency scores: How to bootstrap in nonparametric frontier models", Management Science, 44(1):49-61. [ Links ]
27. SUTHERLAND, D., PRICE, R., JOUMARD, I., AND NICQ, C. (2007). Performance indicators for public spending efficiency in primary and secondary education (Working Papers 546). OECD Economics Department, OECD Publishing. [ Links ]
28. TADESCO, J. C., AND LOPEZ, N. (2002). "Desafíos a la educación secundaria en América Latina", Revista de la Cepal, 76:55-69, April. [ Links ]
29. TRILLO, D. (2002). Análisis económico y eficiencia del sector público. VII Congreso Internacional del CLAD sobre la Reforma del Estado y la Administración Pública. Lisboa, Portugal. [ Links ]
30. UNESCO. (2011). World data on education. VII Ed. 2010/11. 7th edition. [ Links ]
31. WORLD BANK. (2008). La calidad de la educación en Colombia: un análisis y algunas opciones para un programa de política. Unidad de Gestión del Sector de Desarrollo Humano, Oficina Regional de América Latina y el Caribe. [ Links ]
32. ZERVOPOULOS, P. (2012). Dealing with small samples and dimensionality issues in Data Envelopment Analysis (Paper 39226, June). MPRA. [ Links ]
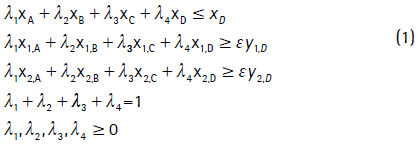
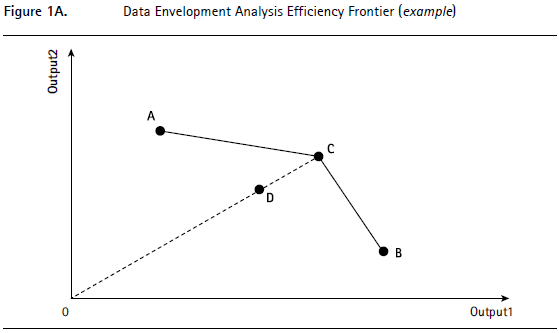
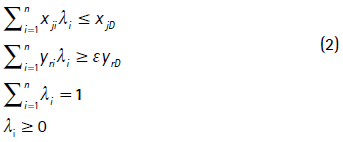
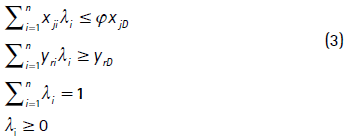
Now we come to the technical explanation of DEA and FDH based on a oneinput two-outputs example to further expand them to multiple-inputs and multiple-outputs in a linear programming problem.
A. Data Envelopment Analysis
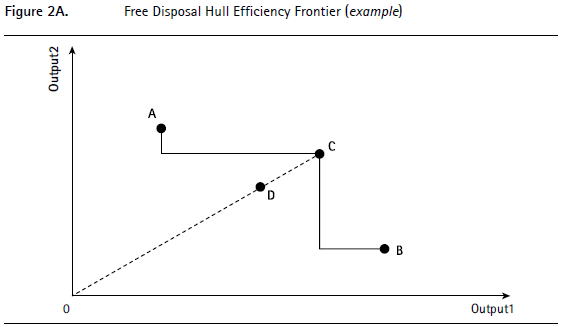
Let us consider the following example. Four countries (i = A,B,C,D), use a single input xi to produce two outputs y1,i and y2,i . Hence, twelve exogenous variables will be included in the calculations (Table 1A).
Assume that the four countries have the same amount of input (XA = XB = XC = XD). Country A is more specialized (or has been focused) in the production of output 1, while country B is it in the production of output 2 (Y1,A > Y2,A; Y1,B < Y2,B). Country C, on the other hand, produces a mix of both outputs, but it does not produce as much as each of the specialized countries (Y1,B < Y1,C < Y1,A; Y2,A < Y2,B < Y2,B). Finally, country D also produces a mix of both outputs, in the same proportion than country C, but it performs less than it (Y1,D < Y1,C; Y2,D < Y2,C).
Let us consider the case of country D. First we assume that this country wants to produce outputs at the same proportion, Y1,D and Y2,D . So we want to determine the potential outputs (εy1,D and εy2,D, where ε is the expansion factor) that country D can achieve if it adopts practices from the efficient peers. In this sense, the main aim is to maximize the expansion factor ε of country D. To do so, country D must consider to split its input in its own practices and copying the behavior of the other three countries to produce both outputs. This can be represented by the input constraint λ1xA + λ21xB + λ3xC + λ4xD ≤ xD, where λ1, λ2, λ3, λ4  [0,1] are the intensities (weights) on copying the other countries behaviors and all together must be less or equal than the input available for country D (xD). On the other hand, the output constraints show that the weighted sum of the outputs must be grater or equal than the potential output. In this case, the allocation of the input would produce λ1y1,A + λ2y1,B + λ3y1,C + λ4y1,D of output 1 and λ1y2,A + λ2y2,B + λ3y2,C + λ4y2,D of output 2, which can be expanded at the factor ε. Finally, we impose the restriction λ1 + λ2 + λ3 + λ4 = 1 in order to allow convexity of the frontier, accounting for variable returns to scale.31 Variable returns-to-scale technology envelops the data tightly to determine the efficiency frontier. According to Fried, Lovell and Schmidt (1993) this assumption also makes that convexity on the production possibilities set be imposed by requiring strictly positive input to produce nonzero outputs. This assumption is appropriate when DMU are not operating at optimal scale because of imperfect competition, governmental regulations, constraints on finance, etc.
The linear programming problem to find the optimal expansion factor of country D and the corresponding weights is:
The expansion factor ε measures the distance between country D's production and the efficiency frontier ("best virtual producer"), which is defined as a linear combination that envelops the efficient countries. If ε* > 1 means that the evaluated country is inside the frontier (i.e., inefficient), as it is possible to have the radial increase in all the outputs. Meanwhile if ε* = 1 means that the country is on the frontier (i.e., efficient). λi reflects the weights used in the linear program to calculate the location of the inefficient country, if it were to become efficient. One of the main advantages of this model is that λi has the interpretation of Lagrange multipliers (i.e., shadow prices).
This linear programming problem has to be solved as many times as countries in the sample (in this case 4 times), so each time a different country has to be evaluated relative to the observed performance of the whole group.
The graphical representation of (1) is as follows (Figure 1A).
Notice that countries A, B and C are efficient while country D is not. In this case, country D's potential outputs is country C's production, but in a more general case it could be any point of the efficiency frontier according to the proportion of outputs produced by the country. From this figure the expansion factor is OC/OD > 1.
If (1) is expanded to i = 1,...,n countries, j = 1,...,k inputs, and r = 1,...,m outputs, the model will be as follows for a country D:
Finally, the efficiency scores from the output-orientated problem is defined by the inverse value of the expansion factor of benchmarking problem (2), θ = 1/ε.
The linear programming problem in (2) is output-oriented, this means that we fix inputs and get "goal" outputs. A different exercise, input-oriented, would be fixing the outputs and getting "goal" inputs. The linear programming problem to describe this exercise is:
Notice that we set the factor φ to the input used, while the output constraint is fixed. This means that the linear programming problem is looking for the factor φ that allows the DMU to reduce the inputs for a certain level of outputs. This approach is also used to determine the wasted resources to produce the outputs level achieved. Although both linear programming problems identify the same efficient peers, the scores of the rest of the DMUs are not equivalent, because they are different in the vector that can be modify (input or output) fixing the other one.
B. Free Disposal Hull
The proposed way to calculate the efficiency scores with FDH is based in the same programming problem presented in (1), (2) and (3) for the example, the expanded output-oriented model and the expanded input-oriented model, respectively. Nevertheless, this technique does not assume a convex combination between efficient peers, so it is necessary to impose that λi  {0,1}, to limit the possibility of expansion to "virtual peers" levels and keep the efficiency frontier with the observed efficient peers only.
The following figure shows the efficiency frontier of our example using FDH technique. Notice that in this example there is not any linear combination between countries A and C, and C and B (Figure 2A).
Appendix 2
List of variables, Sources and Definitions
[All the definitions are based on the glossaries provided for each of the data sources]
Literacy rate of youth - people ages 15 - 24 (%)
It is the percentage of people between 15 and 24 years old who can both read and write with understanding a short simple statement on their everyday life. Generally, 'literacy' also encompasses 'numeracy', the ability to make simple arithmetic calculations.
Net enrolment in primary (%)
It is the ratio of children of official school age based on the International Standard Classification of Education 1997 who are enrolled in school to the population of the corresponding official school age. Primary education provides children with basic reading, writing, and mathematics skills along with an elementary understanding of such subjects as history, geography, natural science, social science, art, and music.
Primary completion rate (%)
It is the number of non-repeating students in the last grade of primary school divided by the population of the official age of the last grade of primary.
Net enrolment in secondary (%)
It is the ratio of children of official school age based on the International Standard Classification of Education 1997 who are enrolled in school to the population of the corresponding official school age. Secondary education completes the provision of basic education that began at the primary level, and aims at laying the foundations for lifelong learning and human development, by offering more subject- or skill-oriented instruction using more specialized teachers.
Average PISA score in mathematics, reading and science (score) - constructed variable
It is the average between the mean performance of the mathematics, reading and science scores for the PISA test in 2000, 2003, 2006 and 2009. The correlation between scores is: mathematics-reading: 84.4%, reading-science: 96.6%, and mathematics-science: 93.9%.
Public education spending per student in primary (2005 US$ - PPP terms) - constructed variable
It is the public current spending on education in primary school divided by the total number of students at the same level. Public expenditure (current and capital) includes government spending on educational institutions (both public and private), education administration as well as subsidies for private entities (students/households and other privates entities). This variable is denominated in equivalent US dollars converted using Purchasing Power Parities (PPP) of 2005, based on equivalents full-time students.
The variables were a construction from the original variables "Public expenditure per student in primary (%GDP per capita)" as follows:
Public education spending per student in secondary (2005 US$ - PPP terms) - constructed variable
It is the public current spending on education in secondary school divided by the total number of students at the same level. Public expenditure (current and capital) includes government spending on educational institutions (both public and private), education administration as well as subsidies for private entities (students/households and other privates entities). This variable is denominated in equivalent US dollars converted using Purchasing Power Parities (PPP) of 2005, based on equivalents full-time students.
The variables were a construction from the original variables "Public expenditure per student in secondary (%GDP per capita)" as follows:
Teacher per student ratio in primary (%) - constructed variable
It is the number of teacher in primary school, regardless of their teaching assignment, divided the number of pupils enrolled in all the primary levels. This variable is a constructed variable from the original "pupils-per teacher ratio (%)" included in the Unesco institute for statistics education data base. The transformation is as follows:
Teacher per student ratio in secondary (%) - constructed variable
It is the number of teacher in primary school, regardless of their teaching assignment, divided the number of pupils enrolled in all the primary levels. This variable is a constructed variable from the original "pupils-per teacher ratio (%)" included in the Unesco institute for statistics education data base. The transformation is as follows:


