Services on Demand
Journal
Article
 English (pdf)
 Article in xml format
 Article references
 Send this article by e-mail
Indicators
-
 Cited by SciELO
 -
 Access statistics
Related links
-
 Cited by Google
 -
 Similars in
SciELO
Similars in
SciELO -
 Similars in Google
Share

 Permalink
Desarrollo y Sociedad
Print version ISSN 0120-3584
Desarro. soc. no.74 Bogotá July/Dec. 2014
https://doi.org/10.13043/DYS.74.2
DOI: 10.13043/DYS.74.2
Who Benefits from the Elimination of School Enrolment Fees? Evidence from Ecuador
¿Quién se beneficia de la eliminación del cobro por matrícula? Evidencia del Ecuador
Priscila Hermida1
1 I am grateful to Jeffrey Wooldridge, Sonia Bhalotra, Paul Clarke and Joao Santos Silva, two anonymous reviewers, and the Editor for useful comments. I also thank seminar participants at the University of Bristol, and at the University of Essex; Sebastian Baez for logistical assistance in the data collection process, and Sofía Barragán and Juan Andrés Rodríguez for excellent research assistance. All errors are my own. Pontificia Universidad Católica del Ecuador. Quito, Ecuador, e-mail: phermida062@puce.edu.ec.
Este artículo fue recibido el 31 de mayo de 2014; revisado el 3 de julio de 2014 y, finalmente, aceptado el 8 de octubre de 2014.
Abstract
This paper evaluates the effect of an enrolment fee elimination program in Ecuador. Using propensity score matching, I estimate the impact of the initiative on dropout rates for primary and secondary school students. Overall, the findings suggest that the program had non-negligible and positive effects on the probability of continuing in school one year after the intervention for those students enrolled in the 2007-2008 school year, in spite of already high enrolment and low dropout rates. The estimated difference between paying and non-paying students in continuation rates is around 2 to 4 percentage points. The impact of fee elimination is heterogeneous to demographic characteristics. Male, urban and non-poor students seem to benefit the most. The program has no effect for female, rural or poorer students. Much bigger differences in continuation rates exist between groups of secondary students. The effects are particularly significant for male secondary school students.
Key words: Education, user fees, enrolment, propensity score matching.
JEL classification: C21, H24, I28, I38.
Resumen
Este artículo explora el efecto causal de la eliminación del cobro por matrícula (contribución voluntaria) en el Ecuador. Los resultados obtenidos sugieren que el programa tuvo efectos positivos y estadísticamente significativos en la probabilidad de que los estudiantes matriculados durante el año lectivo 2007-2008 se mantuvieran dentro del sistema educativo, evitando la deserción un año después. La diferencia estimada en la tasa de continuación entre los estudiantes que pagaron y los que no pagaron al momento de la matrícula es de entre dos y cuatro puntos porcentuales. Los estudiantes de género masculino, los que residen en áreas urbanas, y aquellos estudiantes de hogares de mayores ingresos se benefician sustancial y diferencialmente de este programa. La intervención no tiene efecto para las estudiantes de género femenino, residentes en áreas rurales, o de hogares de menores ingresos. Efectos de magnitud mayor se encuentran entre los estudiantes de los últimos años de educación básica (séptimo a décimo). El impacto del programa es, en particular, alto para los alumnos hombres de estos grados, y equivale a una reducción en la tasa de abandono de casi diez puntos porcentuales.
Palabras clave: Educación, cobros por matrícula, emparejamiento.
Clasificación JEL: C21, H24, I28, I38.
Introduction
In less developed countries, parents face important private education costs. Direct costs take the form of school fees, transport costs, textbooks or school uniforms. These school-related payments can be a significant portion of household expenditure-in addition to the forgone income from labor taking place in the market and/or at home-and may vary by gender and age.2 In the absence of functioning credit markets for education, small cash fees may constitute an impediment to primary enrolment, especially in families with several schoolaged children.3 In Ecuador, for example, 59 percent of children aged 6 to 15 and not in school cite lack of financial resources as the reason for not being enrolled.4 School fees have been found to be a significant reason for children not enroling or dropping out of school in Indonesia, China, Tanzania, Kenya, Gambia and other countries. One of the ways to increase educational attainment is therefore to reduce costs and thus eliminate barriers to entry into the education system. In this paper, I analyze the effects of the elimination of school fees in Ecuador on the dropout rate of students in public schools.
There is no agreement on the role of school fees in influencing the quantity of education attained. On one hand, it is believed that if the costs of education are lower, the quantity demanded will increase and children will stay in school for longer. On the other hand, the price elasticity of demand for schooling may already be low, at least for younger children. Fees may also promote accountability, and contribute to the funding of public schools (Glewwe and Kremer, 2006). The argument is relevant because many countries still maintain some form of school fee. A World Bank survey conducted in 2005 found that only 16 out of 93 less developed countries had no user fees in education. The majority of African countries continue to have fees in primary school, although Uganda (1997), Tanzania (2000), Malawi (1994), Mozambique, Ghana and Kenya (2003), Lesotho and Zambia have abolished them as a strategy to increase enrolment (World Bank, 2009). In Latin America, 6 out of 19 countries maintained tuition fees, 6 countries had uniform fees and 14 had other types of fees imposed by public schools on households in 2005 (Bentaquet-Kattan, 2006). Most countries that eliminated school fees in Africa increased gross primary enrolment, with the gain ranging from 5 percent in Zambia to 68 percent in Uganda, although the subsequent decrease in resources available per student and overcrowding was reported as a problem. There is, however, very little econometric evidence of the effects of fee reduction or elimination on educational outcomes.
The purpose of this paper is to contribute to the literature by empirically exploring the purposed benefits of eliminating school fees in a developing country context. Although many developing countries have introduced, or are working on introducing, programs that incorporate an element of conditionality, political and logistical factors in such settings tend to favor policy interventions that are implemented across the board, without any targeting or conditionality consideration. In those cases, the absence of baseline measures, or appropriate comparison groups, makes program evaluation challenging. I aim to fill this gap by exploring the initiative of the Ecuadorian government to scrap the enrolment fee using propensity score matching, in conjunction with administrative and pupil level data, to identify the causal effect of the elimination of the school enrolment fee. This program was implemented nationally, and the lack of appropriate research inputs prevented any previous evaluation. Ecuador is also an interesting case study because of its education system characterized by non-universal coverage in primary and secondary school, and inequalities in access for population subgroups. The specific questions addressed are: a) did the elimination of enrolment fees affect demand for education and dropout rates in Ecuador? And b) did the effects of the intervention differ by pupil characteristics?
Overall, the findings suggest the program had non-negligible and positive effects on the probability of continuing in school one year after the intervention for those students enrolled in the 2007-2008 school year, in spite of already high enrolment and continuation rates. The estimated difference between paying and non-paying students in continuation rates is around 2 to 4 percentage points, on average, in line with recent similar studies. There are, however, striking differences in gains according to demographic characteristics. Unlike most previous studies that report positive differential effects by students' gender or socioeconomic background, I found that male, urban and non-poor students seem to benefit from the initiative the most. The estimates suggest that the program has no effect on female, rural or poorer students, groups considered to be more excluded from the education system and at higher risk of dropping out. When I look only at the subsample of students in lower secondary education, I find significant differences in continuation rates between groups much higher in magnitude than the differences found for the entire sample. The effects are particularly large for male secondary school students.
The paper is organized as follows: Section I reviews the recent literature on school enrolment fees. Section II provides a general overview of the educational system in Ecuador and describes the implementation of the program. Sections III and IV describe the methodology and data used. Section V explains the identification strategy. Section VI presents the main results. Section VII concludes.
I. Literature Review
Staying in school is important because low educational attainment is associated with lower wages, poorer health, and poverty later in life (Oreopulous, 2007). Having less education can have an intergenerational effect on human capital formation of the next generation of children. Policies that aim to eliminate barriers to entry to the educational system -such as the enrolment fees-increase the probability of staying in school, and/or completing a given level of education. The decision of whether or not to drop out of the education system is important as it directly affects the total number of years of schooling attained. In addition, discontinuing education may exacerbate inequality when students dropping out come from economically disadvantaged and/or excluded groups of the population. In developing countries, it is likely that this kind of policy would increase the total number of years of education attained, since opportunities for intertemporal substitution in timing of education acquisition are scarce.5 For these reasons, numerous interventions that reduce the cost of education have been implemented worldwide to encourage students to stay in school. Some of the policies tested include subsides and vouchers (Angrist, Bettinger, Bloom, King and Kremer, 2002 and 2006; Dearden, Emmerson, Frayne and Meghir, 2009); provision of uniforms and textbooks (Kremer, Moulin and Namunyu, 2002) conditional cash transfers (Attanasio et al., 2005 and 2010; Schultz 2004; Schady and Araujo 2006); and school meals (Veermeersch and Kremer, 2005). Most of these initiatives have been subject to rigorous evaluations of their effectiveness using experimental or quasi-experimental methods.
In spite of its policy relevance, robust econometric analysis of the effects of abolishing user fees is scarce. The existing literature is mainly descriptive, comparing enrolment rates before and after the elimination of school fees.6 Descriptive evidence from Sub-Saharan Africa shows great improvements in enrolment after such interventions: a doubling of school enrolment in Uganda in 1997; an additional 1.5 million pupils enrolled in Tanzania in 2002; and a substantial increase in enrolment in Kenya in the same year.7 Although school enrolment increased greatly after the elimination of fees in some African countries, there are few quantitative evaluations of these policies, and the existing ones are focused on Uganda. Using cross-section methods, Deininger (2003) evaluates the effect of the Universal Primary Education Program implemented in Uganda since 1997. The intervention eliminated primary school fees, and was accompanied by a decentralization effort, as well as a publicity campaign promoting schooling for girls. The results show that the program was associated with a significant increase in school attendance, and differences in outcomes related to region, income, and particularly gender were substantially reduced. Al-Samarrai and Zaman (2007) assess the impact of the 1994 abolition of primary school fees in Malawi using data from the 1997/98 Integrated Household Survey data and benefit incidence methodology. Results show that enrolment rates increased dramatically over the 1990s, at both primary and secondary levels, and that the gains were greatest for the poor. Nishimura, Yamano and Sasaoka (2008) estimate the impact of the elimination of school fees in Uganda on overall primary education attainments by using data including 940 rural households. They find that the intervention decreased delayed enrolments and increased grade completion rates up to the fifth grade and its effects were especially large for girls in poor households. While the results suggest the program also improved completion rates, this effect was only significant for girls up to the 5th grade and boys up to the 4th grade.
Fewer studies have been able to identify estimates of the treatment effect of eliminating school fees on enrolment or continuation rates. The three papers closest to ours are Barrera-Osorio et al. (2008); Grogan (2009) and Riphahn (2010). Using a regression discontinuity design, Barrera-Osorio, Linden and Urquiola (2007) analyze a targeted program-Gratuidad-implemented in Bogota, Colombia that eliminates fees for basic education for poorer children. They also find the program increases enrolment from 3 to 6 percent, depending on the grade of the pupil. This is an increment in enrolment rates similar to the effects found in conditional cash transfer programs, such as Progresa in Mexico (Schultz, 2004). Their results indicate bigger increments in enrolment rates in higher grades (10 and 11), making the intervention more effective at the secondary school level versus primaryschool. Students at-risk seem more likely to benefit from the program. They find evidence of heterogeneous impact by student's gender, with the transfer having no effect on the continuation rate for girls in basic education, but increasing enrolment of females in higher school grades.
Grogan (2009) examines the effects of the introduction of Universal Primary Education (UPE) in 1997 in Uganda on the age at which children enter school, which is strongly correlated with primary school dropout rates. Data from the 2000 Uganda Demographic and Health Survey and 2001 Education Data Survey are employed to examine the effects of UPE on the probability that a child begins attending school before age nine. A regression discontinuity design that exploits the age of the child at the start of the intervention provides identification. The results show a positive effect of the school fee elimination on the probability of entering school before age 9 of about 3 percent. Effects are concentrated on girls (5 percent increase) and children living in rural areas (3.4 percent). Poorer households benefited more than more affluent ones. Riphahn (2010) uses the heterogeneity of the fee abolition process in West German secondary schools to identify the effect of school fees on educational attainment and to obtain an estimate of the price elasticity of upper secondary education. The variation in the timing (1947 to 1962) and the mode of fee abolition across states identifies the effect of fees on schooling. The analysis uses individuallevel data from three annual surveys of the German Mikrozensus. The results suggest that upper secondary school attainment increased by at least eight percent in response to fee abolition. The educational attainment of females seems to be more price sensitive than males. A drawback of this study is that the fee abolition coefficient cannot be estimated precisely, and that results of fee elimination for upper secondary school students in a developed country may not be easy to generalize to other settings.
In spite of these contributions, important empirical questions related to the causal impact of the elimination of school fees on educational outcomes, its size, and its potential heterogeneity in different contexts remain unanswered.
This paper will explore the effect of enrolment fee elimination in Ecuador on student dropout rates.
II. Background
A. The Education System in Ecuador
Ecuador is a country with great disparities in terms of access to and quality of education. In 2009, the gap in average years of schooling between individuals in the lowest versus highest income quantile was of 7.6 years. Inhabitants of urban areas had on average 3.8 more years of schooling than people living in rural areas. The gap between men and women was of 1.4 years of schooling. The difference between non-indigenous and indigenous Ecuadorians in average years of education was of 3.4 (SIISE, 2014). In spite of the legal framework, compliance with mandatory schooling is lax. Although the average net enrolment rate in primary school in 2008 was around 92 percent, an estimated 110,000 children were out of the education system. Most of these children live in poverty and belong to ethnic minorities. Average school enrolment in secondary education drops to only 51 percent of Ecuadorian children (Unesco, 2009). The main reasons leading to children being left out of school are poverty, lack of infrastructure and a shortage of teachers (Luna Tamayo, 2006).
Children who do attend school do not necessarily complete the mandatory ten years of schooling. Data for 2004 show that although 90 percent of children continued through to the second year of basic education (first year of primary schooling in the old system), desertion was high in subsequent years. One in three children did not finish year 7 of the new system (finish primary schooling) and three out of ten of those who finished year 7 did not go on with secondary education. Grade repetition is also a challenge. In order to attain six years of primary education, Ecuadorian children spent seven years in school, at a cost for the government of $300 million dollars per year (Contrato Social por la Educación en el Ecuador, 2006).
In 2006, the Government of Ecuador launched a ten year plan to improve the quality of public education in the country called the Plan Decenal de Educación 2006-2015. One of the main goals of the plan was to reach universal basic education; that is, grades 1 to 10. In order to reach the goal, several programs were implemented aiming to reduce barriers to entry in the public education system. One of these initiatives was the elimination of enrolment fees. Up to that point, parents had to make a payment of around $25 per year when registering children in a public primary school. This fee is known as "voluntary contribution."
B. The Program
The initiative abolished a parental voluntary fee to be paid when enroling children in the public education system in Ecuador. This program started in 2006 and its main objective was to eliminate barriers of entry into education for poor children. A direct government subsidy of $25 per family was given to public schools in lieu of previous direct payment by parents. The number of families per school was calculated dividing the total number of pupils in the school by 1.6, a figure determined by the National Institute for Statistics and Censuses to correspond to the average number of school age children per family in the country.8
In its first year, pupils in years 1 to 7 of general basic education (pre-primary and primary in the old system) were eligible for the transfer. In 2007, it expanded to cover a subsidy of $30 per pupil in years 8 to 10 of secondary education. During 2006, the funds were channeled through the office of the Ministry of Education in each province, but due to logistic problems, in 2007, the allocation system was changed to a "network" scheme.
In this arrangement, each primary school was assigned a "collector," or geographically closest secondary school. The collector institution received the funds from the Ministry of Education, and through its tesorero or financial officer, distributed them to the group of primary schools that belonged to its red educativa or "education network." In order to obtain the transfer, the principal at a primary school had to engage in administrative exchanges with the Provincial Office of the Ministry of Education and/or with the staff of the education network created for the allocation of the funds (Ministerio de Educación del Ecuador, Acuerdo Ministerial No. 250, 2006).
The implementation of the program implied that it was the primary school's principal and the secondary school's tesorero who were mainly responsible for the procurement and management of the funds that replaced the parent's contribution. Thus, the percentage of executed versus allocated funds depended on the management abilities of the primary school principal and the tesorero at the secondary school. During fiscal year 2008, schools actually used 85 percent, out of $14.6 million allocated for the program. The remaining 15 percent of funds were allocated to schools but not used. Money not used by the end of the year had to be returned to the Ministry of Education, where it was accounted as non-executed expenditure at the end of the fiscal year. There is no data available for the 2007 fiscal year (Unicef, 2010).
Resources could only be spent on certain budgetary items (partidas presupuestarias), according to strict regulations from the Ministry of Education. The items included: furniture, payment for basic services (water, electricity, phone), personnel, and small infrastructure expenditure. Invoices had to be produced for every disbursement made by the school principal, and uploaded to an online system by the network tesorero. Periodical reports on the use of the funds also had to be produced and uploaded. According to Ecuadorean civil service law, failure to return money or provide invoices and/or reports would result in legal and administrative sanctions.9
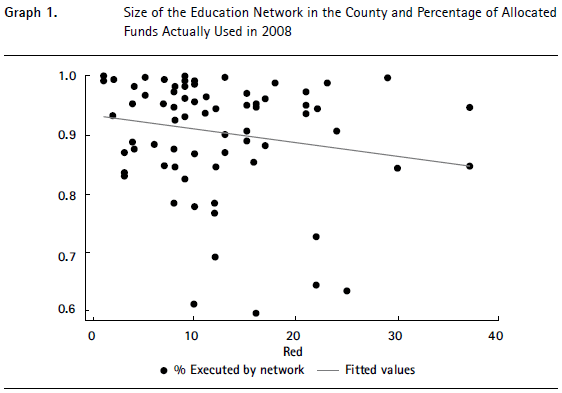
Evidence suggests that a factor influencing access to funds, and the degree of budget execution, was the size of the network that the primary school belonged to. The logistic difficulties and costs associated with the program seem to have been greater for schools that belong to bigger networks. Bigger networks had more difficulty in procuring and using funds.10 The inverse relationship between the size of the network and the percentage of funds actually used by schools in the year 2008 is shown in Graph 1 in the Appendix.
Although instances of collusion between the school principal and the network tesorero cannot be ruled out, there is no qualitative evidence to suggest it. As previously mentioned, expenditure reports and invoices had to be entered into an online system. In terms of the school budget, the transfer was not additional money, but a substitute for funds collected from the parents before 2006. To our knowledge, there are no press reports of any corruption allegations regarding the voluntary contribution program, nor was this problem mentioned during interviews with Ministry of Education officers.11
The only existing evidence on program uptake at the school level was obtained by the Government for a sample of 202 schools in five provinces of the coastal region.12 Certain school characteristics seem to be correlated with participation in the program: 41 percent of schools in rural areas still charged pupils for enrolment, compared to only 14 percent in urban areas. Schools that did not receive the transfer were also more likely to be schools with less than one teacher for each grade or class, and have all six grades, known as "incomplete schools"; or schools where there is only one teacher, known as "unidocentes"; or where teachers have more than one year under their care, known as "pluridocentes". It is likely that the directors of schools with less than one teacher per grade face constraints in terms of time available for paperwork. Additionally, while three out of four school principals had a permanent post in schools that participated in the program, less than half of the principals had a permanent position in schools that still charged. Presumably, principals with permanent posts had more experience with, or information about, the administrative procedures necessary to obtain the funds from the Ministry of Education.
Finally, schools that still charged students an enrolment fee were more likely to be located in areas with less access to public services such as telephone lines and sewage. These institutions also had a higher probability of being included in the "Free Lunch" and "Free Breakfast" government programs. The programs operate in public schools located in rural and suburban areas with high incidence of poverty.
There is very little additional information available about the implementation of the program-and none about its impact-in spite of its significant political effects.13 The main reason for the lack of proper evaluation is the absence of data. For example, the Ministry of Education did not keep administrative records of the amount of subsidy actually executed in each school for 2006 or 2007, and therefore cannot determine which schools received the subsidy, or the proportion of assigned funds actually used by each institution during the years prior to or following 2008. Determining which schools actually received the treatment, and with what intensity, is thus impossible with administrative data. Student level data obtained from the National Survey of Employment and Unemployment-a nationally representative household survey-reveals that after three years of implementation, the program had only partial coverage. Out of the 4,978 pupils of public schools that appear in both the 2007 and 2008 rounds of the survey, 52 percent still made a voluntary payment at the time of enrolment in 2007. The remaining 48 percent does not, and therefore, attends a school that receives the subsidy.
III. Methodology
Since the design of the initiative that eliminated payment at the time of enrolment in Ecuador did not establish a baseline measurement, it was not possible to use an experimental approach to evaluate its effect by assigning observations into treatment and control groups. As is frequently the case in developing countries, the initiative was implemented at a national scale due to political considerations. For this reason, an exogenous source of geographic or temporal variation that would allow us to construct a comparison group and use quasi-experimental methods is not easily identifiable either. In spite of the data limitations, the fact that the program has partial coverage makes it possible to build a control group using a subpopulation of non-beneficiaries that resembles the group of students who did not have to pay at enrolment.
The government's elimination of the voluntary contribution allocates resources to the schools and not to individual students, and in an ideal situation, I would like to be able to build a treatment group with the schools that have received the transfer, and a control group with those schools that have not. Unfortunately, given the administrative data available from the Ministry of Education, it is not possible to use the school as the unit of analysis. For this reason, I have used information on reception of the subsidy self-reported by primary education pupils enrolled in public schools, from the National Survey of Employment and Unemployment.14 Although it is possible for some measurement error to be present in the self-reporting of paymentbecause of the nature of the survey, I think it very unlikely that any misreporting would be systematic.
We define participation in the program (reception of the treatment) as follows:
- A primary education student in a public school receives the transfer if she does not make any payment at time of enrolment.15
Y1i = the education outcome of student i, if the student did not pay the voluntary contribution.
Y0i = the education outcome of student i, if the student did pay the voluntary contribution.
Di  {0,1} = is an indicator of the student i receiving the treatment; equals 1 if the student received treatment (did not pay at enrolment); or 0 if the student did not receive the treatment (paid at enrolment).
Xi = vector of student's socioeconomic characteristics.
The causal effect of the elimination of the payment, in terms of the outcome variables, is given by:

However, in reality, for each student I can only observe:

That is, it is impossible to observe the counterfactual: the educational outcome for student i that received treatment, if she had not. I cannot observe Y1i and Y0i for the same individual. In spite of not being able to estimate the impact of the intervention for each individual, it is possible to estimate the average effect of the treatment over the group that received the treatment (Average Treatment Effect on the Treated, ATET), defined as:

This expression describes the average impact that the elimination of the voluntary contribution payment has over the outcome variables for the students that did not pay for enrolment in Ecuadorian public schools; conditional to a vector of observable student characteristics. There is generally enough information to estimate E(Y1 | X, D = 1), but not enough to identify E(Y0 | X, D = 1).
Propensity Score Matching (PSM) method models reception of treatment as a function of relevant observed student characteristics (Imbens, 2014). It allows comparison between the outcomes of students who have benefited from the elimination of the voluntary contribution-and received the subsidy from the government during the academic year 2007-2008-with the outcomes of a comparison group of students that are very similar in observable characteristics to the treatment group, except from the fact that they did have to make the payment. PSM rests on two assumptions. One is the existence of common support, or overlap in the distribution of student characteristics for both groups. This means that students in the treatment group have to share characteristics with students not receiving treatment.16 Another assumption is that all differences between the students that received the transfer and those who did not receive it, are contained in their observable characteristics (Conditional Independence Assumption):

This implies that assignment to the treatment group should be determined entirely by observables. Conditional on a vector of student characteristics X, the outcomes of the pupils that paid should resemble the outcomes that the students who did not pay would have obtained if they had not received the transfer:

This assumption allows the identification of ΔY , that is, the Average Treatment Effect on the group that participates in the program. The expected value E(Y0 | X, D = 0) can be estimated using data on the students that did pay. If p(xi) is the probability that student i has received the treatment, defined as p(xi) = Prob(Di = 1 | xi) = E (Di | xi), where 0 < p (xi) < 1, then:

That is, I can condition the distribution of the outcomes to the probability of having received the treatment, given the value of the vector of observed characteristics X. This probability is a scalar p(X), known as the propensity store. It is possible then to estimate the impact of the program using the following expression:

The main caveat of the PSM method is that it cannot rule out the effect of unobservables that may influence outcomes and program participation. The assumption that the effect of the treatment on student outcomes is random, conditional on participation observables, is inherently untestable. If student characteristics related to both reception of treatment and schooling outcomes are not observed and controlled for, selection bias would exist. For example, if unobservable characteristics are positively related to outcomes and continuation rates, i.e. more motivated students go to schools that receive the treatment and do not drop out at the end of the school year, the results would overestimate the effect of the elimination of enrolment fees. In order to minimize the possibility of bias due to unobservables, I employ knowledge of the institutional setting and data from the Ministry of Education on relevant school characteristics aggregated at the parroquia level to complement information contained in the household survey, and thus include a rich setting of student and community characteristics as controls.
IV. Data and Descriptive Statistics
A. Database
We use data from the 2007 and 2008 December rounds of the National Survey of Employment and Unemployment (Enemdu). This is a nationally representative survey that collects data on 50,633 individuals living in 12, 994 households. Enemdu is primarily a labor force survey, and has a rotation panel scheme to observe changes in labor force participation for each two consecutive years. The design of the scheme is 2-(2)-2, where 25 percent of households are interviewed for two consecutive quarters, then stay out of the sample for the next two waves and are included again two more times.17 The December 2007 Enemdu round contains 11,375 primary education students aged 5 to 15. A panel of 4,978 primary school students that appeared in both the 2007 and 2008 December rounds was built. This sample is nationally representative.18
The panel is rich in information about socioeconomic characteristics of the students and their families. It also shows the family's recipient status of other government programs and subsidies. The survey records the enrolment status for all household members older than 5, as well as the year and level the student is enrolled in each year. If the student was enrolled in the education system during the 2008-2009 school year, the dataset shows whether she made a payment at enrolment at the beginning of 2007-2008.
In addition to individual-level data, two unique additional variables were constructed from information provided by Ecuador's Ministry of Education. They are the percentage of incomplete schools (schools that have less than one teacher for each grade, from first to sixth grade) at parroquia level, and the average size of the educational network used for the allocation of program funds at county level in 2007.19 Table 1 in the Appendix describes all variables used in the estimations. Since I would like to examine the effects of the program on the decision to drop out or to continue in school the next year-an incomplete measure of eventual years of schooling achieved-our outcome indicators are defined as follows:
- Enrolment in the year following the intervention (continuation rate): Using the survey data for both years, I can construct a binary indicator equal to one if the student continues to be enrolled in the education system in the academic year 2008-2009 and equal to zero if the student is not enrolled.
- Dropping out for financial reasons: If the student dropped out, the reasons for not being enrolled in 2008 are recorded. I construct a binary indicator equal to one if the student abandoned her studies due to lack of financial resources or in order to pursue paid or unpaid work.
B. Descriptive Statistics
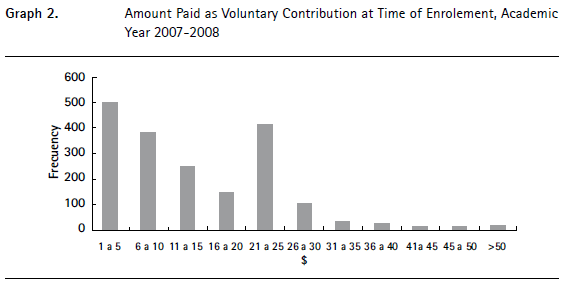
Out of the total number of pupils in the sample, 52 percent still makes a voluntary payment at the time of enrolment in 2007. The remaining 48 percent does not and, therefore, attends a school that receives the subsidy. Amongst those students paying, there is great variation in the amount paid: the fee goes from $1 to $230 in the 2007 school year, with most students paying $25; that is, the exact amount equivalent to the government subsidy. Graph 2 in the Appendix shows the distribution of the payments.
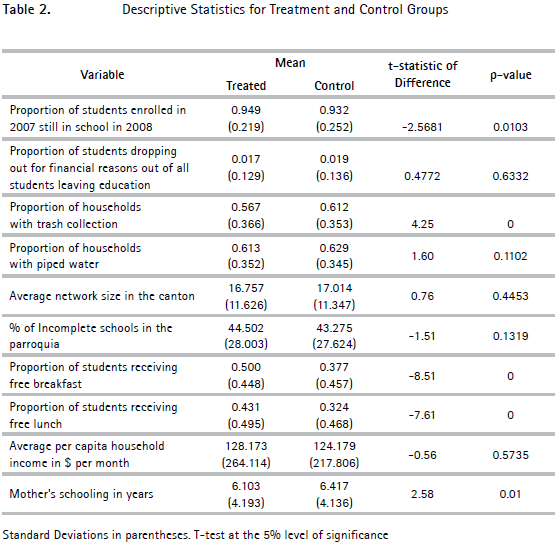
Table 2 compares the characteristics of the students in the treated and untreated groups before the matching procedure, and the t-statistic associated with the differences between the groups. Approximately 5 percent of the students enrolled in 2007 had abandoned school in 2008 in the treated group, versus 7 percent of the comparison group. The difference is statistically significant. The proportion of students that enrolled in school in the 2008-2009 academic year that report dropping out of school due to financial reasons the year following the intervention is 2 percent in both groups, with no statistical difference. The students that received the transfer have a higher probability of living in a parroquia with less coverage of trash collection services and are more likely to receive free breakfast and free lunch. The mothers of treated students have on average 0.3 years of schooling less than the mothers of the comparison group. These differences are statistically significant. The students that paid at the time of enrolment are more likely to do housework, although the difference in the average number of hours of housework between treatment and comparison groups amongst those who do participate in household chores is very small.
The data does not show significant differences between groups in terms of the average size of the education network in the student's county of residence, the percentage of incomplete schools in the parroquia of residence, or in the proportion of households with access to piped water in the student's parroquia. There are no statistically significant average per capita differences in household income between treated and untreated individuals.
C. Potential Sources of Bias
We cannot rule out measurement error in the data, common in survey information collected in less developed countries. Some variables such as reported household income could suffer from this problem. If the error is random, it may lead to underestimation of the effect of the intervention. It is also possible that children who attend lower-quality schools or face more binding credit constraints will drop out of school sooner and may not be included in our estimations. This type of attrition bias may result in a sample of higher average innate ability (since high-ability students tend to stay in education) and, thus, in overestimation of the impact of the program. Because enrolment rates fall with age, this potential source of bias would be more important when analyzing the effects of the program on students in higher grades.
The most important consideration for the internal validity of our results is that the Conditional Independence Assumption (CIA)-equation (4)-holds; that is, that the outcome is independent of treatment, conditional on the propensity score. However, if parents can change the direct costs of schooling they face by choosing a particular school, and/or if any unobserved characteristics of children or families that determine school choice are also correlated with outcomes, selection bias may occur.20 It is possible that some unobserved characteristics of the student or his parents; for example, innate ability or access to information about the program, affects both program participation and outcomes. More "able" or "informed" households could self-select into the program. Likewise, school principals with better managerial abilities may be more likely to do the necessary paperwork to obtain funds, and pupils of better-managed schools may stay in education longer, even after controlling for household characteristics. Omitting any such relevant information would lead to overestimation of the effects on the program on outcomes. To address these issues, plausible proxies for potentially omitted variables are included in this study.
Interviews with central level Ministry of Education officials in Ecuador suggest that the main reasons why some schools participated in the program, and others did not, were related to the principal's role in completing the paperwork or required procedures to gain access to the funds. Some school principals were not willing to do the extra work. Others were reluctant to participate due to fear of their management of all school funds being audited at some point in the future if they received the government subsidy, versus no auditing taking place if they continued charging parents. Another reason mentioned was that assignment to the fund allocation networks was not always efficient, with some networks being too big.21 Because of this, I have included the average size of the educational network in the student's county of residence, and the percentage of schools that have less than one teacher per grade (incomplete schools) in the student's parroquia of residence, as proxy indicators of the degree of difficulty in obtaining program funds, and to capture the institutional factors that could have an effect on program participation at the community level. The model also includes information on whether the student receives free breakfast or free lunch at school. Program participation in these nutritional interventions is determined at the school level and covers all students of a particular institution. Amongst other requirements, in order to benefit from the free breakfast or lunch programs, the school principal must send a formal written petition to the Provincial Office of the Ministry of Education, including the signatures of most of the pupils' parents. Thus, student participation in these programs is a credible proxy of the management skills of school principals, particularly in regards to doing paperwork. It is also a measure of the prevalence of poverty in the locality where the school the student attends is located.
Additionally, the propensity score model includes student characteristics correlated with educational outcomes, such as age and family income weighted by the size of the household and maternal years of schooling. Controlling for student's age, household income, family size, place of residence, access to public services and parental education, plus a set of interactions, helps to avoid systematic unobserved heterogeneity between families. In particular, mothers' years of schooling incorporates elements of heritable ability, capacity to gather information, and preferences for education of children. Income weighted by family size provides a measure of the credit constrains faced by the family. The inclusion of age dummies helps to avoid any differences in the ability distribution of the treatment and comparison groups arising from attrition bias. Provincia fixed effects are used to proxy for geographical differences in access to information and services.
The model also incorporates community level variables correlated with program participation. Although I do not have school level data, information about the characteristics of the student's parroquia of residence can be inferred from the aggregate survey. The percentage of people with access to piped water, and the percentage with access to trash collection at parroquia level are included as measures of overall public service provision in the locality.
We have reason to believe that parents picking "cheaper" schools is an unlikely event in the Ecuadorian public education context. As mentioned before, assignment to the treatment or comparison group is done at the school level, not at the individual level. Based on the existing evidence, certain school characteristics are observed to be positively correlated with school participation in the program: rural location, incomplete status, poor public service provision and participation in the free lunch and free breakfast initiatives. It is very unlikely that students who reside in poorer areas where such schools are located can effectively choose and self-select into an establishment that does not charge at enrolment. Even if the student is willing to look for an institution that does not charge the enrolment fee, the costs in terms of time and money associated with the search and transfer into the new institution would be significant. This restriction is particularly important in rural areas, or in urban areas where the supply of places at public schools falls far from demand for free education services.22 If a pupil wishes to change schools, most likely she will have to change her place of residence. In our sample, out of 4,978 public primary school students that appear in both 2007 and 2008 rounds, only 6 percent, 301 pupils, report ever having lived in a different parroquia. Out of those who moved, only 44 pupils have moved in the last year.23 Finally, one of the limitations of our empirical strategy is that it only allows us to study the effect of the transfer on the outcomes of the students that were initially enrolled in the 2007-2008 school year and that therefore have positive probability of belonging to the treatment group. There are 928 students in the panel that were not enrolled in school during the 2007-2008 school year (8.16% of the sample). Three hundred and seventy-five of these students report being enrolled in the 2008-2009 school year. It is possible that the elimination of school fees had an effect on student at the margin of the decision to return to school or to continue out of the system. A credible counterfactual for these students has not been identified and therefore the effect of the elimination of school fees on their enrolment status cannot be estimated.24
V. Estimating the Propensity Score
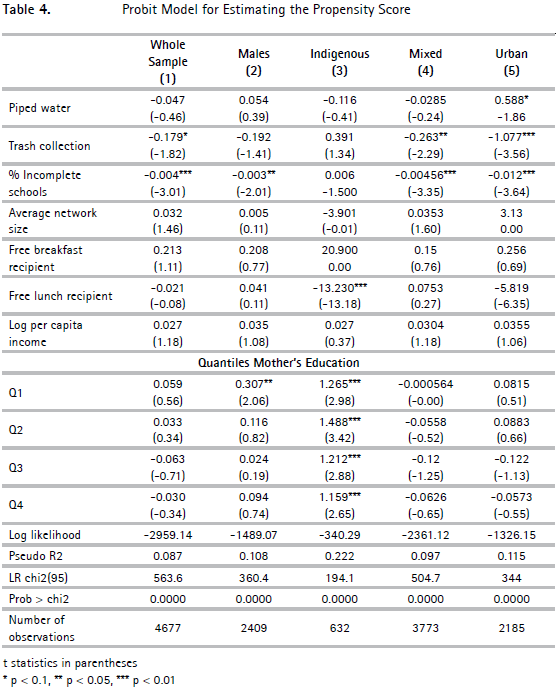
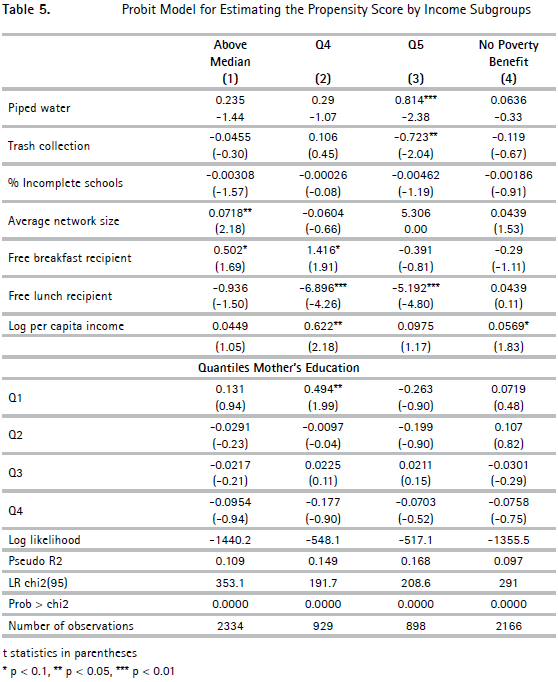
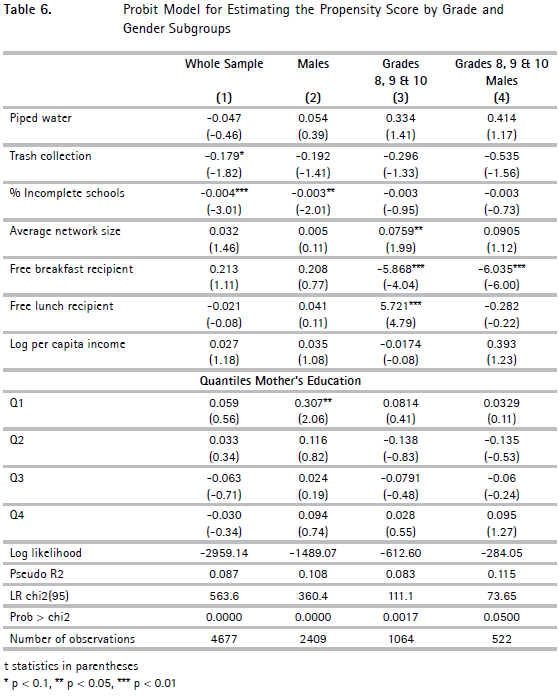
The propensity score is the probability of having received the treatment; in this case, the probability a student of a public school in Ecuador has of not having to pay at the time of enrolment at the beginning of the 2007-2008 school year; formally  (X ) . The score was obtained estimating a Probit model that included variables affecting the probability of participation in the program and the outcome simultaneously, and that are not affected by participation (Sianesi, 2009). The dependent variable is a binary indicator that takes the value of 1 if the student did not make any payment at the time of enrolment in the 2007-2008 academic year and the value 0 if she did have to make a payment. The probability of receiving the transfer (X ) is predicted for each student in both treatment and comparison groups, conditional to a vector of observed characteristics X. The variables have been chosen based on economic theory and our knowledge of the institutional setting.
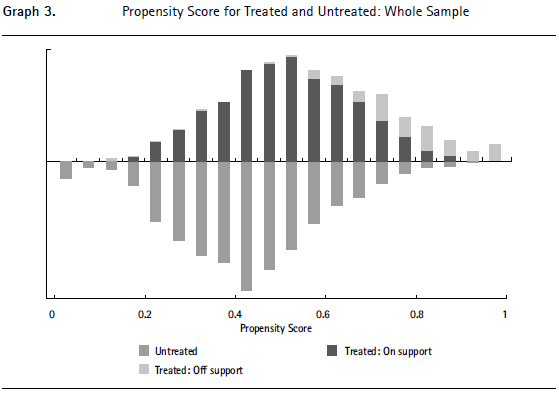
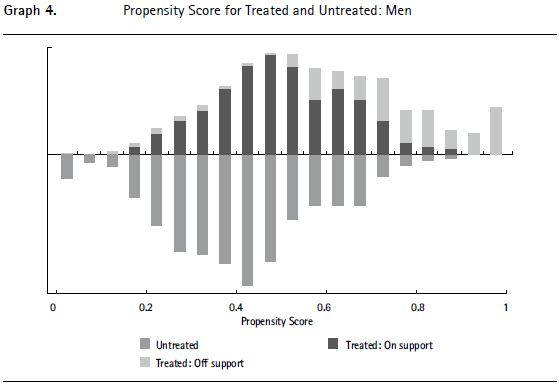
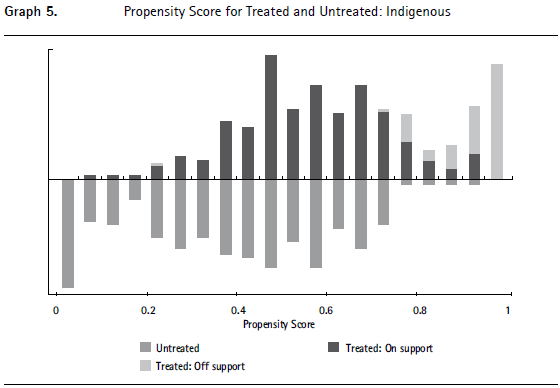
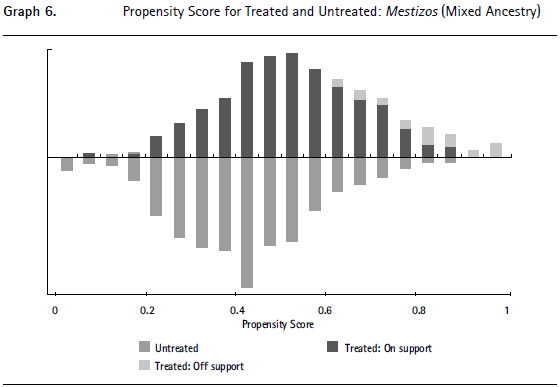
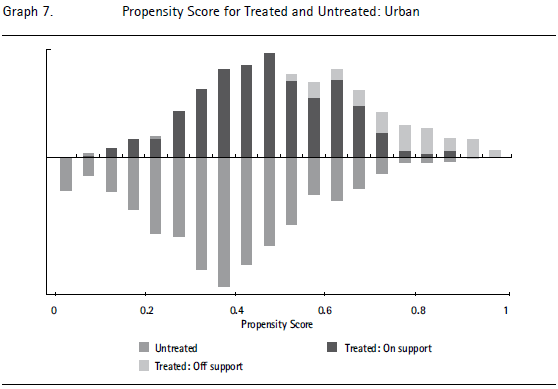
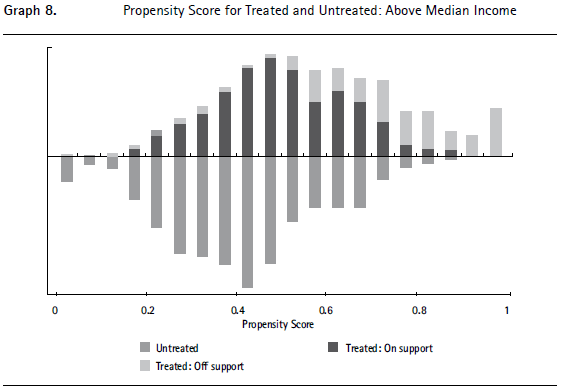
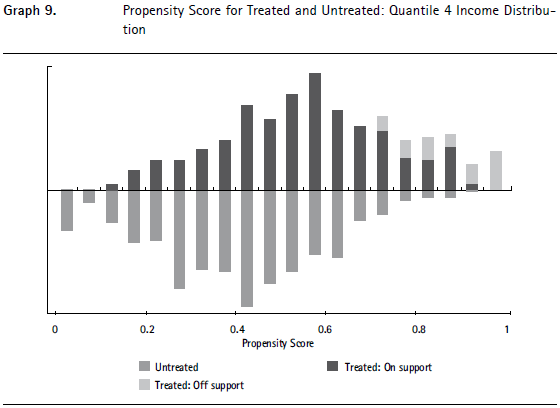
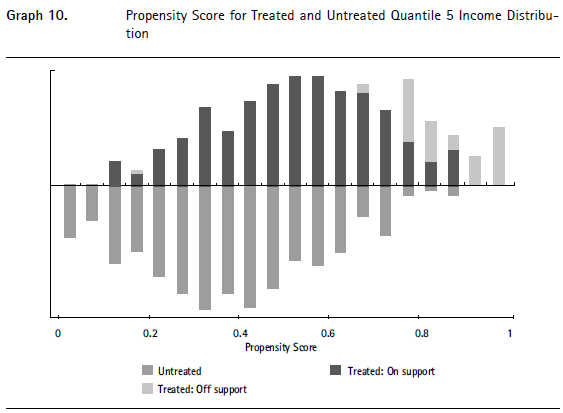
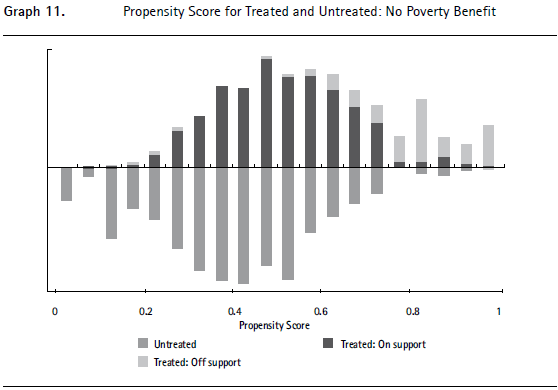
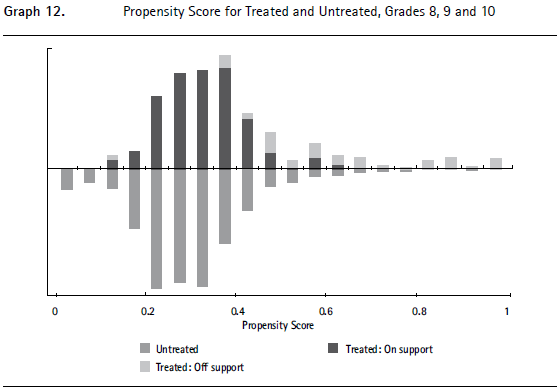
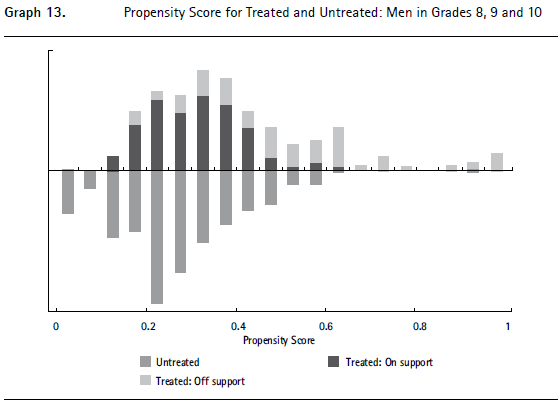
Tables 4, 5 and 6 present the results of Probit specifications for the entire sample of individuals aged 5 to 15 and for sub-groups for which matching was done separately.25 Coefficients on interaction terms are not reported. Overall, I observe the percentage of incomplete schools to be the variable with the strongest negative association with participation.26 In small samples such as ours, there is also a trade-off between including a richer set of variables in the Probit and the variance of the estimates (quality of the matching) (Black and Smith, 2003). Graphs 3 to 13 report the histograms of the estimated propensity scores and regions of common support for the two groups in the whole sample and in selected sub-samples.
The complete matching procedure (calculating the propensity score, matching estimations, checking of common support and balancing of covariates) was run separately for different sample subgroups for reasons related to the important demographic group differences in access to education and public services in Ecuador. From a policy point of view, and given that the implementation of the initiative did not include any targeting consideration, it is important to assess its effect on specific excluded segments of the population. In addition, if factors such as gender, area of residence, ethnicity or income level play a differential role in determining participation and outcome, adding dummy indicators for these variables in the Probit does not guarantee a matching of good quality, since they are only a subset of all variables used in the estimation (Heckman, Ichimura and Todd, 1997; Heckman, Ichimura, Smith and Todd, 1998). Matching on subpopulations improves the quality of matches by forcing a perfect match on these variables and helps eliminate any bias due to group differences in the support of other covariates between treated and untreated students.
When implementing the matching, the students of the group that did not make a payment at enrolment are paired with students that did pay based on their estimated probability or propensity score:

The outcome yi of treated student i is compared with the outcome  i given by the weighted outcome of her or his "neighbors" (in terms of probability) in the comparison group:
C0(pi) = group of neighbors of treated student i in the untreated group, D = 0. wij = weight assigned to the untreated student j for comparison with treated student i.
We use caliper matching with replacement in order to increase the average quality of matching and to decrease bias.27 In most estimations, I use a caliper of 0.001, restricting the distance between treatment and comparison observations to 0.1 percentage points. This method helps to avoid bad matches, but it allows the possibility that a particular treated unit cannot be matched to a control. For this reason, a caliper of 0.005 is used in smaller subgroup samples. Alternatively, I use the scores of the ten nearest neighbors that have not received the treatment to compare them with each treated observation. This reduces variance since more information is used to construct the counterfactual. The ten neighbors are weighted uniformly.
A concern related to external validity is the risk of extrapolating results outside the region where there is overlap in the distribution of the propensity scores between the two groups; that is, where students receiving the transfer do not have a counterpart. To avoid this problem, I restrict the matching only to those observations where common support of the propensity score distributions exists. The treatment effect for the treated students outside this region cannot be estimated.28 In most estimations, a proportion of 85 percent to 95 percent of observations are inside the common support. Graphs 3 to 13 also show the overlap of the propensity score matching distributions and the proportion of treated students off the common support.
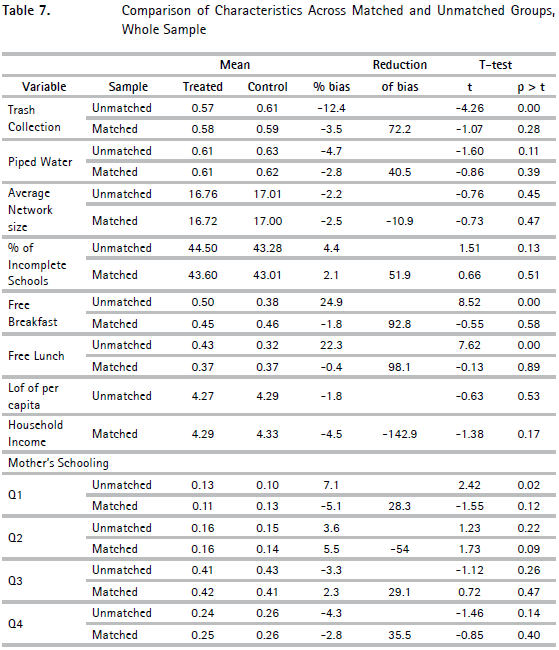
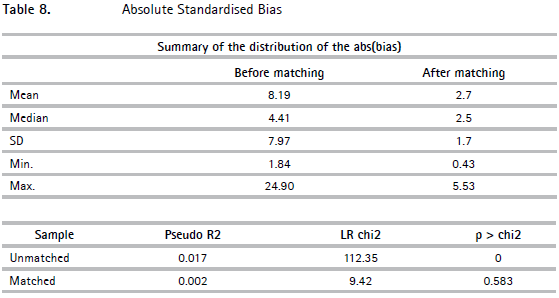
We explore whether the matching procedure was able to balance the distribution of relevant variables in the treatment and comparison groups. Table 7 contains t-tests for equality of means in the treated and untreated groups, before and after matching for the whole sample.29 Differences in means between groups are expected before matching. In our sample, statistically significant differences between treatment and comparison groups in the means of Trash Collection, Piped Water, Free Breakfast, Free Lunch, and the first quintile of Mother's schooling can be seen before matching. After matching, there are no statistically significant differences between means in any variable. Matching seems to increase bias for log of Household Income and quintile 2 of Mother's education, but the difference between means does not reach statistical significance.
Sianesi, (2008) suggests comparing the pseudo R2 from a Probit estimation of the propensity score before matching, and the pseudo R2 from the same Probit on the matched sample. After matching, the R2 should be lower, since there should be no systematic differences in the distribution of covariates. In our sample, the R2 after matching decreases by one order of magnitude.30 In a joint test of no significance of regressors, the null is rejected in the before matching sample, but is not rejected in the matched sample. Table 8 shows the statistics before and after matching and summary indicators of the distribution of absolute value of bias before and after matching.
VI. Results
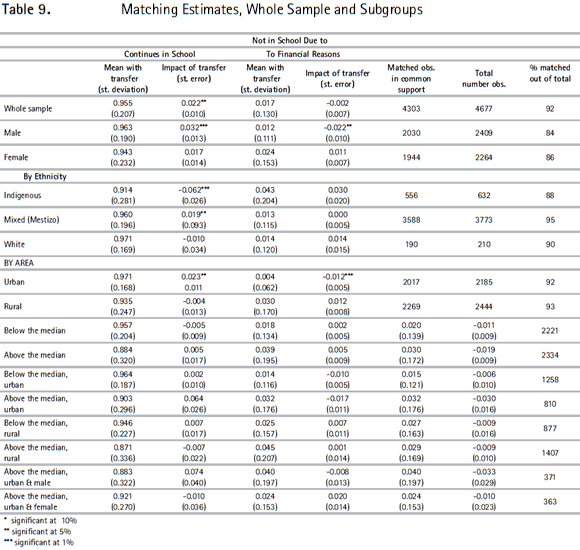
Tables 9 to 11 in the Appendix show results of the estimations. Standard error are obtained through bootstrapping. The estimated mean impact of the elimination of the enrolment school fee in Ecuador is an increase of 2 percent in the continuation rate of students enrolled in the 2007-2008 academic year, for the whole sample. The small size of the effect is expected since enrolment is already above 95 percent and, therefore, the marginal individual is more difficult to reach. The effect is comparable to the 1 to 3 percent increase in school participation after a conditional cash transfer found by Attanasio et al. (2010) in Colombia following the implementation of a conditional cash transfer program, and with the 3 percent increase in enrolment found by Barrera-Osorio Linden and Urquiola (2007) following the elimination of primary school fees in Bogota. Our estimates are, however, smaller than the 10 percent increase in enrolment found by Schady and Araujo (2006) for Ecuadorian children from families around the first quintile of the poverty index that receive a poverty benefit payment. This difference in magnitude of the effect is probably related to the lack of targeting of the elimination of school fees.
Our results suggest heterogeneous effects of the program depending on the gender of the individual. There is a 3 percent positive difference in enrolment in the 2008-2009 school year for those male students who did not have to pay the fee. The difference for girls is only half of that of boys (1.7 percent), and is not statistically significant. Moreover, the proportion of male students who dropped out due to financial reasons is of 2.5 percent in the untreated group, but only of 0.3 percent among treated students. The difference is statistically significant. The demand for schooling of male students seems to be more elastic to changes in price.
Heterogeneous effects are also observed in relation to ethnicity and area of residence. Indigenous students that receive the transfer are less likely to be enrolled in school the following year. The negative difference is of 6.2 percentage points. In contrast, students of mixed descent (mestizos) that make up the largest percentage of the population, show a positive effect of the program, with the difference between treated and untreated individuals equal to 2 percentage points. The reduced sample size of white students does not allow a precise estimation of the difference in this group.
The elimination of school fees seems to have an effect in urban areas but not in rural ones. There is very little difference in the magnitude of the proportion of students continuing in school in rural areas, and no statistical difference between groups. In contrast, in urban areas, there is a 2.3 percentage point positive and significant difference in continuation between students who did not have to pay and those who did. The proportion of urban students who dropped out due to financial reasons is of 1.5 percent in the untreated group, but only of 0.4 percent among treated students. The difference is statistically significant.
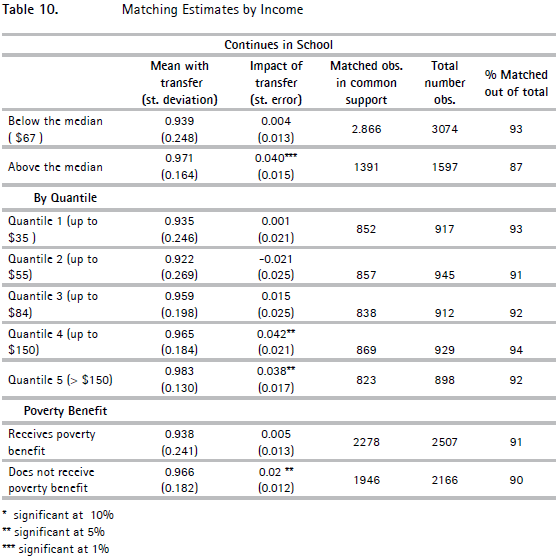
In Table 10, I partition the sample by income subgroups and compare the differences in the proportion of students enrolled in school in 2007 who were still enrolled in 2008 between groups. The partition forces a more exact match on income strata. The income variable is defined as the aggregated monthly household income divided by family size. I also divided the sample between those students whose families receive a poverty benefit (Bono de Desarrollo Humano) and those who did not.31 Overall, the elimination of the school fee does not have an impact in continuation for poorer households in spite of the fact that the proportion of students who abandon education in 2008 is higher for that group.
Individuals that come from families in the bottom half of the monthly per capita income distribution; that is with less than 67 dollars per family member per month, show almost no difference (0.04 percent) in the continuation rate magnitude and no statistical significance between treatment and comparison groups. I find a positive statistically significant and much higher in magnitude difference (4 percent) between groups in enrolment in 2008 for those students above the median of the per capita family income distribution. In the same way, the results show a statistically significant difference of 4 percentage points between those students who paid and those who did not only in quintile 4 (85 to 150 dollars per family member) and quintile five (more than 150 dollars per family member) when the sample is partitioned in five income quintiles. The elimination of the fee seems to have a positive and statistically significant impact of 2.5 percentage points for those students from families who are not recipients of the poverty subsidy. The difference between treated and untreated individuals amongst the beneficiaries of the poverty subsidy is of 0.05 percentage points and is not statistically significant.
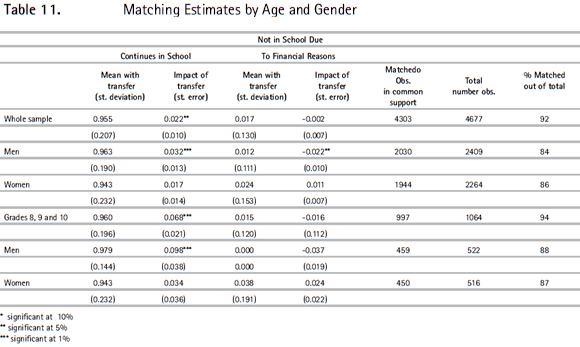
Table 11 shows the results of the matching procedure performed only for those students in the last three years of basic education, grades 8, 9 and 10. These grades correspond to the first three years of secondary school.32 Since the net enrolment rate in secondary school in Ecuador (51 percent) is much lower than the enrolment rate in primary school (92 percent), I would like to explore the intervention's impact on this group.33 A reduction of school fees would affect students who would have been indifferent between staying in school or dropping out before the policy change. For younger students, user fees clearly influence the decision to enter-or not-into the education system, and to stay enrolled. Nonetheless, demand for schooling at younger ages may be pretty inelastic to price changes due to the already high gross enrolment rate in primary schooling in many parts of the world. In addition, the reduced monetary value of child labor diminishes the opportunity cost of schooling.34 A student at the margin of the educational decision in this age group would perhaps belong to a severely income constrained household, or be at the very bottom of the distribution of ability. Price-elasticity of the demand for schooling-and, thus, the effect of the program-may be greater for older students. The value of forgone wages becomes more important for older students, particularly in urban settings where active labor markets exist. Since dropout rates increase with age, older students at the margin, induced to stay in the education system by the elimination of fees, would be more spread out along the ability distribution and constitute a more numerous group.
There is a seven percentage point positive difference in enrolment in the 2008-2009 school year for those students enrolled in 2007 and attending the last three years of basic education who did not have to pay the fee, making the continuation rate 96 percent for this group, versus 81 percent for those who did have to pay. The impact of the program is twice as big for secondary school students when compared with the whole sample.
Heterogeneous effects by gender are shown for this subgroup of older pupils. There is a 10 percentage point positive difference in enrolment in the 2008-2009 school year for those male secondary school students who did not have to pay the fee. The difference for girls is much smaller (3.4 percentage points), and is not statistically significant. The demand for schooling of males in this age groups shows higher price elasticity compared to the demand of female students.
A. Robustness Checks
1. Sensitivity Analysis
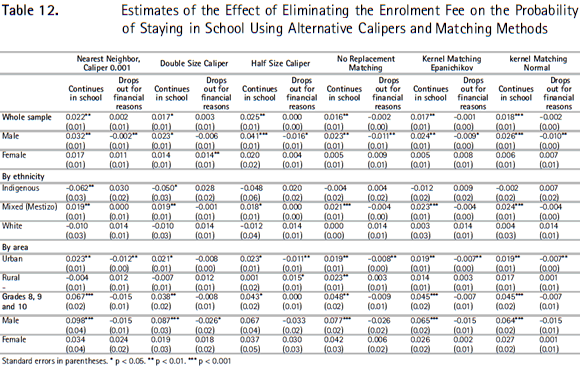
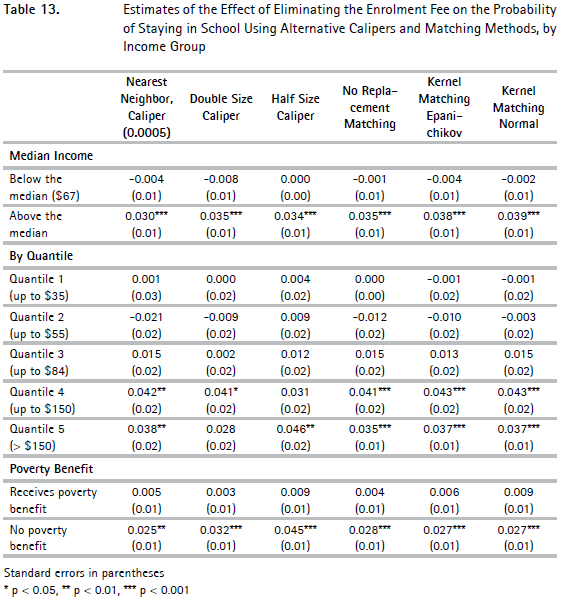
To check for the robustness of the results, alternative specifications were used to explore the effects of the elimination of enrolment fees on the continuation rate. Asymptotically, the choice of kernel and neighborhood used in matching would make no difference, since as the sample approaches infinity, matches are more and more exact. However, in small samples, these choices may influence the results through a trade-off between matching quality and estimate variance. I perform the matching procedure again using: a) the original kernel and caliper, b) a caliper twice as big as the original, c) a caliper half the size of the original, d) nearest neighbor with no replacement, e) matching with Epanechikov kernel, f) matching with Gaussian kernel. A priori, I know that smaller size calipers and no replacement matching improve the quality of matches, but increase the variance of the estimator. Kernel matching and bigger size calipers use more information to construct the counterfactual and reduce variance, but may result in poorer quality matches (Caliendo and Kopeining, 2005). Tables 12 and 13 show results are robust to changes in the implementation of the estimator.
2. Sample excluding students who moved during the previous year
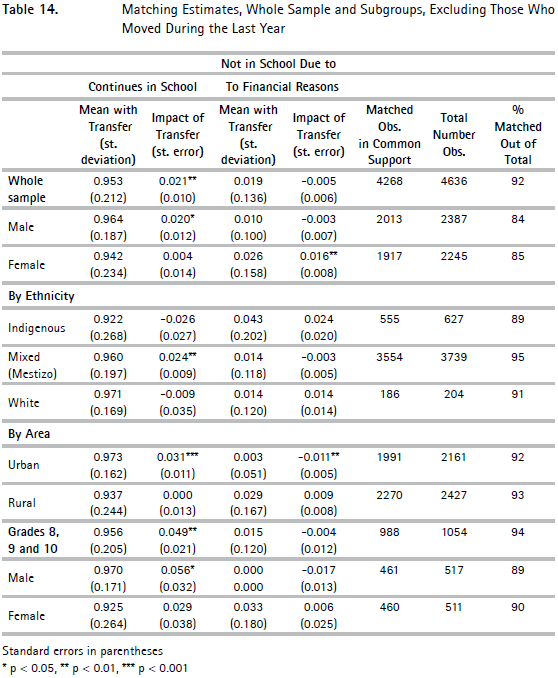
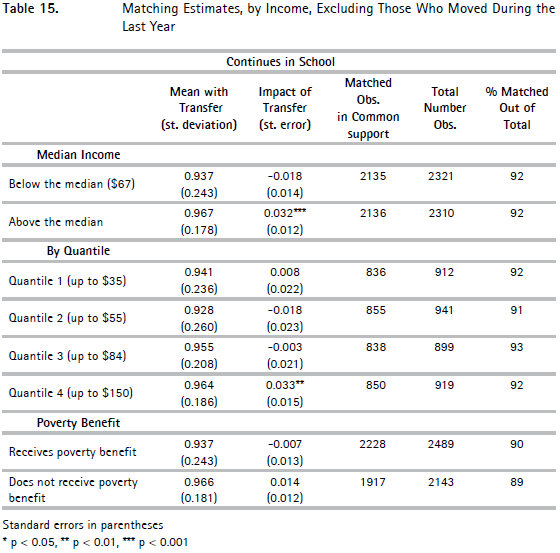
A potential concern with the research design is that unobserved heterogeneity may cause participation in the program and the continuation rate to be correlated. Although, the assignment of school principals to a particular network is undertaken at the Ministry of Education's central level, and the funds are allocated every year after the enrolment period has ended contingent on the principal's request, it is still possible that more able or more informed parents would move to be closer to a school that does not charge.35 In order to rule out parents self-selecting into participating schools by changing residence, estimations were performed on a sample that excluded all students that report living in a different parroquia during the previous 12 months. Running the estimations on the sample that excludes those who moved during the previous year helps show the robustness of our results to potential selection bias due to student unobservables.36 Tables 14 and 15 in the paper show that excluding students who moved to a different parroquia during 2006 does not substantially change the magnitude or the level of significance of any of our findings. When I explore heterogeneity related to income level, I do not find substantially different results either, except that the benefit of the program for students who do not receive the poverty benefit is positive but not statistically significant.37
VII. Conclusions
In 2006, the Ecuadorian government eliminated the enrolment fee paid in public schools in an effort to reduce the barriers to entry into the education system and decrease direct costs of schooling. This paper is the first econometric evaluation of the impact of the program. The way in which it was implemented did not permit the application of an experimental design and I have estimated the effects of the initiative using propensity score matching estimation. Subject to several conditions for which I find support in the data, this technique yields credible and robust estimates of the program's causal effect.
Overall, results suggest that the program had non-negligible and positive effects on the probability of continuing in school one year after the intervention for those students enrolled in the 2007-2008 school year, in spite of already high enrolment and continuation rates. The estimated difference between paying and non paying students in continuation rates is around 2 to 4 percentage points and is in line with recent similar studies. There are, however, striking differences in gains according to demographic characteristics. Male, urban and non-poor students seem to benefit from the initiative. The estimates suggest that the program has no effect for female, rural or poorer students. These groups are considered to be more excluded from the education system and more at risk of dropping out. When I look only at the sub sample of students in secondary education, I find significant differences in continuation rates between groups, much higher in magnitude than the differences found for the entire sample. The effects are particularly large for male secondary school students. This intervention seems to be more effective at the secondary level than at the primary level, probably due to the already high baseline level of enrolment and low price-elasticity of demand in primary school. Other research finds similar results, both in terms of magnitude and higher impact at higher levels of schooling.38 At higher levels of enrolment, the marginal individual in primary school is much harder to reach, and a one-off $25 reduction may not make a difference for pupils at the margin. The price elasticity of schooling seems higher for male students, and particularly for those enrolled in later years of the system.
The substantial degree of heterogeneity in the effect of the program in different sample groups and, in particular, the lack of impact found for females and for pupils from rural and poorer households is puzzling. It is possible that rural, poorer and female students face different distributions of perceptions of future earnings and employment risks that make their decision to stay in school inelastic to the subsidy (Attanasio and Kaufmann, 2009). Additionally, a reduction of $25 in the cost of schooling may not be a sufficiently high, as a proportion of household expenditure, for families in the lower half of the income distribution or those receiving the poverty benefit. If so, I should expect to find, as I do, an effect of the treatment only on those households that are not too severely income constrained. Similarly, households may be substituting paid child labor for schooling after the price of education has gone down. This would explain the impact observed in urban areas and for male students.
Most previous studies report positive differential effects by students' gender.39 In contrast, our results suggest that Ecuadorian girls have not benefited from the elimination of the enrolment fee. Since women's decision to stay in school does not seem to be related to mother's schooling or household income in our estimations, I cannot rule out intra-family decision processes about human capital investments that relate to expectations of perceived returns in the labor and marriage market, and do not favor girls' schooling. The results obtained for indigenous students are hard to interpret and point to the need for more research in order to understand supply and demand dynamics in the education market for this ethnic group.
There are clear policy implications emerging from the results. The decision to continue in school may be based on the opportunity costs and expectations of future returns -monetary and non monetary-to education faced by each student, and these may differ for different individuals. A careful analysis of the reasons why different groups of children drop out of the education system is needed to design successful interventions in Ecuador. Given that enrolment in basic education in Ecuador is higher than 90 percent, any education policy intervention should make use of targeting. Universal interventions are not always efficient, nor effective in reaching the intended segment of the population. Programs that do not incorporate a targeting or conditionality mechanism can have results that do not reach their objectives in regards to more at-risk students. The results of the estimations show that policy makers trying to reach children from vulnerable groups with this policy have failed. In addition, this research exercise highlights the importance of (or the lack of) appropriate data collection in less developed countries that would permit rigorous econometric evaluation of policies. The gathering of information should be planned from the design of the intervention, and should include baseline measurements. Without these inputs, it is not always possible to determine the causal effects of government programs, and their impact on people's lives.
_____________________________
Foot notes
2 Education expenses as a proportion of total household expenditure in 2005 were reported by the World Bank to be 12 percent in Honduras, 8 percent in El Salvador, 18 percent in Indonesia and 16 percent in Ecuador. Bentaquet-Kattan (2006).
3 The survey by Tsang (1994) finds that direct costs are a financial burden for households in less developed countries. Brock and Cammish (1997); Brown and Park (2002); Colclough et al. (2000); Hunter and May (2003); Liu (2004); Mukudi (2004); Rose and Al Samarrai (2001) Brown and Park (2002); Colclough et al, (1996; Hunter and May (2003); Liu (2004); Mukudi (2004) show evidence that costs off schooling, including fees, are an important reason for dropping out.
4 December 2007 round of the National Employment and Unemployment survey (Enemdu).
5 Once students drop out, there are very few opportunities-if any-to go back. Developing countries are characterized by scant provision of public or private adult education services.
6 Betanquet-Kattan (2006) provides a survey of this approach.
7 See Unicef and World Bank (2009) for Uganda; Watt and Rowden (2002) and Alonso I Terme (2002) for Tanzania.
8 There seems to be no specific reason why the transfer was undertaken as "per family." Officers at the Ministry of Education were not able to provide any rationale as to why the transfer was designed in this way. As with some other early policies of the Correa government, this choice seems to have been made in an ad hoc manner, perhaps with the goal of capping the total amount of funds dedicated to the program by the central government.
9 Interview with Jimena Nieto Jara, National Division of Analysis and Education Information, Ministry of Education and Culture of Ecuador, September, 2014.
10 Interview with Jose Barahona, Financial Management Division, Ministry of Education and Culture of Ecuador. June, 2009.
11 It would be difficult for network tesoreros to get a hold of the subsidy, since the money would not be transferred to the network unless it was already allocated to a particular school, contingent on its enrolment numbers. The allocation was effective only after the enrolment period had ended, and the school principal had done all necessary paper work to request the transfer, based on the number of students registered that academic year. The tesorero could not pocket money in transit.
12 The survey was carried out by Senplades, the National Planning and Development Secretariat. The survey took place in 2008 and asked school staff about the reception of the transfer during 2007.
13 The subsidy-along with others-is cited as one of the reasons for continued political support for the current government and its success in securing a second term in the April 2009 elections.
14 No school identifier is contained in the household survey, and therefore, it is not possible to match respondents to the school they attend, and thus check if all students going to the same school report the same treatment status.
15 In this section I use the notation in Heckman, Ichimura and Todd (1998).
16 The degree of overlap in the distribution of the propensity score for treatment and comparison groups can be checked graphically. Lechner and Strittmatter (2014).
17 Instituto Nacional de Estadísticas y Censos, INEC (2010). All panel designs with a quarter-to-quarter overlap foresee an overlap of 50 percent of the original sample.
18 Enemdu data is collected every quarter, and the data from the December round is nationally representative. The sample design consists of three stages where random selection of Primary Sampling Units, Clusters and households is staggered. INEC (2010).
19 Ecuador is divided in 22 provinces, 215 counties and 1,306 parroquias.
20 In that case, the conditional independence assumption would not hold.
21 Interview with Heidi Ocampo, Inclusive Projects Coordinator, Ministry of Education and Culture of Ecuador. July, 2009.
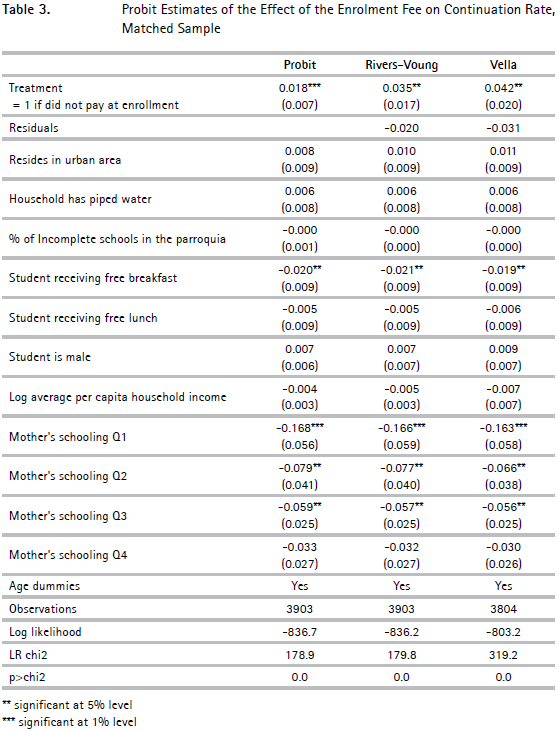
22 Rivers-Voung (1988) and Vella (1992) tests were performed to examine the presence of endogenous selection into the program. In both tests, the additional variable accounting for endogenous selection was not statistically significant. The estimates of the effect of the treatment on the probability of continuing in school are consistent under the null hypothesis of exogenous participation, and are presented in Table 3 of the Appendix.
23 As a robustness check, estimations were performed on a sample that excluded all students that report living in a different parroquia during the previous year. Results are qualitative similar to the main findings, and are presented in Table 13.
24 The proportion of all children aged 5 to 12 in the Enemdu survey that are not enrolled in school is 3 percent of the total number of students of this age group. These students attend grade 1 to 7 (primary school). The high enrolment rate is related to the low price elasticity of the demand for schooling, and presumably children not enrolled belong to severely income constrained households, or are at the very bottom of the distribution of ability. There is a much bigger proportion of students aged 13 to 16 (20 percent of the age group) that are not enrolled in the school year 2007-2008. These students attend grades 8 to 10 (lower secondary education).
25 I report Probit results and common support graphs only for those sub-groups with statistically significant results in matching. Results for other sub-groups are available upon request.
26 Caliendo and Kopeining (2005). The results of the propensity model should not be interpreted as an exploration of the "determinants" of participation. They do not bear any behavioral interpretation and their main function is to allow the balancing of all covariates in the treatment and comparison groups.
27 An untreated student can be used more than once as a match for a treated one even if it has been paired before. The caliper imposes a cap on the maximum distance between the propensity score of two matched observations.
28 Caliendo and Kopeining (2005). For estimating the ATT, it is sufficient to ensure the existence of matches in the propensity score. ATE requires that the different combinations of characteristics in the comparison group also occur in the treatment group.
29 The reduction in standardised bias after matching is also included. Rosenbaum and Rubin (1985).
30 This Probit estimation does not include interactions between variables and therefore, the pseudo r2 before matching is lower than the one reported previously in Table 4.
31 At the time of the survey, the BDH targeted households in the bottom two quintiles of the SELBEN poverty index and transferred 30 dollars per month to beneficiaries. The SELBEN (Sistema de Identificación y Selección de Beneficiarios) is a continuous index of socioeconomic characteristics used for targeting of social programs in Ecuador.
32 According to Ecuadorian law, school attendance is mandatory up to grade 10.
33 Figures for 2008. Gross enrolment rates for primary and secondary school were 101 percent and 63 percent, respectively. Unesco (2009).
34 Glewwe and Kremer (2006). In addition, most countries have legal regulations making primary education compulsory.
35 I have provided evidence in Table 3 that self-selection is not a concern, but include these results for robustness purposes.
36 Estimations for the sample that excludes all students that report ever having lived in a different parroquia, and estimations from a sample that trims the top and bottom 5% of the distribution of the propensity score, yield results consistent in size and level of significance to the results from the whole sample. These estimates are available upon request.
37 The Probit for the propensity score for the fifth quantile of income does not converge, so I do not estimate the impact of the program for this subgroup.
38 For example, Barrera-Osorio (2008) for the Gratuidad program in Bogota, and Schultz (2004) for Oportunidades in Mexico.
39 Deininger (2003) finds an equalization of enrolment rates between females and males after three years of fee abolition in Uganda. Nishimura, Yamano and Sasaoka (2008) find that the decrease in delayed enrolment and increase in grade completion were larger for girls in poor households. In Grogan (2009), the probability of entering school on time after the elimination of school fees is larger for girls, children living in rural areas, and students from poorer backgrounds. The results of Barrera-Osorio et al. (2007) for Gratuidad are asymmetrical in relation to gender and socioeconomic characteristics: the policy is more effective for boys, and for students in the first quintile of a proxy-mean index at the primary level, but more effective for girls and students in the second quantile at the high school level.
References
1. ALLCOTT, H., AND ORTEGA, D. (2009). The performance of decentralized school systems: Evidence from Fe y Alegría in Venezuela (Working Paper Series 4879). World Bank Policy Research. [ Links ]
2. ALONSO I TERME, R. (2002). The elimination of the enrollment fee for primary education in Tanzania: A case study on the political economy of pro-poor policies. Washington, D. C.: World Bank. [ Links ]
3. Al-SAMARRAI, S., AND ZAMAN, H. (2007). "Abolishing school fees in Malawi: The impact on education access and equity", Education Economics, 15(3): 359-375. [ Links ]
4. ANGRIST, J., AND PISCHKE, J. S. (2008). Mostly harmless econometrics. Princeton: Princeton University Press. [ Links ]
5. ANGRIST, J. D., BETTINGER, E., BLOOM, E., KING, E., AND KREMER, M. (2002). "Vouchers for private schooling in Colombia: Evidence from a randomized natural experiment", American Economic Review, 92:1535-1559. [ Links ]
6. ANGRIST, J.D., BETTINGER, E., BLOOM, E., KING, E., AND KREMER, M. (2006). "Long-term educational consequences of secondary school vouchers: Evidence from administrative records in Colombia", American Economic Review, 96:847-862. [ Links ]
7. ATTANASIO, O., AND KAUFMANN, K. (2009). Educational choices, subjective expectations, and credit constraints (Working Papers Series w15087). National Bureau of Economic Research. [ Links ]
8. ATTANASIO, O., FITZSIMMONS, E., AND GOMEZ, A. (2005). The impact of a conditional education subsidy on school enrolment in Colombia. Report Summary. Familias, 1. London: The Institute for Fiscal Studies. [ Links ]
9. ATTANASIO, O., FITZSIMONS, E., GOMEZ, A., GUTIÉRREZ, M., MEGHIR, C., AND MESNARD, A. (2010). "Children's schooling and work in the presence of a conditional cash transfer programme in rural Colombia", Economic Development and Cultural Change, 58(2):181-210. [ Links ]
10. ATTANASIO, O., MEGHIR C., AND SANTIAGO, A. (2007). Education choices in Mexico: Using a structural model and a randomised experiment to evaluate Progresa IFS (Working Paper EWP05/01). The Institute for Fiscal Studies. [ Links ]
11. BARRERA-OSORIO, F. (2008). "The effects of a reduction in user fees on school enrolment: Evidence from Colombia", in M. Tembon and L. Fort (Eds.), Girls' education in the 21st century: Gender equality, empowerment, and economic growth. Washington, D. C.: The World Bank. [ Links ]
12. BARRERA-OSORIO, F., BERTRAND, M., LINDEN, L., AND PEREZ, F. (2008). Conditional cash transfers in education: Design features, peer and sibling effects. Evidence from a randomized experiment in Colombia (Working Papers Series 13890). National Bureau of Economic Research. [ Links ]
13. BARRERA-OSORIO, F., LINDEN, L., AND URQUIOLA, M. (2007). The effects of user fee reductions on enrolment: Evidence from a quasi-experiment. Mimeo. [ Links ]
14. BENTAQUET-KATTAN, R. (2006). Implementation of free basic education policy (Education Working Paper Series 7). The World Bank. [ Links ]
15. BLACK, D., AND SMITH, J. (2003). How robust is the evidence on the effects of college quality? Evidence from matching (Working Papers 2003). University of Western Ontario, CIBC Centre for Human Capital and Productivity. [ Links ]
16. BROCK, C., AND CAMMISH, N. (1997). Factors affecting female participation in education in seven developing countries (Education Research Paper 9). DFID. [ Links ]
17. BROWN, P., AND PARK, A. (2002). "Education and poverty in rural China", Economics of Education Review, 21(6):523-554. [ Links ]
18. CALIENDO, M., AND KOPEINIG, S. (2005). Some practical guidance for the implementation of propensity score matching (Discussion Papers 1588). Institute for the Study of Labor (IZA). [ Links ]
19. CAMERON, C., AND PRAVIN T. (2005). Microeconometrics: Methods and applications. New York: Cambridge University Press. [ Links ]
20. CARD, D., AND LEMIEUX, T. (2000). Dropout and enrolment trends in the post-war period: What went wrong in the 1970s? (Working Papers Series 7658). National Bureau of Economic Research. [ Links ]
21. CHEVALIER, A., AND VIITANEN, T. (2003). "The long-run labour market consequences of teenage motherhood in Britain", Journal of Population Economics, 16(2):323-343. [ Links ]
22. COALITION FOR HEALTH AND EDUCATION RIGHTS. (2002). User fees: The right to education and health denied. New York: Coalition for Health and Education Rights. [ Links ]
23. COLCLOUGH, C., AND LEWIN K. M. (1993). Educating all the children: Strategies for primary education in developing countries. Oxford: Oxford University Press. [ Links ]
24. COLCLOUGH, C. (1996). "Education and the market: Which parts of the neoliberal solution are correct?", World Development, 24(4):589-610. [ Links ]
25. CONTRATO SOCIAL POR LA EDUCACIÓN EN EL ECUADOR. (n.d.), Indicadores educativos del Ecuador. Retrieved from http://www.educacionsinfronteras.org/files/87468. [ Links ]
26. DEARDEN, L., EMMERSON, C., FRAYNE, C., AND MEGHIR, C. (2009). "Conditional cash transfers and school dropout rates", Journal of Human Resources, 44(4):827-857. [ Links ]
27. DEHEJIA, R., AND SADEK W. (2002). "Propensity score-matching methods for nonexperimental causal studies", The Review of Economics and Statistics, 84(1):151-161. [ Links ]
28. DEININGER, K. (2003). "Does cost of schooling affect enrolment by the poor? Universal primary education in Uganda", Economics of Education Review, 22(3):291-305. [ Links ]
29. DURYEA, S., AND MORRISON, A. (2004). The effect of conditional transfers on school performance and child labor: Evidence from an ex-post impact evaluation in Costa Rica (RES Working Papers 4359), Inter-American Development Bank Research Department. [ Links ]
30. GALASSO, E., AND RAVALLION, M. (2004). Social protection in a crisis: Argentina's Plan Jefes y Jefas (Policy Research Working Paper Series 3165). The World Bank. [ Links ]
31. GERTLER, P., PATRINOS, H., AND RUBIO-CODINA, M. (2007). Impact evaluation for school-based management reform. Doing impact evaluation. Note # 10. Washington, D. C.: The World Bank. [ Links ]
32. GLEWWE, P., AND KREMER, M. (2006). "Schools, teachers, and education outcomes in developing countries", in E. Hanushek and F. Welch (Eds.), Handbook of the Economics of Education (chapter 16, vol. 2, pp. 945-1017). North Holland. [ Links ]
33. GOURIEROUX, C., MONFORT, A., RENAULT, E., AND TROGNON, A. (1997). "Generalized residuals", Journal of Econometrics, 34:5-32. [ Links ]
34. GROGAN, L. (2009). "Universal primary education and school entry in Uganda", Journal of African Economies, 18(2):183-211. [ Links ]
35. HANNUM, K., AND ZHANG, Y. (2009). International Journal of Educational Development, 29(5):474-486. [ Links ]
36. HECKMAN, J., ICHIMURA, H., AND TODD, P. (1998). "Matching as an econometric evaluation estimator", Review of Economic Studies, 65(2): 261-94. [ Links ]
37. HERZ, B., SUBBARAO, K., HABIB, M., AND RANEY, R. (1991). Letting girls learn (Discussion Paper 113). The World Bank. [ Links ]
38. HIRANO, K., IMBENS, G., AND RIDER, G. (2003). "Efficient estimation of average treatment effects using the estimated propensity score", Econometrica, 71(4):1161-1190. [ Links ]
39. HUNTER, N., AND MAY, J. (2003). Poverty, shocks and school disruption episodes among adolescents in South Africa (Working Paper 35). CSDS. [ Links ]
40. ICHINO, A., AND WINTER-EBMER, R. (1998). The long-run educational cost of World War II: An example of local average treatment effect estimation (Discussion Paper 1895). Centre for Economic Policy Research. [ Links ]
41. IMBENS, G., AND ANGRIST, J. D. (1994). "Identification and estimation of local average treatment effects", Econometrica, 62:467-475. [ Links ]
42. IMBENS, G. (2014). Matching methods in practice: Three examples (Discussion Paper 8049). Institute for the Study of Labor (IZA). [ Links ]
43. IMBENS, G., AND WOOLDRIDGE, J. (2007). What's new in econometrics. Lecture Notes 1, Summer. Washington, D. C.: National Bureau of Economic Research. [ Links ]
44. INSTITUTO NACIONAL DE ESTADÍSTICAS Y CENSOS, INEC. (2010). Aspectos metodológicos, encuesta de empleo, desempleo y subempleo. [ Links ]
45. KREMER, M., MOULIN, S., AND NAMUNYU, R. (2002). Unbalanced decentralization. Mimeo. Cambridge MA: Harvard University. [ Links ]
46. LECHNER, M., AND STRITTMATTER, A. (2014). Practical procedures to deal with common support problems in matching estimation, economics (Working Paper Series 1410). University of St. Gallen, School of Economics and Political Science. [ Links ]
47. LIU, F. (2004). "Basic education in China's rural areas: A legal obligation or an individual choice?", International Journal of Educational Development, 24:5-21. [ Links ]
48. LUNA TAMAYO, M. (2006). "La educación en los últimos años en el Ecuador: situación y propuestas", Cuadernos del Contrato Social por la Educación, 4(n. pag). Quito: Contrato Social por la Educación. [ Links ]
49. MACCINI, S., AND YANG, D. (2009). "Under the weather: Health, schooling, and economic consequences of early-life rainfall", American Economic Review, 99(3):1006-26. [ Links ]
50. MINISTERIO DE COORDINACIÓN DE DESARROLLO SOCIAL DEL ECUADOR. (2010). Sistema Integrado de Indicadores Sociales-SIISE. Quito: Unidad de Información y Análisis de la Secretaría Técnica del Ministerio de Coordinación de Desarrollo Social del Ecuador. [ Links ]
51. MINISTERIO DE EDUCACIÓN DEL ECUADOR. (15 June 2009). Contribución voluntaria. Retrieved from http://www.educacion.gov.ec/pages/interna.php?txtCodiInfo=114. [ Links ]
52. MINISTERIO DE EDUCACIÓN DEL ECUADOR. (15 May 2006). Acuerdo Ministerial No. 250. Quito: Registro Oficial. [ Links ]
53. MINISTERIO DE FINANZAS, MINISTERIO DE COORDINACIÓN DE DESARROLLO SOCIAL AND UNICEF. (2010). Cómo va la inversión social No. 28: ejecución presupuestaria en el sector social durante el período eneroagosto del 2008. [ Links ]
54. MUKUDI, E. (2004). "The effects of user-fee policy on attendance rates among Kenyan elementary school children", International Review of Education, 50(5-6):447-461. [ Links ]
55. NISHIMURA, M., YAMANO, T., AND SASAOKA, Y. (2008). "Impacts of the universal primary education policy on educational attainment and private costs in rural Uganda", International Journal of Educational Development, 28(2):161-175. [ Links ]
56. OBSERVATORIO DE LOS DERECHOS DE LA NIÑEZ Y ADOLESCENCIA ECUADOR. (Aug 2004). Observatorio, 5, 5. [ Links ]
57. OREOPOULOS, P. (2007). "Do dropouts drop out too soon? Wealth, health and happiness from compulsory schooling", Journal of Public Economics, 91(11-12):2213-2229. [ Links ]
58. RIPHAHN, R. (2010). "The effect of secondary school fees on educational attainment", Scandinavian Journal of Economics, 114(1):148-176. [ Links ]
59. RIVERS, D., AND VOUNG, Q. H. (1988). "Limited information estimators and exogeneity tests for simultaneous Probit models", Journal of Econometrics, 39:347-366. [ Links ]
60. ROSE, P., AND AL SAMARRAI, S. (2001). "Household constraints on schooling by gender: Empirical evidence from Ethiopia", Comparative Education Review, 45(1):36-63. [ Links ]
61. ROSENBAUM, P., AND RUBIN, D. (1983). "The central role of the propensity score in observational studies for causal effects", Biometrika 70:41-55. [ Links ]
62. ROSENBAUM, P., AND RUBIN, D. (1985). "Constructing a control group using multivariate matched sampling methods that incorporate a Propensity Score", American Statistical Association, 39:33-38. [ Links ]
63. RUBENS, D. B., AND THOMAS, N. (1996). "Matching using estimated propensity scores: Relating theory to practice", Biometrics, 52:249-264. [ Links ]
64. SCHADY, N., AND ARAUJO, M. C. (2006). Cash transfers, conditions, school enrolment, and child work: Evidence from a randomized experiment in Ecuador (Working Paper Series 3930). The World Bank. [ Links ]
65. SCHULTZ, T. P. (2004). "School subsidies for the poor: Evaluating the Mexican progresa poverty program", Journal of Development Economics, 74(1):199-250. [ Links ]
66. SENPLADES: SUBSECRETARÍA DE SEGUIMIENTO Y EVALUACIÓN DEL ECUADOR. (2008). Encuesta Hilando el Desarrollo, Planteles. [ Links ]
67. SIANESI, B. (2008). Notes. Cemmap Course on Programme Evaluation. [ Links ]
68. SIISE. (2014). Sistema Integrado de Indicadores Sociales del Ecuador. Last modified August 11, 2014, from http://www.siise.gob.ec/siiseweb/. [ Links ]
69. SKOUFIAS, E., AND SHAPIRO, J. (2006). Evaluating the impact of Mexico's quality schools program: The pitfalls of using non experimental data. World Bank Policy Research (Working Paper Series 4036). The World Bank. [ Links ]
70. TRUJILLO, A., PORTILLO, J., AND VERNON, J. A. (2005). "The impact of subsidized health insurance for the poor: Evaluating the Colombian experience using propensity score matching", International Journal of Health Care Finance and Economics, 5(3):211-239. [ Links ]
71. TSANG, M. (1994). "Costs of education in China: Issues of resource mobilization, equality, equity, and efficiency", Education Economics, 2(3):287-312. [ Links ]
72. UNESCO. (2002). Education for all: Is the world on track? Paris: Unesco Publishing. [ Links ]
73. UNICEF AND WORLD BANK. (2009). Abolishing school fees in Africa: Lessons from Ethiopia, Ghana, Kenya, Malawi, and Mozambique. Washington, D. C.: World Bank. [ Links ]
74. VACA ESPÍN, C. (2004). Diagnóstico de la situación de los programas sociales de alimentación del Gobierno ecuatoriano y propuesta de un modelo de gestión. Unpublished Master's Thesis, Quito: Flacso sede Ecuador. [ Links ]
75. VELLA, F. (1992). "Simple tests for sample selection bias in censored and discrete choice models", Journal of Applied Econometrics, 7:413-421. [ Links ]
76. VERMEERSCH, C., AND KREMER, M. (2005). School meals, educational achievement, and school competition: Evidence from a randomized evaluation (World Bank Policy Research Working Paper Series 3523). The World Bank. [ Links ]
77. WATT, P., AND ROWDEN, R. (2002). User fees: The right to education and health denied (Policy brief for the UN special session on children). New York: Coalition for Health and Education Rights. [ Links ]
78. WOOLDRIDGE, J. M. (2001). Econometric analysis of cross section and panel data. Boston MA: The MIT Press. [ Links ]
79. WOOLDRIDGE, J. M. (2009). Estimating average treatment effects: IV and control functions. BGSE/IZA Course in Microeconometrics. Class Notes. in Microeconometrics. Class Notes. Retrieved from http://www.iza.org/teaching/wooldridge-course-09/course_html/docs/slides_iv_3_r1.pdf. [ Links ]
80. WORLD BANK. (2009). Abolishing school fees in Africa: Lessons from Ethiopia, Ghana, Kenya, Malawi, and Mozambique. Washington, D. C.: The World Bank. [ Links ]
Appendix 1. Graphs and Tables