


Services on Demand
Journal
Article
 English (pdf)
 Article in xml format
 Article references
 Send this article by e-mail
Indicators
-
 Cited by SciELO
 -
 Access statistics
Related links
-
 Cited by Google
 -
 Similars in
SciELO
Similars in
SciELO -
 Similars in Google
Share

 Permalink
Desarrollo y Sociedad
Print version ISSN 0120-3584
Desarro. soc. no.74 Bogotá July/Dec. 2014
https://doi.org/10.13043/DYS.74.6
DOI: 10.13043/DYS.74.6
The Effects of Bullying on Academic Achievement
Desempeño académico y ambiente escolar: efecto de la intimidación
Cynthia van der Werf1
1 Universidad de los Andes. Bogotá, Colombia. I am grateful to Catherine Rodriguez for her advice, to Enrique Chaux and Sara Schodt for their valuable comments, and to Fabio Sánchez and Meliza Castellanos for their help in accessing Saber 5º y 9º data.
Este artículo fue recibido el 8 de abril de 2014; revisado el 22 de agosto de 2014 y, finalmente aceptado el 8 de octubre de 2014.
Abstract
This document analyzes the effect of bullying on student performance in the short and in the long term. The level of bullying is estimated from the answers of 9th grade students in Saber test (2005-2006), while student performance is measured both in Saber 9º test (short term) and Saber 11º, a standardized test answered by students two years later (long term). Because of the existence of reverse causality, the relationship is estimated through instrumental variables. The results suggest that a one standard deviation increase in the within-school level of bullying decreases individual test score by 0.55 standard deviations in Saber 9º and by 0.4 standard deviation in Saber 11º. Furthermore, the results indicate that bullying's effect is stronger for younger students in the short term but that there are no differences by gender. However, in the long run the existing differences disappear. Additionally, this document finds that there are differences in the relationship between the level of bullying and academic performance depending on student's academic achievement.
Key words: Bullying, academic achievement, Saber 9º and 11º tests.
JEL classification: I21, I29.
Resumen
Este artículo evalúa el efecto de la intimidación escolar sobre el desempeño de los estudiantes en las pruebas Saber 9º y 11º. El nivel de intimidación proviene del número de casos de intimidación reportados en el módulo de competencias ciudadanas de la prueba Saber 9º, mientras que el desempeño académico se mide tanto en la prueba Saber 9º (corto plazo) como en la prueba Saber 11º (largo plazo). Ante la posibilidad de doble causalidad, se utiliza el método de variables instrumentales, y se encuentra que un aumento en una desviación estándar en el nivel de intimidación en el colegio disminuye el resultado de la prueba Saber 9º en cerca de 0,55 desviaciones estándar, mientras que disminuye el resultado de la prueba Saber 11º en aproximadamente 0,4 desviaciones estándar. Además, los resultados muestran la existencia de efectos heterogéneos en el efecto de la intimidación por edad del estudiante en el corto plazo y por el desempeño académico en el corto y en el largo plazo.
Palabras clave: Intimidación escolar, desempeño académico, pruebas Saber 9º y 11º.
Clasificación JEL: I21, I29.
Introduction
Schools are critical for individual development, as they are the first place in which children undertake a formal learning process that provides them with basic knowledge and thus enables them to discover and deepen the skill they need to be successful and independent adults. The result of this initial learning process determines both the probability of having access to tertiary education as well as long-term outcomes such as future income. For these reasons, it is essential to understand which factors within schools directly influence the quality of education that students experience and, consequently, their learning.
Bullying, a process in which one person repeatedly uses his superior strength or influence to mistreat, attack or force another person to do something, is one of the main problems of schools environment (Unicef, 2007b). Examples of such behavior include derogatory comments, physical assaults, and social exclusion, where the key factor is the existence of power imbalance between the perpetrator and the victim. It is a serious problem that can affect a child's school experience and one that has only recently begun to receive attention. Besides affecting the self-esteem of the assaulted, it often results in situations in which both victims and perpetrators miss learning opportunities, diminishing the quality of their education and therefore their academic performance.
According to the Olweus Bullying Prevention Center, the foremost bullying prevention center worldwide, in 1983 the percentage of bullying victims in Norway was close to 10%, however it rapidly increased and by 2001 it had risen by 50%2. As in Norway, according to the World Health Organization, in the past thirty years this phenomenon has grown rapidly to rates between 10 and 15% worldwide (Craig and Harel, 2004). This increase in the level of bullying has had negative consequences on students' education and on their quality of life; for instance, Unicef (2007a) reports that bullying decreases school attendance rates, contact with peers, and academic achievement while it increases physical injuries and the incidence of depression3. Furthermore, bullying decreases the motivation to study and generates anxiety disorders (Chaux, 2012).
Economic literature supports the negative correlation between bullying level and student performance on academic tests. Porta et al. (2007) report a negative correlation between bullying incidence and academic performance for more than 57 countries in Trends in International Mathematics and Science Study (TIMSS). Additionally, Nansel et al. (2001) find a negative relationship between the number of bullying episodes experienced and academic achievement, suggesting that it is explained by poorer relationships with peers and by the victim's inability to make friends. In this sense, international evidence shows that schools and, specifically, school environment, appear to critically affect academic performance, and consequently to determine whether students can make the most of the learning opportunities throughout their school life.
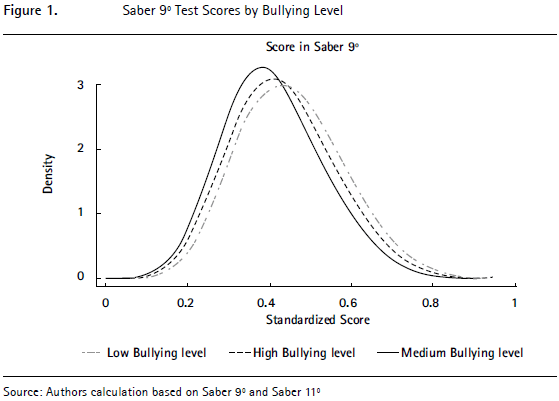
A graphic depiction of the relationship between bullying and academic performance in Colombia is presented is Figure 1; it displays the distribution of scores in Saber 9º, a standardized test for high school freshmen in Colombia, divided by the level of bullying in their school4. In accordance with the existing literature, students from schools with higher levels of bullying tend to have poorer results than students from schools with medium or low levels of bullying.
In Colombia, the level of bullying is as concerning as in other countries. According to Chaux, Molano and Podlesky (2009), 29.1% of fifth graders have been bullying victims while 14.7% of freshmen were victimized during the two months preceding the survey. The high levels of bullying episodes make it imperative to analyze the magnitude of the effect of bullying on student learning in Colombia. In particular, it is important to quantify the effect of bullying on learning, to understand whether strength and power imbalances among students negatively impact their education, and to what extent. Furthermore, understanding the extent and impact of bullying has important public policy implication, such as estimating the potential gains from expanding public programs like "Aulas en Paz"5 that seek to reduce bullying by transforming perpetrators into leaders within schools and changing third parties or observers attitude towards bullying.
Although previous document such as Chaux et al. (2009) have analyzed the determinants of bullying in Colombia, this paper contributes to the literature because there is no other document that studies bullying's effect on academic performance in the country, taking into account the existence of reverse causality. Furthermore, there are few academic works that establish the relationship between the level of intimidation and academic performance at the international level, and those documents generally evaluate the relationship leaving aside the existence of reverse causality6. The one exception is Mundbjerg, Nielsen and Simonsen (2014) that analyze the causal relationship between bullying and test scores in Denmark.
This paper, contributes to the existing literature by analyzing the effect of the school level of bullying on student performance in the short and in the long term. The level of bullying is estimated from the answers of 9th grade students in Saber test (2005-2006), while student performance is measured both in Saber 9º test (short term) and Saber 11º, a standardized test answered by students two years later (long term).7 The estimation takes into account both the existences of additional variables that determine the level of bullying and academic performance, and the existence of reverse causality.
The first section analyses the short-term effect of the school level of bullying on academic performance, controlling for individual characteristics such as gender, income and parental education, and school level variables such as average socio-emotional characteristics of students. In the long run however, the estimations only control for average income and parental educational by school as there is no individual level information of such variables. The OLS results indicate that the level of bullying has a negative and significant effect in the short term at both the school and individual levels but that it has no effect in the long term.
Nevertheless, because it is possible that the bullying a student experiences is related to that student's prior academic achievement, the relationship is also estimated through instrumental variables. To do so, the standard deviation of the age of the students in each school is used as an instrument, since an increase in this variable reflects higher within-school differences in students' age and consequently larger differences in their physical development. Thus, an increase in the standard deviation of age results in a greater number of tall students that, as a result of their size, may be able to intimidate their younger and shorter peers. Note that the standard deviation of the age depends only on the date of birth of students, a random variable that does not depend in any way on the students, their parents or the school and therefore has no direct relationship with academic performance.
After controlling for the existence of reserve causality, the results indicate that higher levels of bullying at school decrease academic performance in both the short and the long term. In particular, a one standard deviation increase in the level of bullying within-schools decreases individual test score by 0.55 standard deviations in Saber 9º and by 0.4 standard deviation in Saber 11º.
Additionally, as certain student characteristics may make them more likely to be victims, it is important to analyze if there are heterogeneous effects. The results indicate that in the short term the effect of bullying is larger for younger students but that there and no differences by gender. However, in the long run the existing differences disappear. Furthermore, this document finds that there are differences in the relationship between the level of bullying and academic performance depending on student's academic achievement. In particular, in the short term the effect of bullying is higher for students between the 30 and the 90th percentiles of the achievement distribution while in the long run the effect is larger for those located bellow the median, indicating changes in the behavior of victims and perpetrators.
The document is divided into six sections. Section I contains a review of the literature; section II presents the data used, while the methodology is presented in section III. Section IV and V present the short-term and long-run results respectively. Section VI concludes.
I. Literature Review
Firstly, it is necessary to establish which kinds of behaviors within the school are defined as bullying. Bauman (2008), based on Olweus (1993), referred to bullying as a phenomenon with three components: first, there must be an intention to harm; second, it is essential that this happens repeatedly; finally, there needs to be a power imbalance between the perpetrator and the victim. Similarly, the "Olweus Bullying Prevention Program"8 defines bullying as a process in which a person is exposed repeatedly to negative actions by another one and is unable or finds it hard to defend him or herself.
According to the Olweus Bullying Prevention Program there are nine types of bullying. The first one is verbal bullying, which includes attacks through nicknames or derogatory comments; the second and third types are physical assaults against an individual or his possessions. The fourth type of bullying is through isolation or social exclusion; the fifth one refers to aggression through lies, gossip and false rumors; the sixth is when children are threatened to do things against their will; the seventh and eight are racial and sexual bullying. Lastly, this prevention program includes cyber bullying, through phones and internet, as a new type of aggression.
Regarding the magnitude of bullying, Chaux et al. (2009) suggest that between ten and fifteen percent of adolescents worldwide are bullied two or more times a month. In turn, Craig and Harel (2004) argue that it is a phenomenon with a very high rate of variance around the world, as between 2 and 32% of students are bullied two to three times a month when they are 15 years old, and between 6 and 36% when they are 11 years old. This statistics suggest the existence of a large problem with high variations across countries and therefore highlight the importance of studying the effects of bullying in specific countries such as in Colombia.
With regard to the extent of bullying in Colombia, Chaux et al. (2009) estimate, based on questions about bullying through physical and verbal aggression in Saber tests (2005), that 29% of fifth grade students are bullied, 22% bully their peers and 50% were aware that this happens to their peers during the two months before the test. In 9th grade, the percentage of bullied students decreases to 15%, the percentage identifying as perpetrators diminishes to 20%, while the percentage of students that report to observe this phenomenon amongst their peers increases to 57%.
It is worth noting that bullying is not an isolated phenomenon, the majority of schools worldwide experience this type violence. According to the World Bank, in 35% of the schools that took the TIMSS test in 2007 there were no reported incidents in the eighth grade, in 27% there was at least one reported incident, and in 38% there were two or more reported bullying episodes during the previous month (Porta, 2007).
These results are particularly important, as the authors show that there are statistically significant differences in worldwide results in the math section of the TIMSS test as a result of the differences in the number of incidents of bullying in the classroom during the month before the test in 8th grade. This finding supports the possibility that a negative relationship between bullying level and academic performance of students exists. However, it is worth noting that this study only shows correlations and therefore does not establish the causality of the relationship between academic performance and intimidation.
With regards to the international evidence on this relationship, Roman and Murillo (2011), employ a hierarchical model, finding that aggression in schools has a negative effect on academic achievement in Latin America. In particular, the authors affirm that students who have been robbed or physically or verbally abused perform less well in math and language on the Second Regional Comparative and Explanatory test conducted by Unesco in 2005 and 2009.
Furthermore, Brown and Taylor (2008) report that bullying has a negative effect on human capital accumulation and on labor market outcomes in England. The authors use the National Child Development Study database, NCDS, which contains information on education, work and family environment for all children born between the third and the ninth of March 1958; moreover, in this database mothers answer questions about the level of bullying their children experienced at seven and eleven years.
Brown and Taylor (2008) use an ordered probit model to predict the probability of being in given grade, in a given time period, based on the level of bullying experienced by each individual at that period; they control by the quality of the school, the family environment and student ability. Their main result is that an increase in one standard deviation in the level of bullying to which a child is exposed at age 11 increases the likelihood of failing all secondary education examinations by 1.7 %, where the magnitude of the effect depends positively on the proximity between the bullying episode and the test. Their results are robust to controlling for educational level, previous academic achievement, height, weight and personality characteristics of students as well as household characteristics. However, it is worth noting that the authors don't control for the existence of reverse causality in their estimates.
Likewise, Mundbjerg et al. (2014) analyze the causal relationship between bullying in elementary in school and future outcomes in Denmark, establishing that bullied children have lower academic achievement in 9th grade and that the effects are larger when bullying episodes are more severe. The authors use the Aarhus Birth Cohort database, ABC, which contains information on academic achievement in 9th grade and bullying incidence from two sources, parents and teachers, for all children born in Aarhus, Denmark, between 1990 and 1992.
An important note is that the ABD database contains information on parent's criminal history, which enables Mundbjerg et al. (2014) to calculate the proportion of the child's classroom peers whose parents have a criminal conviction. The authors then use that index as an instrument and thus estimate the causal effect of bullying on academic achievement through instrumental variables. They find that and increase in a one standard deviation in individual exposure to bullying reduces academic achievement in over 10% of a standard deviation.
Along the same lines, Le, Miller and Heath (2005), estimate the effect of having a conduct disorder on the probability of dropping out of school9. To do so, the authors use information on family background, demographic variables and behavioral variables such as bullying, theft, and physical violence from the Australian Twins Registry. It is worth noting that this dataset is a volunteer sample of siblings in Australia that contains information about behavior problems and family labor market outcomes for 4,264 twin pairs born between 1961 and 1974.
Le et al. (2004) estimate the impact of being an aggressor on dropouts through a logit model with fixed effects, finding that children with higher behavioral problems are more likely to leave school early. Their results suggest the existence of heterogeneous effects where, among other behavioral problems, stealing, leaving home without permission, and bullying or fighting with their peers, have the greatest negative impact on education and employment. Additionally, the authors study the relationship between behavioral problems and labor market performance, finding that the former has a negative effect on labor market performance.
As to the specific ways through which bullying can affect academic performance, Smith, Talamelli, Cowie, Naylor and Chauhan (2004) study the profile of the bullying victims from interviews in two time periods. Their results show that school attendance negatively depends on the level of bullying to which each student is exposed to; those students who have never been bullied by their peers have the highest rate of school attendance while those who were victims of bullying at both moments in the interviews spent 4.55% less time in school10. A second way in which bullying can have a negative effect on performance is through lower peer effects because, according to Brown and Taylor (2008), victims have fewer friends and worse relationships with their peers and therefore fewer opportunities to learn from them.
Regarding the institutional characteristics that explain the negative effect of bullying, it is important to acknowledge that in schools with higher levels of bullying, classroom climate hinders learning process because students live in an environment of teasing, stress and anger, all of which negatively affect their ability to learn (Chaux, 2012). Furthermore, this type of environment decreases student motivation and prevents students from participating and asking questions in class because they are scared of the reaction of their peers.
According to the above finding, although international evidence posits the existence of a negative relationship between the level of bullying and academic performance both for developed and developing countries, this paper contributes to the literature as it quantifies the relationship between these variables after controlling by the existence of reverse causality. In this sense, the paper adds to the literature by estimating the relationship without the negative bias on the magnitude of effect that comes from the fact that bullying is aimed at students with depending on their academic performance in a developing country.
II. Data
A. Content Knowledge Tests: Saber 9º and Saber 11º
In 2005 and 2006, every student in 9th grade in Colombia took a test called Saber 9º, which sought to measure the school level performance in language, mathematics, science, and social studies in order to make recommendations at the institutional level. During the test, freshmen answered 12 questions in each area that add up to a total of 48 questions from which an individual average knowledge score was built and then standardized such that its mean is zero and its standard deviation one. It is important to mention that there were three questionnaires in this test but the results are only available for two of the three questionnaires. Furthermore, the individual results on the content knowledge component of a restricted sample that included specific bullying questions - explained in detail in the next section - are not available.
Two years later, in the second semester of 2007 and the first semester of 2008, the same cohort of students took a second test called Saber 11º. This test is an official requirement that all seniors students must take in order to graduate from high school; its main objective is to measure the skills of senior students in order to provide universities and other tertiary education institutions with a measure of the abilities of each individual in seven different areas. It is important to stress that, although the students from the same cohorts took this second test, as there are not name records in Saber 9º, it is impossible to know if some students dropped out of school, finished high school in a different institution, or if there are new students in the existing schools.
An important note on the interpretation of the results is that, as the average score of Saber 11º varies between semesters, the test results have been standardized by semester so that they are comparable: the average score of each area and the general score is zero and its standard deviation is one.
B. Bulling Level
Saber 9º test contained a second part which contained 45 questions on citizenship competencies that included integrative skills, democratic environments, socio-emotional and cognitive skills. The first part included questions on attitudes and actions of students, trust and empathy, and three additional questions regarding attitudes against citizenship competencies such as bullying in the first questionnaire, cheating in the second one, and piracy in the third one11. It is important to stress that the students answered this set of questions knowing that individual results would never reach their teachers, directors or classmates, allowing them to honestly report the level of aggression to which they were exposed.
Regarding the bullying level, the test measures the level of aggression within school by asking students about the number of insults they have experienced, the number of times they have been beaten, and the number of times they have been excluded by their classmates during the past week. Additionally, the first questionnaire, asked only to a restricted sampled, inquired about repeated power imbalance by giving asking students three questions about the following hypothetical situation:
Some people often feel really bad because they are frequently beaten or insulted by others. For example, Fanny and Gabriel bother Marcos all the time. At the beginning they took his food, then they began to steal and damage his stuff and now they hit him and tease him. Marcos is very afraid, he feels very bad, and wants to skip school more every day.
To measure the incidence of bullying, the questionnaire asked each student if they had been beaten or teased and had felt powerless like Marcos during the past two months; if they had seen situations like those in their classroom; or, if they had acted like Fanny and Gabriel during the same period of time.
Based on the above information, it is possible to establish whether each student was bullied, bullied another, both or neither. However, as there is no record of the name of each student it is impossible to match those records with individual test scores, implying that the results can only be used to determine the effect of bullying over academic achievement at the aggregate level.
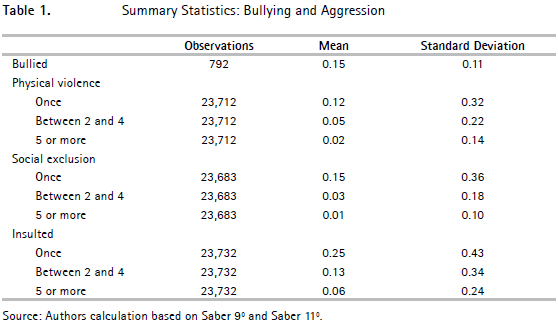
Table 1 shows that in 9th grade 15% of students are bullied by their peer. It also indicates that the most common source aggression for freshman is through insults, followed by similar levels of physical violence and social exclusion. It is worth mentioning that, as stated before, the level of bullying was only measured in the first questionnaire of the citizenship competencies module and thus, it is only possible to measure it at the school level. Furthermore, as there is no individual measures of aggression in Saber 11º, in the long run aggression levels are measured by the percentage of children that where insulted, beaten or excluded once or more in Saber 9º.
C. Individual, Household, and School Level Characteristics
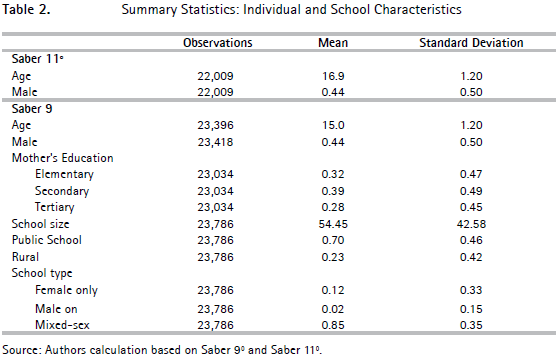
A discrete age variable is used both to control by student's age and to calculate the standard deviation of age within school. In Saber 9º, the variable comes from a categorical question while in Saber 11º, a discrete variable is built from the date of birth and test date of each student; in both datasets average students' age is used to exclude education institutions for adults from the estimations.
Regarding socio-economical characteristics, Saber 9º includes information on mothers' education and household income. Mothers' educational information can be grouped into three categorical variables: elementary education or less, secondary education, and tertiary education; household quartiles come from an income index constructed with 5 assets and two services12. These variables are used at the individual level as controls in the short run estimation.
Regarding the conditions of households and schools, Table 2 indicates that students were on average 15 to 17 years when they took Saber 9º and 11º respectively. Additionally, most students in the sample come from mixed-sex schooled, followed by female schools and lastly by male schools. Finally, it is worth mentioning that 39 % of mothers have complete or incomplete secondary education, 32% received primary education or less, and 29% of mothers started or finished university.
In the long run however, as there is no information on mother's education and household income in Saber 11º, average socio-economical information at the school level from Saber 9º are used.
Furthermore, as the module of citizenship competencies in Saber 9º included measures of socio-emotional characteristics such as trust, empathy, and intention interpretation, and family and neighborhood environment, these variables are used to control by school level attitudes, and by average violence and segregation in student's environment both in the short and in the long run.
III. Methodology
To measure the impact of the average level of bullying in each school over average academic achievement in the short run, we run regressions of the form

where Yjkt is the average score in Saber 9º for school j, in time t, and district k; Ijt is the level of bullying in school j which is measured as the percentage of children that report to have been bullied during the past two months in the same test; Cjt is a vector including a constant and school control variables such as school size, the percentage of males in the student population, average violence within school, average school income level, average mother education, average socio-emotional characteristics, average household and neighborhood environment, whether the school is rural or urban, and whether the school is public or private.
In order to analyze the effect of the average level of bullying in each school over the individual academic achievement, we also run

where Yijtk is the average score in Saber 9º for individual i in school j; Ijt is the level of bullying in school j. Xit is a vector including a constant and individual control variables such as gender, age, the number of times the person has been beaten, insulted and rejected by their peer, their mother's education and their income level in the short run13. Additionally, Cjt is a vector including school control variables such as school size, average socio-emotional characteristics, average household and neighborhood environment, whether the school is rural or urban, and whether the school is public or private.
Regarding the included control variables, average socio-emotional characteristics are taken into account because, according to Chauhan et al. (2004), bullying victims have trouble getting along with their peers and therefore they miss on learning opportunities. Furthermore, the average level of violence in each student's house and neighborhood are included as controls because Baldry (2003) states that bullying peers is highly correlated with household violence which also affects school achievement.
Moreover, in Colombia Chaux et al. (2009) state that socio-emotional characteristics, family and school environment determine the level of bullying in school. Firstly, the authors state that the level of bullying is higher for male schools, private school and those situated in urban areas. Then, the authors determine that the family has a fundamental impact on student's performance through their beliefs and behavior. Regarding the socio-emotional determinants, the authors indicate that lower levels of empathy, trust and anger management, as well as beliefs that support aggressive responses increase the level of bullying. Finally, it is worth noting that, as violence in the neighborhood raises so does violence within schools. Thus, all regression control by for socio-emotional characteristics of individuals, family background and neighborhood conditions, and by more standard variables such as type and school location.
The effect of the level of bullying over average academic achievement in the long run is estimated through regressions of this form

where Yijtk is the average score in Saber 11º for school j; Ijt-1 is the level of bullying in school j measured in Saber 9º. Cjt is a vector including a constant and school control variables measured in Saber 11º such as school size, the percentage of males in the student population, whether the school is rural or urban, and whether the school is public or private and Djt-1 includes school control variables from Saber 9º such as the average household and neighborhood characteristics, average level of aggression within school, average school income level, average mother education, average socio-emotional characteristics, and average family and neighbor environment.
Additionally, in order to measure the effect of the level of bullying over individual academic achievement, we run regressions of the form

where Yijtk is the average score in Saber 11º for individual i in for school j; Ijt is the level of bullying in school j measured; Xit is a vector including a constant and individual control variables such as gender and age. Cjt is a vector including a constant and school control variables measured in Saber 11º such as school size, the percentage of males in the student population, whether the school is rural or urban, and whether the school is public or private and Djt-1 includes school control variables from Saber 9º such as the average household and neighborhood characteristics, average level of aggression within school, average school income level, average mother education, average socio-emotional characteristics, and average family and neighbor environment14.
An important note is that, in order to control by violence, inequality and poverty, as they directly determine the school environment and the academic achievement of students, all estimations include district fixed effect (µk). Furthermore, according to Chaux et al. (2009), these variables directly affect the number of bullying episodes within schools making it imperative to control by them. Additionally, as the level of bullying is constant within schools, the standard errors are clustered at school level.
Although there is no clear evidence in the literature about the effect of academic achievement on bullying, it is likely that bullying is directed towards students depending on their academic performance which would bias the estimates. In particular, if the bullying is directed toward students with higher academic level, the coefficients that measure the average effect of bullying on school performance will be underestimated as these students will counteract the effect of bullying on academic performance by studying harder or as a result of their baseline skills.
To overcome the bias that results from the existence of reverse causality between bullying and academic performance, the instrumental variables method is used. According to Cameron and Trivedi (2009), this method is consistent when the instrument is relevant and valid. In this sense it is necessary to find a variable that is related to academic performance only through bullying. The effect of bullying on academic performance would then be estimated through the following regressions:

Equation 5 is the first stage regression where Ijt is the level of bullying in school j which is measured as the percentage of children that report to have been bullied during the past two months in Saber 9º; Zjt is the instrument variable; Xijt and Cjt are the individual and school level controls included in Equation 2.
The instrument used is the standard deviation of the age of the students in each school, since an increase in this variable reflects higher differences in students' age and thus greater differences in their physical and emotional development. Therefore an increase in the standard deviation of age results in higher number of older students who can intimidate their younger and weaker peers.
Looking at the first stage results it is possible to confirm if the instrument is relevant or if it is related to bullying by analyzing whether the instrument significantly explains the variance of the endogenous variable. With regards to the exclusion restriction, the standard deviation of the age depends only on the date of birth of all students in the classroom, a random variable that does not depend in any way of the student's decisions, their parents or their schools'. It is worth noting that after controlling for student's age, the date of birth of each student has no relationship with his level of skills or knowledge, indicating that the standard deviation of age should have no direct relation with the academic performance of students in school or state tests.
Based to the above, the effect of the level of bullying over individual academic achievement is estimated by regressions of this form

where Yijtk is the average score in Saber 9º for individual i in school j; Ijt is predicted level of bullying in school j from Equation 5; Xijt and Cjt are the individual and school level controls included in Equation 2.
Finally, after estimating the unbiased coefficients through instrumental variables, it is possible to analyze if there are differences in the effect of bullying by age or gender. Additionally, it possible to analyze if the relationship between test results and the level of intimidation varies through the distribution of test scores by using quintile regressions. It is important to mention that this method estimates the relationship between the variables at different levels of Saber test scores, presenting a wider picture of the relationship between bullying and academic achievement. This is especially relevant because it grants the opportunity to analyze if the effect of bullying is particularly perverse for those students in the right tail of the achievement distribution or if the effect is greater for those on the left tail. Additionally, as a result of the existence of reverse causality mentioned above, the differences in the relationship of bullying and academic performance are especially relevant for students at the ends of the distribution because they can be affected at a greater extent as they may be more likely to be bullied or to face stronger attacks.
IV. Short Term Results: Bullying Effects Over Saber 9º
Table 3 summarizes the effect of bullying on academic performance in Saber 9º at the school level. The first column shows that, after controlling for the percentage of males in the student population, average violence within school, average school income level, region, type of school, and district fixed effects, an increase in one standard deviation in the level of bullying decreases average scores in the Saber 9º test by 0.04 standard deviations. However, when additional controls such as mother education and average socio-emotional characteristics are included, the effect becomes smaller and statistically insignificant.
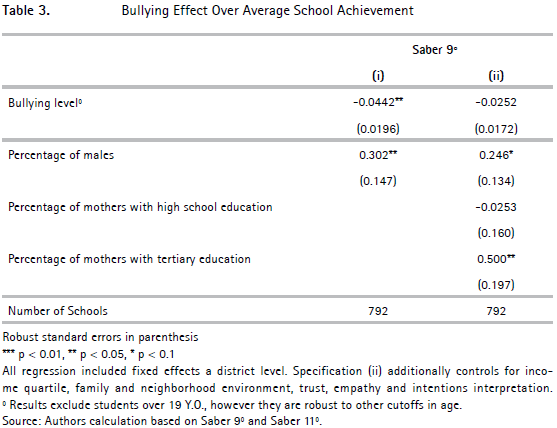
Regarding the results, it is worth noting that according to Chaux et al. (2009), better conditions in the environment of the school district, the school environment, as well as the socio-emotional conditions of student's decrease the level of bullying to which students are exposed, while directly improving their academic performance. In this sense, controlling for such variables should reduce the effect as it actually does. Nevertheless, as bullying may depend on the academic achievement of each student, the estimates found may be biased, making it necessary to analyze the effect on individual student results.
Taking account of the above, Table 4 estimates the effects of school bullying level on individual academic performance in the short term, as measured by the Saber 9º test. Column one shows that as the percentage of bullying victims increases in one standard deviation, the performance of individual scores decreases by 0.04 standard deviations.
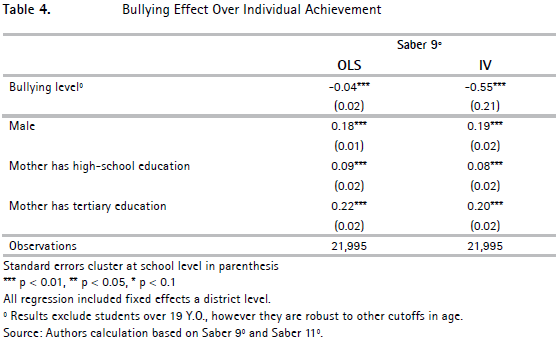
The negative relationship between the level of bullying and academic achievement is most likely explained by the fact that victims have lower attendance rates, lower contact with their peers and higher incidence of depression (Unicef, 2007a). Additionally, negative classroom atmosphere hinders the learning process in schools with higher levels of bullying, as students live in an environment of mocking, stress and anger, which decreases their motivation (Chaux, 2012). It follows then that victims learn less as a result of having less interest in studying, not only because they often miss school but also because they learn less from their peers when they do attend school. Furthermore, bullied students may not participate in class when they sense a hostile school environment, because they are scared of their fellow classmates' possible reactions.
However, in order to correctly infer the magnitude of these effects, it is necessary to correct the bias that comes from the possibility that academic performance influences the likelihood of being a victim of bullying, where, if bullying is directed towards students with higher achievement the coefficients will be biased downward, and if it directed towards students with low academic achievement the coefficients will be biased upwards.
In order to address this bias, the second column in Table 4 estimates the results by using the standard deviation of age in each school as an instrumental variable, under the assumption that older and taller students could possible bully those who are weaker because they are shorter or younger. The magnitude of the effect is much larger: as the average level of school bullying incidents increase by one standard deviation, the performance of each of student decreases by 0.55 standard deviations.
Of note from the results is the existence of a negative bias on the effects of bullying, which means that victims of bullying are students with better test results Saber 9º and consequently those who probably got better grades throughout their time in school. This bias may be due to the fact that students with better academic performance arouse envy from their peers as a result of their performance. Another alternative is that students with greater academic abilities tend to have fewer friends because they tend to focus on their studies rather than on cultivating social relationships, and in doing so become more vulnerable to attacks from their classmates, as indicated by Brown and Taylor (2008).
With regards to the first stage, the standard deviation of age is used as an instrument because a higher standard deviation results from larger differences in age composition within the group and thus reflects the unequal power relations between students that result from differences in their age and subsequent physical and socio-emotional development. Groups with a higher age standard deviation will have a greater number of students who bully their peers because they are taller or stronger, as well as a larger number of young students who can be easily victimized.
Table 5 shows the existence of a positive relationship between the standard deviation of age and the percentage of bullying victims within schools, indicating that it is a relevant instrument for estimating the percentage of bullying episodes. With regards to the exclusion restriction, the standard deviation of age depends on the date of birth of all students in the school, a random variable that does not depend in any way of students or on their parents' decisions. It is worth noting that after controlling for age dummies, the date of birth of each student has no relationship to their level of academic skills or knowledge, indicating that the standard deviation of age should have no direct relation to the academic performance of students in the school or to their performance on state tests, and thus that it is a valid instrument. Furthermore, as the date of birth of each student does not determine his or her personality, is not related with a student's ability to interact with their peers.15
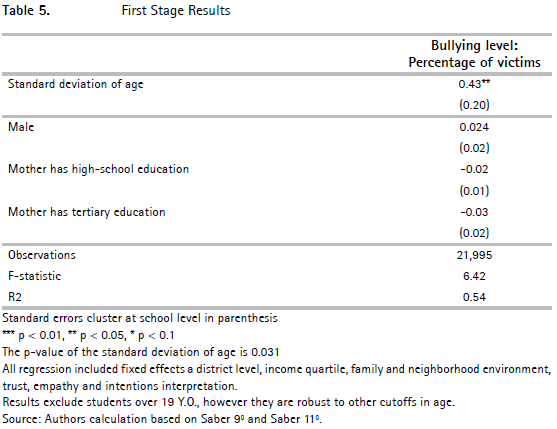
However, two points are worth noting. First, instrumental variables estimates by design are local average effects. Therefore, and due to the relatively low predicting power of the instrument, the external validity of the results may be limited. Second, higher standard deviation on age may result in differences in cognitive development and maturity that may in turn result in differences in peer effects, beyond those captured by the age of each student, thus biasing the results.16 Nevertheless, the negative effect of bullying on academic achievement are consistent with the causal effects estimated by Mundbjerg et al. (2014).
Regarding the additional controls, nor mother's education nor income nor gender affect the level of bullying. However, school type does influence the amount of bullying: schools were boys attend have the highest level of bullying, followed by school were both girls and boys attend and lastly by school were only girls attend. An important result is that aggression, measured by the number of insults they have experienced, the number of times they have been beaten, and the number of times they have been excluded by their classmates, has a positive and significant effect over bullying. Moreover, schools with higher levels of school trust and empathy have lower levels of bullying.
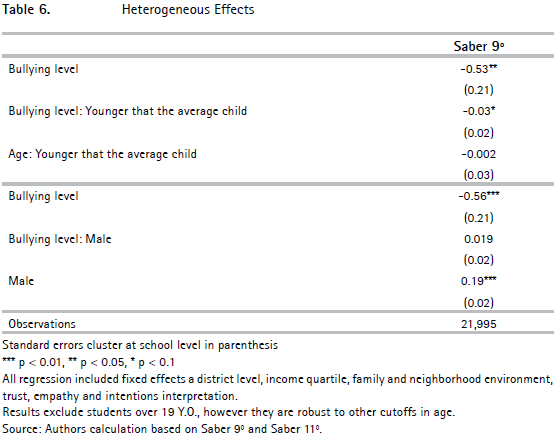
Table 6 analyses the existence of heterogeneous effects on age and gender; in both cases the coefficient reflects the differential effect of a one standard deviation increase in the percentage of bullying estimated by the instrumental variables. Panel A reveals that the effect of the average level of bullying within schools on academic performance is higher for students who are below the average age for the school. One possible explanation for this fact is that is that younger students are more likely to be bullied and therefore more affected by the level of bullying within the school. Panel B analyzes heterogeneous effects by gender and finds that there are no statistically significant differences in the effect.
Additionally, Figure 2 analyses the differences on the average effect of bullying by individual academic achievement. It shows that the percentage of victims of bullying at a school has a negative effect on the Saber 9º test score at all levels of academic performance, but it indicates that the effect may be greater for those students between the 30 and 90th percentile. However, due to the large standard errors in the estimation such difference may be statistically equal to zero.
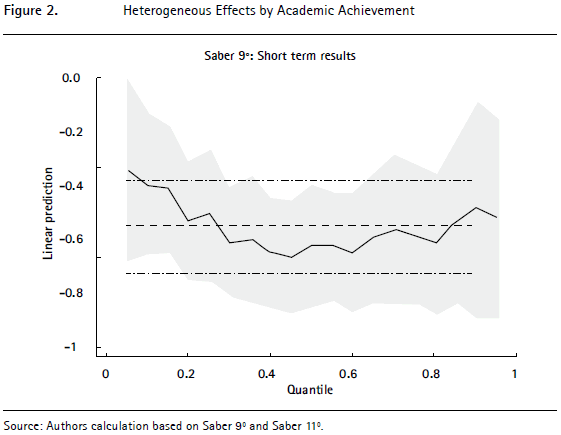
One possible explanation for the difference in the result is that students with greater academic skills, top 10th percentile of the academic achievement distribution, focus on their studies while students with lower academic skills stop studying; it is also likely that both groups reconfigure their relationships to spend time with friends with similar interests, as in the case of High-Skills Afro-Descendants students in An economic analysis of "Acting White" (Austen- Smith and Fryer, 2005).
In this scenario, the high achieving group would be completely isolated from the rest of the class and the students in this group focus primarily on studying and therefore are less affected by bullying, or the cohesion as a group offsets the effect of bullying at a higher level of academic engagement. On the other hand, a second group of students, those who are between the 30 and the 90th percentile of the performance distribution, decrease their academic performance to reduce the episodes of bullying against them, resulting in the fact that the greatest effect on the level of bullying is observed in the population near the median. A third group corresponds to the students at the bottom of the achievement distribution, who isolates themselves from the other students, probably focusing on other non-academic interests, and as a results are less exposed to bullying in their school.
V. Long Run Results: Bullying Effect Over Saber 11º
Unlike the short-term results, in the long-term bullying has no effect on the average academic performance by school or at the individual level as estimated by OLS in Table 7. However, after correcting for the bias that results from reverse causality between bullying and academic achievement, the results indicate the existence of a negative and significant effect two years after the first test as shown in Table 8. The results also indicate a negative bias of the effect of bullying on the relationship between the level of intimidation and academic performance, where victims of bullying are high-skill students with better test results in the Saber 11th, and those who probably got better grades throughout their time in school.
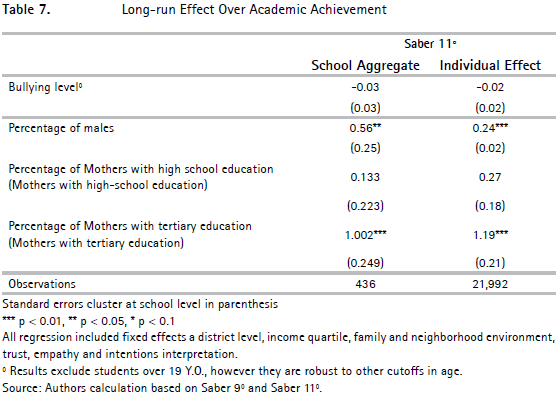
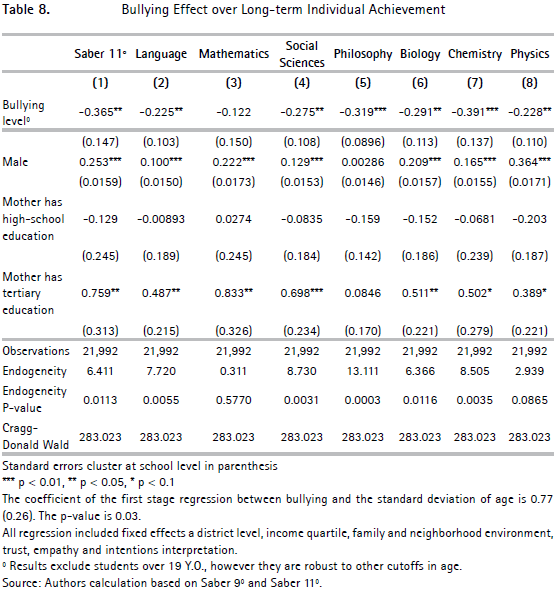
Regarding the magnitude of the effect, Table 8 shows the instrumental variables results. They indicate that a one standard deviation increase in the percentage of victims of bullying within schools decreases the Saber 11º test results by 0.37 standard deviations. The effect of bullying over the areas of the test is significant and varies between 0.2 and 0.4 standard deviations, except in math where there is no significant effect. An important note, however, is that the first the endogeneity test reflect that in all Saber 11º test areas except mathematics bullying was endogenous. It also is worth mentioning that, in the first stage results, there is positive and strong relationship between the standard deviation of age and the percentage of bullying victims within schools as the first stage coefficient is 0.77 and its standard error 0.26.
An interesting finding is that the magnitude of the effect is smaller than in the short term, a result which probably comes from the increase in the time lapse between the episode of intimidation and the state exam. It is worth noting that this result is consistent with the literature that states that the effect on academic performance is greater the closer the episode of intimidation is to the time of the test, as stated in Brown and Taylor (2008).
Furthermore, it is worth noting that, as a result of the characteristics of the database, is impossible to know whether all students who took the Saber 9º test in 2005-2006 also took the Saber 11º test two years later. Therefore, it is possible that the decrease in the long-term effect is related to an increase in desertion of victims, an increase in the number of students who finish school somewhere else, or the incorporation of new students.
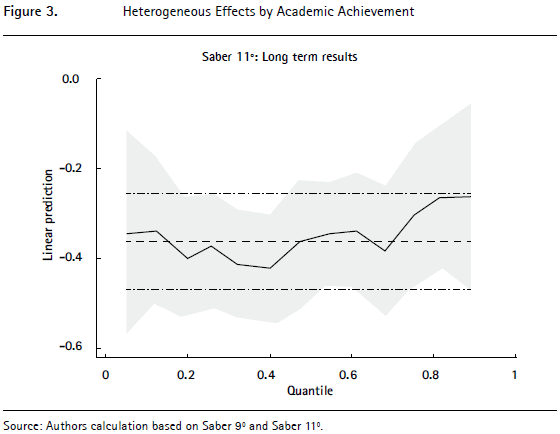
As for the existence of heterogeneous effects, there are no significant differences by gender or age of the students. However, when analyzing the percentile regressions by academic performance, the results shows that in the long term bullying may have a smaller effect on students located in the right tail of the distribution as shown in Figure 3. In particular, the relative effect is lower for those located between the median and the right tail. One explanation for this result is that the tendencies observed in the short term are exacerbated when a larger group of students joins the first group of students, those who focus solely on their education and therefore are less affected by average bullying level within schools. A second explanation is that as students near the end of high school, they become more aware of the importance of academic achievement and thus stop bullying their peers with higher grades. Nevertheless, due to the large standard errors in the estimation such difference may be statistically equal to zero.
VI. Conclusions
The results indicate that for high school students in Colombia, increases in the frequency of bullying negatively affect individual academic performance both in the short and in the long term. In particular, taking into account possible biases, an increase of one standard deviation in the average level of bullying decreases a student's Saber 9º test score by 0.55 standard deviations and their Saber 11º test by 0.37 standard deviations. This result suggests that by reducing the number of bullying incidents by one standard deviation, it is possible to improve long term academic performance of students.
These results are consistent with the international literature. According to Brown and Taylor (2008), reducing the frequency of bullying is fundamental, as it has a negative long-term effect on wages both directly and indirectly through human capital accumulation. Furthermore, Mundbjerg et al. (2014) indicate that bullying has negative effect in academic achievement and that, as a result, the loss in potential lifetime earning may be enormous. This implies that a decrease in the level of bullying within classrooms would improve not only the performance of students on the Saber 9º and Saber 11º tests, but also improve their future wages and living conditions.
Regarding the heterogeneous effects, the results indicate that the long run effect of being bullied does not depend on gender or age. However, in the short run the effect is greater for younger students, indicating that while bullying has a negative effect on all students, the effect is greater on those younger students who may be more likely to be victimized by peers.
Finally, this analysis reveals the existence of differences in the relationship between the level of bullying experienced and academic performance by test scores over time. In particular, it finds that in the short term, the effect of being bullied is greater for students between the 30 and the 90th percentile of the academic achievement distribution, and in the long run it is higher for those students below the median. A possible explanation for this result is that students divide themselves in two groups as postulated in An economic analysis of "Acting White" (Austen-Smith and Fryer, 2005). In the short run, there is a small group of students who focus primarily on studying and therefore are less affected by bullying and, as they approach the end of high school, they are joined by a larger group of students who decide to focus on their studies as well. Simultaneously, the second group of students, who studied less in order to fit in and prevent bullying attacks against them, becomes small and less powerful as they progress through high school.
The existence of heterogeneous effects by age and level of performance means that public policies should aim at reducing bullying nationwide while taking into account the specific conditions of individual schools and students; one example of this is through programs that specifically protect younger students. Furthermore, prevention programs should be designed to specifically protect children around the median of the academic distribution by helping them find friends with similar characteristics and by promoting higher academic achievement within schools. Doing this, however, implies designing prevention programs that suit the particular needs of each school.
However, further research is needed to measure the benefits of current bullying prevention programs such as "Aulas en Paz" in Colombia and Mexico. In this regard, it is essential to measure and compare the outcomes of different types of programs that seek to prevent bullying in order to establish the most efficient way to solve the problem. A first step in this direction is to begin with programs that focus on the students who observe bullying and not on the aggressors themselves as, according to Chaux (2012), is easier to change the attitudes against bullying and the behavior of observers than to change the behavior of the aggressors.
Regarding the above, in order to measure which programs work best, it is necessary to determine the level of bullying to which each child is exposed, the prevention programs to which they were exposed, as well as their academic performance through school and university and, if possible, their eventual labor market outcomes. In the case of Colombia, this means that the state test should continue to measure bullying but it should also include each student's individual information in order to match those results with individual test scores. In addition, in order to more accurately assess the effect of bullying in the future, it would be interesting to measure the effect of different types of bullying. For these reasons, it would be essential to include additional questions in bullying surveys that measure a greater variety of the nine types of bullying defined by the Olweus Prevention Center.
_____________________________
Foot notes
2 According to the Olweus Bullying Prevention Program (2011), an organization that focus on bullying prevention worldwide, the first national representative study of bullying in Norway found that around 10% of students between 8 and 16 years were bullying victims and that by 2011 that number had raised in 50%. Furthermore, the center reports that in the first nationally representative study in the United States, 17% of students in middle-school had been bullied at least one time and 8% had been bullied at least once during the past week.
3 As reported by Unicef (2007a), bullying victims in Malaysia lose interest in school, decrease attendance, communicate less with their peers, and have lower grades. Moreover, bullying reduces sleep and appetite while increasing disease reports and physical injuries.
4 Figure 1 displays the distribution of student scores in Saber 9 test when schools are divided in three groups according to the level of bullying in Schools. Each group contains one third of the schools, where high contains the 33% schools with higher level of bulling, medium the next 33%, and low the bottom 33%. The difference in the average test score between the three groups are statistically significant at 1%.
5 According to Chaux (2012), such programs improve coexistence, reduce aggression, decrease discipline interruptions, and increase friendship within the classrooms. Additionally, according to Garcia (2011), Aulas en Paz has reduced violence within-schools, while improving coexistence, empathy, assertiveness, and academic achievement by promoting peaceful coexistence through the promotion of citizenship skills.
6 Reverse causality refers to the possible existence of a two way causal relationships. In this paper reverse causality refers to the possibility that bullying is directed towards students depending on their academic achievement and academic achievement depends on the level of bullying.
7 It is important to stress that, although the students from the same cohorts took this second test, as there are not name records in Saber 9º, it is impossible to know if some students dropped out of school, finished high school in a different institution, or if there are new students in the existing schools.
8 The Olweus Bullying Prevention Program is an organization that focuses on worldwide bullying prevention at the individual, school and community level. The website http://www.olweus.org/public/bullying. page has more information about the organization, bullying and bullying prevention programs.
9 Among behavioral problems, Le et al. (2004) include conduct disorder, personality disorder, delinquency, immaturity and aggressive behavior because they are usually related with problems between students, between students and teachers or between students and other school authorities.
10 According to Smith et al. (2004), students that were never bullied attend school 98.8% of the time while those that were bullied in both periods only attend 94.3% of the time.
11 The first questionnaire was only used in a restricted sample that evaluated a nationally representative set of schools.
12 Household assets refers to whether the household as a working tv, refrigerator, radio, computer and car. The two services included are whether the household has access to electricity and whether it has a phone line.
13 The number of times a person has been beaten, insulted and rejected by their peer comes from three different categorical variables that ask each student who often each of these behaviors happened to him in the following scale: never, once, between two and four times, or five or more times. Mother's education is divided in the following categories: elementary school or less, complete or incomplete high-school education, tertiary education or more.
14 In the long run there is no individual information of mother's education, income level, nor of the level of aggression each student receives and those variables are only included as the average by school level.
15 Cragg Donald Wald test shows that the instrument is not weak as it exceed the critical value of 16.38 Stock and Yogo, indicating that the coefficients do not exceed 10% of the bias of the ordinary least squares estimators. Additionally, that endogeneity test shows that the null hypothesis - bullying in endogenous - can't be rejected, indicating that the percentage of episodes of intimidation is endogenous, confirming the need to instrument and that the OLS effects was downward biased.
16 Although it is impossible to verify the exclusion restriction without another (valid) instrument, it is possible to include the interaction between gender and the standard deviation of age as a second instrument and test whether the instrument is exogenous. The results of those estimations show that the null hypothesis, that the instruments are exogenous, cannot be rejected as the p value is 0.65. Nevertheless, it is important to stress that the validity of this test again depends on the exogeneity of the instrument, as it also assumes that the standard deviation of age is an exogenous instrument in other to confirm that the interaction between the instrument and gender is exogenous.
References
1. AUSTEN-SMITH, D., AND FRYER, R. G. (2005). "An economic analysis of Acting White", The Quarterly Journal of Economics, 120:551-583. [ Links ]
2. BALDRY, A. C. (2003). "Bullying in schools and exposure to domestic violence", Child Abuse & Neglect, 27:713-732. [ Links ]
3. BAUMAN, S. (2008). "The role of elementary school counselors in reducing school bullying", The Elementary School Journal, 108:362-375. [ Links ]
4. BROWN, S., AND TAYLOR, K. (2008). "Bullying, education and earnings: Evidence from the National Child Development Study", Economics of Education, 27(4):387-401. [ Links ]
5. CAMERON, C., AND TRIVEDI, P. K. (2009). Microeconometrics using Stata. College Station: Stata Press. [ Links ]
6. CHAUHAN, P., COWIE, H., NAYLOR, P., SMITH, P. K., AND TALAMELLI, L. (2004). "Profiles of non-victims, escaped victims, continuing victims and new victims of school bullying", British Journal of Educational Psychology, 74:565-581. [ Links ]
7. CHAUX, E. (2012). Educación, convivencia y agresión escolar. Bogotá: Ediciones Uniandes. Taratus, Santillana. [ Links ]
8. CHAUX, E., MOLANO, A., AND PODLESKY, P. (2009). "Socio-economic, socio-political and socio-emotional variables explaining school bullying: A country-wide multilevel analysis", Aggressive Behavior, 35:520-529. [ Links ]
9. CRAIG, W., AND HAREL, Y. (2004). "Bullying, physical fighting and victimization", in C. Currie, C. Roberts, A. Morgan, R. Smith, W. Settertobulte, O. Samdal and V. Barnekow-Rasmussen (Eds.), Young people's health in context. Health Behaviour in School-aged Children (HBSC) study: International report from the 2001/2002 survey (pp. 133-144). Copenhagen: World Health Organization. [ Links ]
10. GARCÍA, B. (2011). "Fueron tres tristes trigres...", Nota Uniandina, 34:36-39. [ Links ]
11. LE, A. T., MILLER, P. W., AND HEATH, A. C. (2005). "Early childhood behaviours, schooling and labour market outcomes; estimates from a sample of twins", Economics of Education Review, 24:1-17. [ Links ]
12. MUNDBJERG, T.L, NIELSEN, H. S, AND SIMONSEN, M. (2014). "Bullying in elementary school", Journal of Human Resources, 49(4):839-871. [ Links ]
13. NANSEL, T. R., OVERPECK, M., PILLA, R. S., RUAN, W. J., SIMONSMORTON, B., AND SCHEIDT, P. (2001). "Bullying behaviors among U. S. Youth", Journal of the American Medical Association, 28:2094-2100. [ Links ]
14. OLWEUS, D. (1993). Bullying at school: What we know and what we can do. Cambridge, MA: Blackwell. [ Links ]
15. OLWEUS PREVENTION CENTER. (2011). How common is bullying? Olweus Prevention Center. Recovered 11 October 2011, from http://www.olweus.org/public/faqs.page?menuheader=1#Answer_numberCbQ7. [ Links ]
16. PORTA, E. (2007). Usando TIMSS para entender los determinantes del aprendizaje: hallazgos iniciales para Colombia 2007 (pp. 1-56). Education: The World Bank. [ Links ]
17. ROMÁN, M., AND MURILLO, F. J. (2011). "América Latina: violencia entre estudiantes y desempeño escolar", Revista Cepal, 104:37-54. [ Links ]
18. SMITH, P. K., TALAMELLI, L., COWIE, H., NAYLOR, P., AND CHAUHAN, P. (2004). "Profiles of non-victims, escaped victims, continuing victims and new victims of school bullying", British Journal of Educational Psychology, 74:565-581. [ Links ]
19. UNICEF. (2007a). Stop violence in schools! The scope and impact of bullying. Fact Sheet. Malaysia: Unicef Malaysia Communications. [ Links ]
20. UNICEF. (2007b). MTV Latinoamérica y Unicef unen esfuerzos para presentar una realidad que viven muchos adolescentes y jóvenes en Latinoamérica. Recuperado el 21 de septiembre de 2011 de Centro de prensa: http://www.unicef.org/spanish/media/media_40147.html. [ Links ]
