English (pdf)
 Article in xml format
 Article references
 Send this article by e-mail
 Cited by SciELO
  Cited by Google
  Similars in
SciELO
Similars in
SciELO  Similars in Google
 Permalink
Introduction
All over the world, for decades, cruise tourism has grown steadily (Meehan & Hynes, 2014). Consequently, in proportion to the growth in demand, supply has been improving and increasing (Sciozzi, Jugovic, & Jugovic, 2015). In fact, cruise tourism has become one of the fastest growing businesses and is perceived by some as the most attractive form of holiday and leisure activity (Kovalevskiene, Letinauskiene, & Strakšiene, 2017). Others believe it to be the salient symbol of the globalization of the tourism industry in terms of its market coverage, its practices, and the mobility of its assets (Rodrigue & Notteboom, 2013).
In Central America and the Caribbean, cruise tourism has been gaining importance; it is particularly relevant for some ports and is being touted as a desirable local economic development opportunity within the region (Seidl, Guiliano, & Pratt, 2006). In fact, the 1996 “Declaration of Montelimar” recognizes tourism as a force to enhance Central American global competitiveness and increase the diversification of economies (Ferguson, 2010).
Mexico is one of the ten most visited countries in the world, and it is the country with the highest influx of international tourists in Latin America (Datatur, 2018). In the case of cruise tourism, during 1997-2017, the number of arrivals grew on average by 6.84% per year. Similarly, traditional international tourism has had, during the same period, an annual average growth rate of 3.80% according to the data provided by the National Institute of Statistic and Geography (INEGI) (2018). During the same period, the income generated by cruise tourists grew on average by 7.40% per year, while international tourists’ spending had an annual average growth rate of 6.76% (INEGI, 2018).
These positive results obtained by the Mexican tourism sector could be severely affected by the increase in violence that has been registered in Mexico during the last few years as tourist flows are very sensitive to conditions relating to the hospitality, political stability, and security offered to the travellers in the places they visit (Ramírez, 1994). The reduction in the number of tourists currently going to the regions affected by violence, such as Acapulco in the Mexican state of Guerrero, has meant that residents have stopped receiving additional income since the creation of temporary jobs has halted, which has reduced the beneficial effects of tourism (Andrés-Rosales, Sánchez-Mitre, & Cruz, 2018).
Among the different crimes that can take place in society, kidnappings are considered to be particularly bad, as they can involve violence, rapes, injuries, and, in some cases, homicide (Gómez, 2004). In Mexico, kidnappings have grown to the point that the country was ranked first in 2013 (Vélez, et al., 2014). The Center for Social Studies and Public Opinion (CESOP) (2010) identifies the following as the main reasons why kidnappings have increased in Mexico: organized gangs’ access to more and better weapons, complicity with members or former members of the police forces who sometimes lead these groups, and some networks of kidnappers operating from within prisons.
Although it has been found that violent crimes are rarely perpetrated against tourists, who are more often victims of property crimes and robbery (De Albuquerque & McElroy, 1999), it is also known that the image of a country, formed mainly by government information agencies, is increasingly considered as an important factor when choosing a destination. For the Mexican case, the warnings have focused on the violence that the nation has recently gone through, particularly on the organized crime element (Monterrubio, 2013).
This work extends the results found by Sánchez and Cruz (2015) as it tries to measure the impact kidnapping has on cruise tourist arrivals in the long-term. To achieve this purpose, differently from the quoted document that uses a Structural Vector Autoregressive Model with series in first differences, an Autoregressive Distributed Lag Model (ARDL) with log-linear specification is proposed in order to obtain the long-term coefficients. The ARDL is computed with series from the first quarter of 1997 to the last quarter of 2017. It includes, as a dependent variable, the number of cruise tourist arrivals to Mexican ports, (CT ), and, as explanatory variables, the U.S. GDP, (YU) and the number of recorded kidnappings in Mexico, (K ). The results indicate that the cruise tourist arrivals are very sensitive to the changes in U.S. GDP and that the number of kidnappings occurred in Mexico has had a statistically significant negative impact on the arrival of passengers.
This work contains five sections without considering this introduction. The first section presents general facts on cruise tourists and cruises, the second discusses the effects of violence on tourism, and special attention is paid to the Mexican case. The third section is divided in two subsections: the first presents the sources and descriptive statistics of all three series to be used in the model, and the second subsection presents the results of unit root tests. The fourth section explains the specification of the ARDL model, the fifth section presents and explains the empirical results of computing the model. Finally, conclusions are presented.
I. Cruises and cruise tourists
Cruises are water-based trips, taken mainly for pleasure, in which excursions are customarily organize to the coasts, villages, and ports along the route (De la Torre, 2000). As an industry, cruises, in contrast to other kinds of travel and tourism, can be marketed both as a destination and as a form of transportation (Ahmed, Johnson, Ling, Fang, & Hui, 2002; Sun, Jiao, & Tian, 2011) in which it is possible to provide luxury and comfort (Panosso & Lohmann, 2012); however, the aim of cruise tourism is not transportation (Demir, Davras, & Uzun, 2016).
In fact, some cruises are seen as authentic floating tourist centres (De la Torre, 2000) similar to tourist resorts (Gutberlet, 2016) for they often offer the same onboard services as a luxury hotel such as stores that sell a great variety of articles: from necessities to the most luxurious goods, sport activities, room service, beauty parlours, religious services, dance rooms, bars, casinos, shore excursions, and many others (De la Torre, 2000; Morfín, 1995; Sun, et al., 2011). Sports facilities are considered to be by far the least important while those related to bonding and recreation are seen as very relevant (Chen, Neuts, Nijkamp, & Liu, 2016). Nevertheless, there are important differences between ships and hotels such as the room-inventory management, wave booking period, large numbers of cabin categories, airfare packages, and on-board spending (Espinet-Rius, Fluvià-Font, Rigall-Torrent, & Oliveras-Corominas, 2018).
Cruises usually follow a fixed itinerary, reservations are often made for the round trip and, on very rare occasions, new passengers are allowed to board on the ports of call (De la Torre, 2000). For some cruises, given the high demand, bookings are made one year in advance; for example, the one that passes through Polynesia, while for other routes reservations are made between six months and a year before the journey (De los Reyes, 2014).
There are two different kinds of cruise: the maritime and the fluvial. The latter refers to those that travel along navigable rivers such as the Rhine in Germany or the Nile in Egypt (De la Torre, 2000). A maritime tourist cruise will usually transport more than 12 passengers, and the tour will generally last for a week (Morfín, 1995) but occasionally for months (Sun, et al., 2011). By definition, cruise tourism must last no less than sixty hours, and two ports must be visited, excluding the homeport and end port (Kizielewicz, 2013; Kovalevskiene, et al., 2017).
A cruise tourist can be defined as a person buying a cruise trip (Kovalevskiene, et al., 2017) whose decision to embark on a cruise is motivated by different reasons including: personal prestige, social interaction, improving family relations or friendships, or, simply, by the desire to get away from the monotony of daily life. On the other hand, no evidence has been found that factors such as self-knowledge, self-evaluation and cultural or educational motives are significant enough to go on a cruise trip (Hung & Petrick, 2011). Other motivations to spend vacations on a cruise include leisure and recreation, and, less frequently, to visit family and friends (Bringas, 2013).
Generally, cruise tourists are considered to have a higher income and to be older than traditional tourists (Dahdá, 2003). Nevertheless, the cruise industry has rapidly grown attracting a wider range of travellers, including younger people, families and multi-generation groups. Consequently, the companies in the cruise industry and the tour operators are offering more variety of tours, facilities, entertainment and services (Georgsdottir & Oskarsson, 2017) as these heterogeneous clientele have well-differentiated expectations and preferences (Polykalas & Troumpetas, 2012).
Another characteristic of cruise tourists is the limited time that they stay in each port (Polykalas & Troumpetas, 2012). In fact, cruise tourists, like the rest of non-traditional tourists, do not spend the night in the places they visit (Heath, 2012), but when they do, they completely become a traditional tourist flow, as long as they use the local lodging services instead of their staterooms (Dahdá, 2003).
Among the different activities organized on a cruise, excursions associated with possible re-visitation are seen as important in the cruise tourism sector since a high percentage of the passengers intend to return for longer periods at a later stage (Jugmohan & Giampiccoli, 2015). The return-cruise-tourists are very favourable for regional economies, particularly if they re-enter as tourists who stay for more than 24 hours as the tourists in this market segment spend more (Cárdenas, 1990). This is mainly due to their need for accommodation in addition to their spending on services and goods commonly demanded by the short stay tourists, for example, handcrafts, restaurants, and parks (Dahdá, 2003). Moreover, many cruises are sold by tour operators in combination with air transport to allow tourists to access remote areas where navigation is not possible (Candela & Figini, 2012).
To measure the effect of tourism on a national economy, many studies have focused on the impact of tourist expenditure (Akan, Arslan, & Isik, 2007; Balaguer & Cantavella-Jordá, 2002; Bayramoglu & Ari, 2015; Lean, Chong, & Hooy, 2014), some others on tourist arrivals (Kum, Aslan, & Gungor, 2015; Lau, Oh, & Hu, 2008; Loría, Sánchez, & Salas, 2017), or on both (Phiri, 2016). To evaluate the economic impacts of the cruise activity, it is necessary to take into account the different types of cruise related expenditure in order to identify if cruise tourism is economically viable (Brida & Zapata, 2010a).
Effectively, to quantify the economic impact of a cruise ship’s visit, consideration must be given to whether the destination hosts a port of embarkation, port of disembarkation, or only a port of call, as well as the facilities and infrastructure available for both ship operations and passenger needs (Dwyer et al., 2004). Cruise tourists are considered to have an impact on a national economy similar to that of other foreign visitors (Dwyer & Forsyth, 1998).
Cruises affect the local, regional, and national economy; the main economic benefits come through supplies, port services, local and state taxes, and passenger and crew spending (Polykalas & Troumpetas, 2012). Additionally, the arrival of cruises produces an increase in the number of informal salespeople who are looking to obtain a benefit from the passengers (Brida & Zapata, 2010b).
Together with its popularity and geographic reach, the social and environmental impacts of cruises have also grown. Governments, investors, environmental pressure groups, and the media now have a growing interest in managing these impacts (Jones, Hillier, & Comfort, 2016) as the environment is tourism’s most important resource, and cruises can create large environmental negative externalities (Caric, 2010). For instance, large cruise ships emit greenhouse gases, and waste from ships damages marine ecosystem (Jones et al., 2016). Social impacts have also been reported as there have been reports of the loss of regional languages in some Caribbean destinations (Brida & Zapata, 2010b).
Finally, as Jones et al. (2016) comment, the management or mismanagement of these impacts has the potential to affect companies’ valuations by impacting the profits, assets, liabilities, and cost of capital.
II. Tourism and violence
Hospitality, amiability, and security are traditionally seen as central factors in determining tourist arrivals (Ramírez, 1994). The absence of terror or violence is considered as a pre-condition for destinations to develop as tourism is an industry where supply and demand can be affected by extreme events such as terrorism or political violence (Araña & León, 2007). For example, in the case of Sri Lanka, it has been found that major war-related incidents are capable of reducing the number of tourist arrivals compared to when there is peace (Fernando, Bandara, Liyanaarachch, Jayathilaka, & Smith, 2013).
This negative effect that violence has on arrivals indicates that international tourists take into account the risk of victimization when choosing a destination (Altindag, 2013). Therefore, risk perception together with internal factors may determine a tourist’s motivation to travel, together with external factors related to terrorism, such as media reports about a terrorist incident or threats (Mc. A Baker, 2014). For that reason, terrorism that targets tourism can be viewed as a disaster for a destination and ensuing events can create a serious tourism crisis (Sönmez, Apostolopoulos, & Tarlow, 1999).
However, some countries have experienced significant increases in violence over recent years, but despite this they have become popular tourist destinations (Araña & León, 2007). Some places affected by misery and war have become important tourist destinations because of what is known as “dark tourism”: when tourists go to a place after or during violent acts (Robb, 2009). For example, in the Middle East, after 9/11, there was an increase in the number of international tourist arrivals despite the attacks against tourists in that region and the war in Iraq (Hazbun, 2006).
Travelling to places associated with war is not a new phenomenon; in fact, dark tourism has been considered as a possible way to leverage tourism in places such as Palestine, where tourism has mostly depended on pilgrimage to a place that is experiencing death, violence, and political tension (Isaac & Ashworth, 2012). In the same vein, in countries such as Burundi that have suffered decades of inter-ethnic and inter-community conflict, it has been noticed that tourism can increase cooperation, improve relations among former enemies, and promote post-conflict reconciliation through vocational education, business motivation, and achieving common goals (Novelli, Morgan, & Nibigira, 2012). Tourism is also considered to represent an opportunity to improve bilateral relationships with commercial partners and with those nations with which there are differences since it represents an opportunity for mutual understanding and commerce (Molinero, 2007).
For its part, cruise tourism is seen as one of the safest ways to enjoy foreign travel, particularly after 9/11, and, in fact, because different terrorist attacks harmed tourists, tour operators turned to cruises as a way of selling safe travel and a luxurious modern option where passengers are isolated from the local population. Travelers, therefore, are also separated from the cultures they visit at each port of call (Tarlow, Korstanje, Amorin, & Goncalvez, 2012).
In Mexico, there was vertiginous growth in the level of violence that began in 2008, during the war of drugs that brought, as a consequence, not only the rise in the number of homicides committed in the country (Bergman, 2012), but also in the number of kidnappings (Vélez et al., 2014). It is important to mention that 2008 is also the year when the international financial crisis began, which caused strong negative impacts on the Mexican economy; for example, unemployment increased to 3.98% as 1.922 million became unemployed in just one year (Díaz-Bautista, 2009).
Continuing with the Mexican case, violence has been associated with both drug trafficking and the economic attraction that committing a crime has on young people (De la O & Flores, 2012). Moreover, a statistically significant relationship has been found between income inequality and violent crimes since 2005, but not previously. This is mostly due to the reduction in the cost of criminality caused by the proliferation in the number of criminal gangs during the war of drugs (Enamorado, López-Calva, Rodríguez-Castelán, & Winkler, 2014).
In this context, cruise-related-tourism in Mazatlán, in the Mexican state of Sinaloa, was deeply affected by the exponential increase in violence; hence, shipping companies gradually started to cancel their arrivals to this port from 2011, and, despite the public and private sectors having tried to coordinate a tourist security plan, the return of the shipping companies has been affected by the increase in violence generated by drug trafficking (Peinado, 2017).
Another port affected by the high indices of violence was Acapulco in the Mexican state of Guerrero. Acapulco, once a principal tourist destination in Mexico, underwent an increase in killings and violence from drug cartels. In fact, during 2016, the U.S. State Department banned government employees from going there; the same year, the port received only 18 ships, fortunately during 2017, 32 ships were expected to arrive in Acapulco: an increase of 78% (McClure, 2017).
On a national scale, the number of recorded kidnappings has been proved to cause a negative impact on the growth rate of cruise tourists. This has prevented Mexico from achieving its potential in this tourist subsector; therefore the application and continuation of security policies to palliate the negative effects produced by the violence on the entrepreneurial tourist sector are crucial. These are needed in order to turn the country into a more profitable and secure place and to permit tourist companies to have a steadier demand level (Sánchez & Cruz, 2015).
For their part, Sánchez & Cruz (2017) have found that the increase in the number of registered kidnappings on the Mexican border have also negatively affected the arrival of international excursionists. Although they mention that this was initially connected with 9/11, the negative tendency has deepened due to the increase in kidnappings registered on the border states.
However, tourism activity in Mexico has continued to grow in spite of the increase in violence; in fact, in the period between 1997-2016, the only years Mexico stayed out of the list of the ten most visited countries in the world were 2012 and 2013 (Datatur, 2018).
III. Data
A. Sources and descriptive statistics
In order to study the impact of kidnappings on cruise tourism demand in Mexico, quarterly time series data from the first quarter of 1997 to the last quarter of 2017 (N = 84) were obtained from the following sources: number of inbound cruise tourists to Mexico in thousands of persons from the INEGI (2018), number of registered kidnappings in Mexico from the Executive Secretariat of the National Public Security System (SESNSP) (2018) and U.S. GDP in billions of chained 2009 dollars from the Bureau of Economic Analysis (BEA) (2018), part of the U.S. Department of Commerce.
The number of cruise tourists was originally obtained in monthly data and was aggregated into quarterly observations for consistency with the U.S. GDP. In the case of kidnappings, the data were found as disaggregated monthly observations by state, and it first had to be added to obtain monthly national data and then added again to obtain quarterly observations. Both series, the cruise tourists and the kidnappings, were seasonally adjusted with the Census X12 filter since using a smoothing technique facilitates the identification of trends and critical patterns in the data (Pindyck & Rubinfeld, 2001). The U.S. GDP was already seasonally adjusted (seasonally adjusted annual rates).
It is important to mention that the U.S. GDP is introduced in the model given that most of the cruise passengers come from the U.S. (Georgsdottir & Oskarsson, 2017), and the income level in the country of origin is considered as one of the most important determinants when deciding whether to take a trip (Boer, 2016; Chevillon & Timbeau, 2006; Stabler, Papatheodorou, & Sinclair, 2010) since tourism is considered as a luxury good (Smeral, 2003), so that its demand increases more than proportionally when income grows (Varian, 1992).
Figure 1 shows trends for kidnappings and cruise tourists. A noteworthy observation is that trends move in opposite directions: when the kidnappings increase, the number of cruise tourists decreases, and vice versa. Figure 1 also illustrates that during the financial crisis of 2008 the number of cruise tourists shrank.
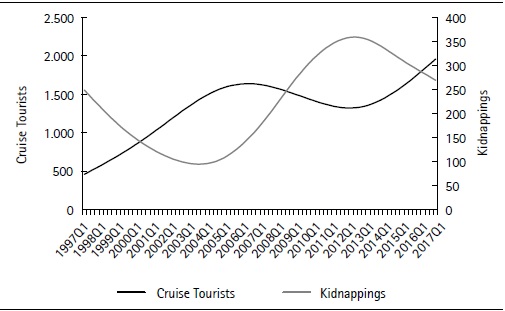
Source: own elaboration based on INEGI (2018) and SESNSP (2018).
Figure 1. Cruise tourists and kidnappings (Trends)Note: trends were obtained by applying the Hodrick & Prescott (1997) filter to the seasonally adjusted series, using = 1600 as smoothing parameter.
In Figure 2, the boxplots show that the mean of all three series lies in the shaded region for the approximate confidence intervals for the median. The nearness between the mean and the median provides empirical evidence that the data are approximately symmetrical (Steinberg, 2011). Figure 2 also provides evidence of the absence of outliers in the three considered seasonally adjusted series.
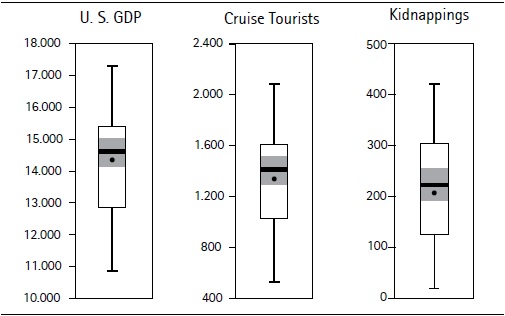
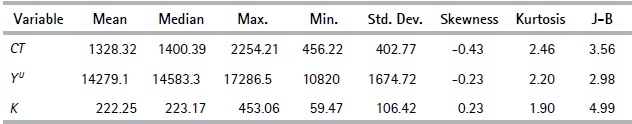
Table 1 summarizes the descriptive statistics of all three seasonally adjusted series. The Jarque-Bera (J-B) normality test results indicate, in all three cases, that there is no evidence to reject the null hypothesis of normality at the 5% significance level.
B. Unit root tests
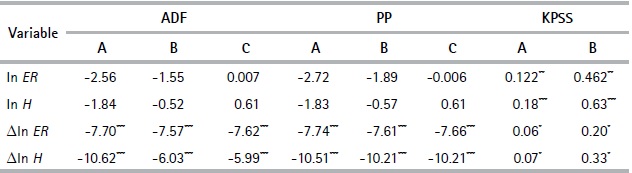
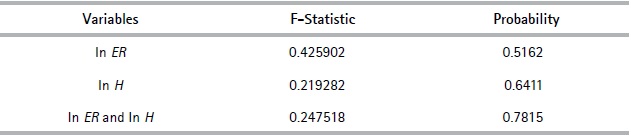
All three seasonally adjusted series were transformed into natural logarithms, and their integration order was tested by using the following unit root tests: Augmented Dickey-Fuller (ADF), Phillips-Perron (PP), and Kwiatkowski-Phillips- Schmidt-Shin (KPSS). The results are summarized in Table 2.
Table 2. Unit root tests
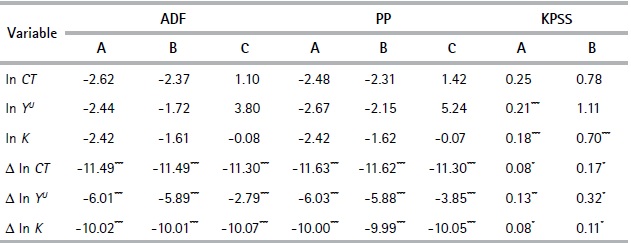
Note: A. - trend and intercept, B. - intercept and C. - none. Superscripts *, ** and *** denote, respectively, rejection of the unit root hypothesis at the 10%, 5%, and 1% significance levels.
Source: Authors’ estimations based on INEGI (2018), BEA (2018) and SESNSP (2018) data.
The results from unit root tests suggest that all three series are stationary, I (0), in first differences, or, in other words, that the logarithmic series have integration order one, I (1). In the case of kidnappings, the KPSS test indicates, in its two specifications, that the series is stationary in levels, but the ADF and PP tests do not. The KPSS test specification with trend and intercept indicates that ln YU is stationary in levels, but the rest of the tests, including the KPSS test with intercept and no trend, do not reject the unit root hypothesis in levels.
IV. The model
We propose an ARDL model with log-linear specification to test the effect of kidnappings and U.S. GDP on long-term cruise tourism demand in Mexico. ARDL models are estimated using the Ordinary Least Squares (OLS) method (Charemza & Deadman, 1997; Nkoro & Uko, 2016; Srinivasan, Kuman, & Ganesh, 2012) so that a log-linear specification measures elasticities (Gujarati, 1999). In addition, all three considered series to estimate the ARDL have an integration order that is less than two (Table 2), which is required by the ARDL models (Nkoro & Uko, 2016).
An intervention variable was used to help the model correctly simulate those periods when the series of cruise tourists presented abrupt changes (1).
 (1)
(1)
The number of lags in the ARDL model was determined by the Akaike Information Criterion (AIC), a maximum of six lags was allowed in each variable. The AIC results indicate an ARDL (6,0,0) as the best possible estimation among 294 evaluated models. Figure 3 illustrates the best twenty estimations.
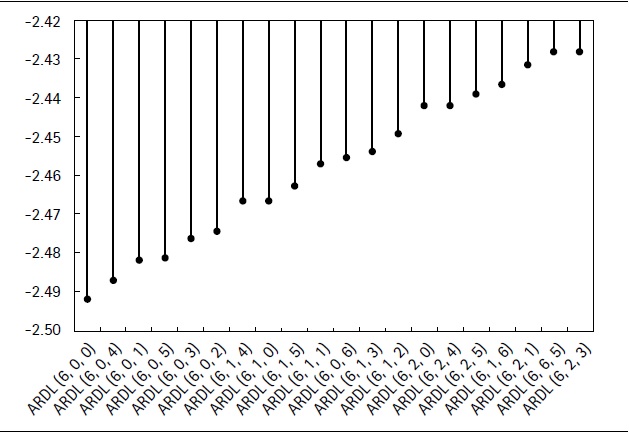
According to the AIC (Figure 3), the computed ARDL has the following functional form as expressed in (2):
 (2)
(2)
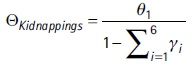
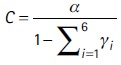
Where  and
and  are defined as before,
  is the intercept term and
  the error term. It is important to mention that INLF6 was introduced in the model as a static exogenous variable.
To estimate (2), the OLS method was used, and then a set of correct specification tests were performed to test for normality, stability, goodness of fit, and to prove the absence of eventualities such as autocorrelation, heteroskedasticity, and structural change. Once we confirmed that the estimated ARDL model satisfied the correct specification criteria, we performed the cointegration bounds test.
The F-statistic (standard Wald test) used in the bounds test has a non-standard distribution under the null hypothesis of no-cointegration relationship, irrespective of whether the underlying variables are I (0), I (1) or fractionally integrated (Nkoro & Uko, 2016; Srinivasan et al., 2012).
Pesaran, Shin, & Smith, (2001) developed the bounds procedure to test for the existence of a level relationship. They present two sets of bounds for the F-statistic: if the computed F-statistic falls above the upper critical value, the null hypothesis for no long-term relationship can be rejected. Conversely, if the computed F-statistic falls below the lower bound, the no-cointegration hypothesis is not rejected. Finally, if the calculated F-statistic falls in between the bounds, then the test is inconclusive.
Nevertheless, according to Narayan (2005), the critical values proposed by Pesaran et al., (2001) are asymptotic and cannot be used with short samples, so Narayan (2005) reports a table with specific critical values for different sample sizes ranging from thirty to eighty observations. Given the number of observations in this study, the F-bounds test is performed by contrasting the computed F-statistic with both critical values.
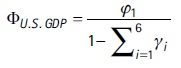
Due to the dynamic specification of an ARDL, it is possible to transform the model into a relation that represents the response of the dependent variable in the long-term to the explanatory variables. Following the specification given by Charemza & Deadman (1997), and considering that the model is an ARDL (6,0,0), the long-term coefficients for (2) are estimated as shown in (3), (4), and (5)
 (3)
(3)
 (4)
(4)
 (5)
(5)
So that the Error Correction Model (ECM) associated with (2) takes the form shown in (6):
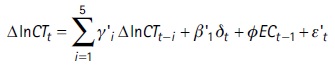 (6)
(6)
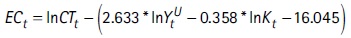
Where ECt is the Error Correction Term defined as in (7):
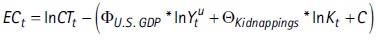 (7)
(7)
In (6), the coefficient  is expected to be negative, for this implies convergence; it would, therefore, make sense to claim that there is a long-term relationship among the considered variables (Nkoro & Uko, 2016).
V. Empirical results
Once we verified using the unit root tests that all three considered series to model cruise tourism demand in Mexico have a less-than-two integration order (Table 2), an ARDL model with restricted constant and no trend specification was estimated according to the specification determined by the AIC (Figure 3). The results are summarized in Table 3.
Table 3. ARDL (6,0,0)
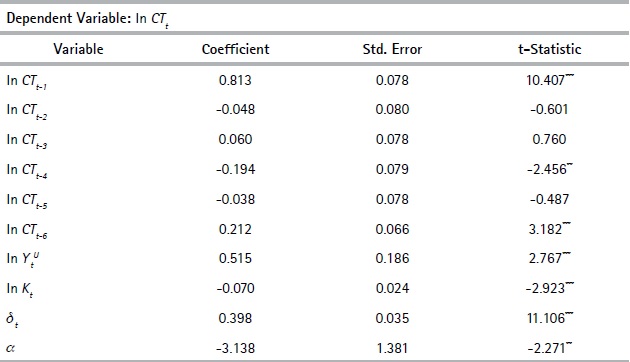
Note: adjusted sample 1998Q3 – 2017Q4; *** and ** respectively denote significance at the 1% and 5% levels.
Source: authors’ estimations based on INEGI (2018), BEA (2018) and SESNSP (2018) data.
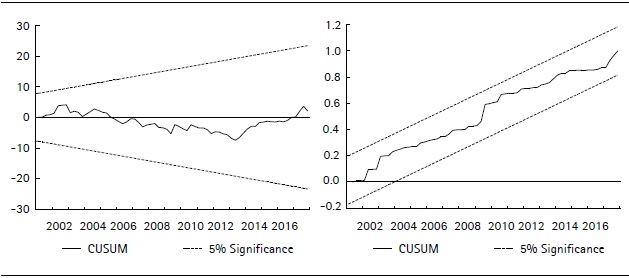
After calculating the ARDL, we corroborated that the model satisfies the correct specification conditions (Table 4). We also verified that the model adequately fulfils the stability tests CUSUM, CUSUM of Squares (Figure A1), and the multiple breakpoint test (Table A1).
Table 4. ARDL correct specification tests
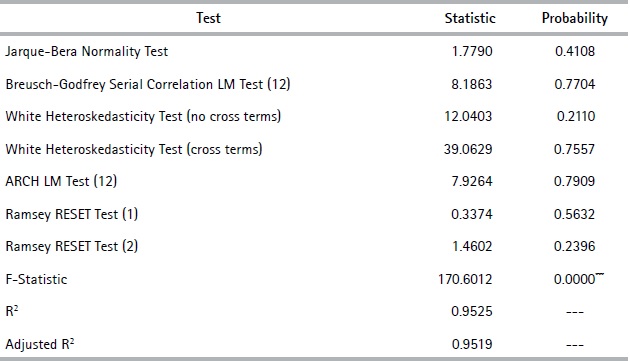
Note: *** denotes significance at the 1% level.
Source: authors’ estimations based on the ARDL model.
Given that the model strictly satisfies the correct specification tests at the classical confidence levels, it makes sense to perform the F-bounds test. For this purpose, the restricted constant and no trend specification was used, and the F critical values proposed by Pesaran, et al., (2001) were complemented by those recommended by Narayan (2005).
The computed F-statistic for the bounds tests clearly exceeds the critical upper bound value at the 1% significance level in the three cases shown in Table 5, so the null hypothesis of no-cointegration can be strictly rejected (Table 5).
Table 5. F-Bounds Test (restricted constant and no trend)
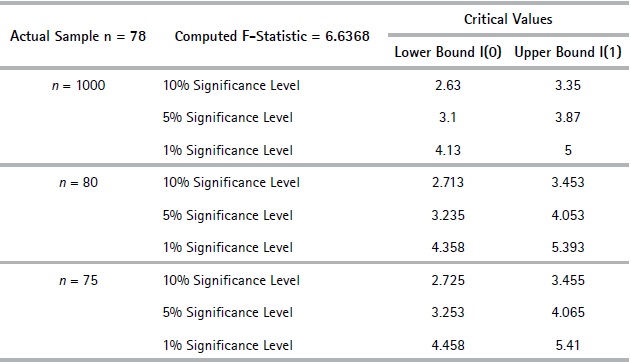
Sources: critical values for n = 80 and n = 75 were obtained from Narayan (2005, p. 1987) and critical values for n = 1000 were obtained from Pesaran et al. (2001, p. 300). The F-statistic was computed according to the ARDL results.
The long-term coefficients were estimated once it was confirmed that there is indeed a level relationship between the studied variables. The computed long-term coefficients were obtained by using (3), (4), and (5) (Table 6).
Table 6. long-term coefficients
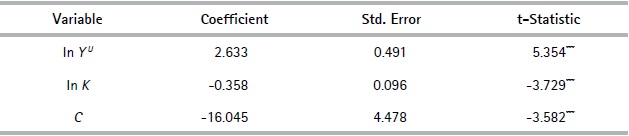
Note: restricted constant and no trend; superscript *** indicates significance at the 1% level.
Source: authors’ estimations based on the ARDL results.
From the long-term coefficients, it is possible to estimate the ECM (Table 7), where ECt is computed, according to (7), as shown in (8).
 (8)
(8)
The coefficient associated with ECt-1 indicates that 19.5% of the disequilibrium in the number of cruise tourist arrivals in the previous period is being adjusted in the current period; therefore, this result supports the existence of a long-term relationship (Table 7).
Table 7. Error correction model
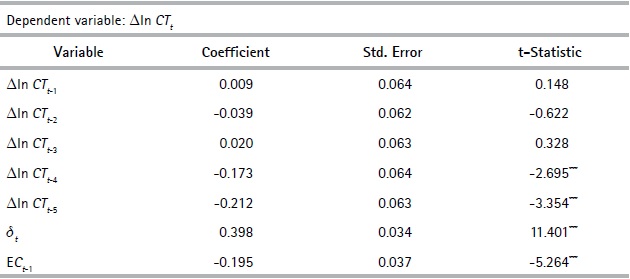
Note: Superscript *** indicates significance at the 1% level.
Source: authors’ estimations based on the ARDL model.
Given the results from the correct specification tests, the bounds test and the ECM, it makes sense to interpret the coefficients in the long-term equation (Table 6). First, the long-term equation indicates that when the U.S. GDP grows by 1%, the arrival of cruise tourists to the Mexican coasts grows by approximately 2.63%.
This first result shows that the Mexican cruise sector is very sensitive to the changes in U.S. economic growth, or, in other words, that the arrival of cruise tourists to Mexico is highly elastic to the changes in U.S. GDP. This result is concordant with the fact that most of the cruise tourists come from the U.S.
The long-term coefficient associated with the kidnappings in México shows the negative effect this crime has on cruise tourism. More precisely, it shows that if kidnappings grow by 1%, the cruise tourist arrivals will shrink by 0.358%. This result means that cruise tourism in Mexico is inelastic to the changes in the recorded kidnappings.
Not only does this result show that the high incidence of a high-impact crime is capable of reducing the number of tourist arrivals, regardless whether the crime is perpetrated or not against tourists, but it also provides evidence that the environment of insecurity in Mexico has not yet had a huge impact on the number of cruise tourists arrivals. On the contrary, as previously mentioned, the number of traditional and non-traditional international tourists has continued to rise during recent years.
Nevertheless, it is necessary to consider that the long-term coefficient associated with kidnappings is negative and statistically significant, so while it is true that cruise tourists arrivals are inelastic to the changes in kidnappings, it is also true that an increase in such crime prevents the nation from reaching its tourist potential. In addition, the reduction in the number of tourist arrivals impacts local businesses’ income as the demand of goods and services shrinks, which causes unemployment (De la Torre & Navarrete, 2013).
On the other hand, the low impact caused by kidnappings on the number of cruise tourist arrivals could be related to the fact that Mexico has gained, on the whole, a positive reputation as a tourist destination; Mexico has a reputation of being a hospitable country in spite of the perceived risks (Girault, 2013). Another factor that could be offsetting the effect of the risk of potential tourists being victimized is the attractiveness of the country’s beaches; it has been found that countries with a coastline are more attractive tourist destinations. This suggests that the risk of victimization and the attractiveness of the destination may be substitutable traits (Altindag, 2013).
To complement these results, the statistical significance of both variables (the real exchange rate index (ER) and the intentional homicides (H)) was tested with the omitted variables test. Before performing the test, we corroborated that both series have an integration order less than two (Table B1). The test was carried out, firstly, by separately testing each variable, and finally by testing them together. In the three cases, the results indicate that the null hypothesis of insignificance cannot be rejected (Table B2).
Finally, Mexico has consolidated itself as a tourist destination despite the security crisis the country has recently undergone, which can be seen in the international rankings. It is also true, according to the estimated model, that a high-impact crime, including kidnapping, inhibits the arrival of cruise tourists, and the harmful effects of this remain in the long-term.
VI. Conclusions
In this study, cruise tourist demand in Mexico, measured by the number of cruise tourist arrivals, was modelled using an ARDL (6,0,0) model that considers the number of recorded kidnappings in Mexico and U.S. GDP as explanatory variables. We found, by using the F-bounds tests, that there is a long-term relationship between the included variables and a relatively fast rate of convergence with the equilibrium. By using the Error Correction Model, we found that 19.5% of the disequilibrium in the cruise tourist arrivals in the previous period is corrected during the current period.
The results obtained in this work indicate that cruise tourist arrivals to Mexican coasts are very sensitive to the changes in U.S. GDP. Since cruise tourists change by 2.63% when U.S. GDP changes by 1%, it is possible to claim that the demand for cruise tourism in Mexico is highly elastic to variations in the U.S. economy.
This result is congruent with the fact that most cruise tourists come from the U.S. and that the cruise sector in Mexico is highly dependent on U.S. economic conditions. Therefore, it is necessary, without disregarding this important source of cruise tourists, to diversify the demand. This would not only permit Mexico to face changes in the preferences and tastes of American cruise tourists, but it would also lessen the effect of possible ups and downs in the U.S. economy on the cruise sector.
Kidnapping is a factor that will reduce cruise tourist arrivals. The long-term coefficient associated with this variable shows that cruise tourist arrivals will shrink by 0.358% when kidnappings increase by 1%. Since this decrease is less than proportional, it is possible to affirm that cruise tourists arrivals are inelastic to changes in kidnappings.
The negative sign related to kidnappings in the ARDL is congruent with those approaches claiming that violence and high-impact crimes are capable of reducing the volume of tourist entrances in a country despite the effect of this high-impact crime being inelastic on cruise tourists. The low impact revealed by the model could be directly associated with both the offsetting effect of the country’s beaches, as mentioned by Altindag (2013), and the fact that cruise ships are considered more secure for travellers (Tarlow et al., 2012). Another factor that could have an influence on this result is, as commented by Girault (2013), that Mexico has gained a reputation for being a hospitable nation.
We also tested, through the omitted variables test, if it was possible to introduce both the real exchange rate index and the intentional homicides into the model. Nevertheless, the results indicate that, given the functional form of the model, the null hypothesis of insignificance cannot be rejected. This result is congruent with the low long-term coefficient associated with kidnappings in the model and reinforces the idea that Mexico appeals to travellers’ tastes and preferences in spite of the increasing violence.
Despite this result, ports such as Mazatlán have been severely affected by the increase in violence since shipping companies gradually started to eliminate it from their itineraries: there were no international cruise arrivals for two years (Peinado, 2017). Unfortunately, Sinaloa, together with the states of Guerrero, Michoacán, and Tamaulipas, is ranked with a level 4 (do not travel) by the Travel Advisory Level of the Bureau of Consular Affairs (2018); thus, it is possible that the problems in the cruise sector will continue until Mexico is capable of reducing the violence generated by drug trafficking that has led to high-impact crimes such as kidnappings and homicides.
Unfortunately, suppressing high-impact crimes that affect personal security is particularly difficult for they require professional local law enforcement. As there has been a dearth of professional policing, the crimes have grown worse in recent years (Noriega & Trigos, 2015). Nevertheless, Mexico needs to implement security policies that reduce the rates of high-impact crimes, not only to attract more tourists, but also to provide its residents with security and to make the country more profitable.