


 English (pdf)
 Article in xml format
 Article references
 Send this article by e-mail
 Cited by SciELO
  Cited by Google
  Similars in
SciELO
Similars in
SciELO  Similars in Google
 Permalink
Introduction
Many of Mexico’s major current national problems derive from the varying economic growth levels of each of its states. The growth rate since the early eighties of the last century has been well below the historical norm for the previous four decades (Ros, 2013). This has hindered job creation in the magnitude demanded by the size of the economy and population growth.
In this sense, there has been a significant decrease in the secondary sector, specifically in manufacturing as a generator of employment and a pole of absorption of the labor force as it was in past decades (de Jesús and Carbajal, 2017). Now, the tertiary sector, also called the services sector, has been strengthened as the main generator of employment and of the absorption of the employed population, which in Kaldor’s (1984) view is known as the premature maturity of the manufacturing sector. This process itself would not be a problem since productive tertiarization is a constant at the international level (see Pérez-Campusano et al., 2018, Maroto-Sánchez and Cuadrado-Roura, 2009 and Cuadrado-Roura, 2016), except that the working conditions of these sectors are not adequate. Labor precarization has increased due to the fact that the highest growth has occurred in activities with low added value and low productivity, as well as to labor market flexibility in the country (Andrés-Rosales, Czarneski and Mendoza, 2019).
The process of economic opening in Mexico that began in the mid-1980s has accentuated the disparities between Mexico´s states and regions. Everything indicates that even in this scenario of growth, states with activities predominantly in the secondary sector are those that have shown a greater dynamism and growth due to their commercial links with the international market. In this regard, Asuad and Quintana (2010) argue that regional inequality gap between Mexican states has widened, at least for the years 1986-2008. Germán-Soto and Escobedo (2011) coincide with this, they show that the states of the center and north border are distancing themselves from the southern states, mainly since the beginning of the commercial opening process. In addition to the above, labor precariousness in the manufacturing sector is higher in the country´s center and south of the country than it is in the north, as shown by Andrés-Rosales et al. (2019).
In this context, the aim of this paper is to analyze the states’ endogenous factors that influence the manufacturing employment, considering that large companies are the main drivers of labor conditions in Mexico, not the micro, small and medium enterprises (SMEs). In line with Andrés-Rosales, Quintana-Romero, Namkwon and Mendoza-González (2019a), we find more micro and SMEs spread out throughout national territory, while large companies are concentrated in only a few states. Through a spatial panel, we measure the impacts of these endogenous and exogenous factors. The hypothesis is that the economic growth of the 32 states of Mexico has led to weaker employment endogeneity. In other words, factors endogenous to the territory are not significant, but the exogenous variables generated within a state do influence employment (endogeneity of the variable) as do the exogenous variables of neighboring states (exogeneity of the variable).
The importance of employment is that it is “a key indicator of the performance of an economy, not only because it is closely related to aggregated production but also because it is a fundamental determinant of the level of well-being of the population” (Mejía, Mejía and Rendón, 2017, p. 43).
The work is divided in three sections; The first section presents a review of the literature that analyzes Mexico’s slow growth. Section two reviews the performance of manufacturing in recent decades and places an emphasis on employment in the states. The third section shows the results of a spatial panel estimation for the manufacturing sector. Finally, in the last section, conclusions are drawn.
1. The context of employment, manufacturing and endogeneity in Mexico
In the mid-1980s, the Mexican economy began a process of economic liberalization intensified with the beginning of the North American Free Trade Agreement in 1994. It was believed that free trade would increase exports and consolidate the long-term sustained increase in economic activity, with positive effects on the country´s economic growth and job creation. However, results show that the balance of free trade, in terms of employment and growth, was not as expected. In fact, specialists agree that in recent years “manufacturing has had the worst performance in terms of job creation: in 16 years -for the period 1994-2011-it barely generated just over 500,000 jobs, at an average annual growth rate of 1.0, while during 2000-2011 its average annual growth rate was negative (-1.7%), which represents more than half a million jobs lost. No other sector has suffered such a poor performance in terms of employment” (Dussel Peters, 2011, p. 20).
Sectors without links to foreign trade were expected to not generate employment. Even though manufacturing is strongly linked to export dynamics, it has not been able to significantly influence the process of job creation (Dussel Peters, 2003a).
This behavior is largely due to the slow growth of the Mexican economy during the last thirty-years (Calderón and Sánchez, 2012, Loría, 2009, Ros, 2013, 2010a, 2010b and 2008). The effects of this include the accumulation of unemployment, idle productive capacity, and social backwardness. During the past three decades, economic growth has suffered a severe slowdown compared to the previous forty years. Between 1981 and 2005, Mexico’s GDP per capita grew at an average annual rate of 0.5% compared to 3.2% in the 1940-1981 period (Ros, 2008). As stated by Ros (2013, 2010a and 2010b), this performance is the result of the fall in income per capita from 1982 to 1989, a period characterized by strong external shocks, acute macroeconomic instability and a continuous transfer of resources abroad in a scenario of severe rationing of external credit. Moreover, Ros (2013) reports that Mexico’s slow economic growth is the result of the poor performance of the total factor productivity.
This aggravates the situation even more; if labor productivity does not grow, salaries cannot follow. Munnell (1990, p. 3) argues: “productivity growth is the major determinant of the future living standard. If the efficiency in the use of resources rises at 2.5 percent per year, people can expect their real wages, and their living standards to double every 28 years or roughly once a generation. In contrast, productivity growth of 0.5 percent means that children can expect living standard only 15 percent higher than those of their parents.”
In such circumstances, the empirical evidence shows that the export-led growth strategy has had favorable but limited effects on production, which have been offset by imports of manufactures, displacing domestic production. It also shows that the positive effect of exports on direct and indirect employment is not as important as the effect of national production (Ruiz-Nápoles, 2004).
The above is remarkable given that manufacturing has historically been a benchmark by which to understand the quality of employment in Mexico.This is mainly due to the fact that economic orientation towards a model in which exports increase in importance for global demand, had a significant effect on employment, especially in the 1993-2000 period. A period in which trade liberalization led to the restructuring of employment towards a greater concentration in the manufacturing sectors of unskilled labor in activities that do not necessarily generate good quality jobs (Cervantes and Fujii, 2012).
The nineties experience provides evidence that the manufacturing sector has not been an important generator of formal employment. This may be associated with the slow growth rate of the economy in recent decades, which has been widely studied by various authors with different hypotheses, and from different perspectives, ranging from the historical linkage of Mexico’s economic growth to the productive performance of the United States, and the evolution of terms of trade (Mejía-Reyes, Rendón-Rojas and Vergara-González, 2018, Guerrero, 2006). Other arguments state that the establishment of rules of conduct and behavior of macroeconomic policy have helped to reduce volatility and macroeconomic instability, but at the expense of lower growth (Esquivel, 2010); or that the obstacles to growth are found in an environment adverse to productive investment (Perrotini, 2004) and in the low investment rate (Ros, 2008 and Ibarra, 2008).
International processes of global integration play an important role in the growth of the Mexican economy, and specifically in the performance of the manufacturing sector. In this sense, the competitiveness of the regions and countries must be analyzed from a systemic competitiveness approach, in which approaches related to the micro, meso, macro and metaeconomic levels are fundamental as a whole to understand the new global trends followed since the 1970s. Analysis from a purely microeconomic or macroeconomic perspective is not enough (Dussel Peters, 2003d). We must look at the regions’ conditions of territorial endogeneity (Dussel Peters, 1997, 2000, 2002, 2003a, 2003b and 2003c, De Jesús-Almonte, 2019).
This research upholds within this context. The issue of territorial endogeneity becomes relevant if it is understood as the possibility that based on their endogenous characteristics, regions have to take advantage of the virtues of the global process that economies and territories experience, and of the benefits of the market size that comes with the economic opening, favoring regions’ specialization and competitiveness. This refers to the degree of integration of specific territories in the value chain based on their endogenous potential, measured in terms of geographical conditions and the conditions of the factors of production (De Jesús-Almonte, 2019).
A proposed element of analysis to explain the differences in the growth dynamics of economic sectors, regions, and countries is territorial endogeneity. For Mexico and other Latin American countries, Dussel Peters (1997, 2000a and 2000b, 2002, 2003a, 2003b and 2003c), among others have conducted studies under this approach for manufacturing and maquila. These works argue that an important condition in the systemic vision of competitiveness is the degree of territorial endogeneity.
Finally, it can be argued that territorial endogeneity poses elements to analyze the role played by the territory, understood as economic space, in the explanation of growth. Hence, territorial endogeneity, seen as the degree of integration of specific territories in the value chain, means much more. The endogenous nature of territories can be expressed in many ways, ranging from the conditions and provisions of human capital that strengthen the production processes of the different manufacturing branches or divisions, to the possibility of developing regional infrastructure using the same logic of strengthening their productive capacity. These would make such territories susceptible to developing efficient productive linkages that promote regional growth and, in this case, growth in the manufacturing industry.
However, the Mexican economy has focused on the international market, neglecting the local market, so territorial endogeneity, understood as the local capacity to boost economic growth, employment and production, is weak because domestic demand has contracted. This, in turn, influences the contraction of the domestic market. In this sense, considering the fact that only 20 percent of the world’s gross product is commercialized at an international scale (Zevallos, 2003), the domestic market remains vitally important for domestic companies. In this regards, Quintana, Andrés and Mun (2013) argue that exporting companies are important for employment, growth and the country’s development; nonetheless, to rely only on export activity to sustain growth, and development at a national scale can have serious consequences. Based on this argument, this paper builds a model that includes proxy variables of territorial endogeneity of the states and regions of Mexico.
1.1. Theoretical arguments about the determinants of employment
Keynes’s first criticism of the neoclassical model is precisely the existence of the labor market. Keynes (1939) considers that employment is not determined in the labor market but in the goods market influenced by effective demand. In addition, according to Keynes, workers are not hired based on the real wage but on the nominal wage, hence, full employment is only a specific point in the neoclassical analysis, and economies operate below that point of full occupation. Some Keynesian assumptions are idle capacity of the labor factor and of productive resources, and unemployment. Therefore, workers have no control over the real salary they receive; they can only establish agreements on nominal wages.
Within the Keynesian analysis, the salary is recognized as a function of the marginal productivity of labor, as in the neoclassical approach. The core of the theory proposed by Keynes is based on admitting the possibility that, for different reasons, the community as a whole does not spend the entire income. He also observes that when the level of occupation increases, so does the community’s global income. However, consumption grows by a smaller proportion due to psychological reasons. Hence, as employment increases, a growing gap between consumption and income is generated, which needs to be compensated with a greater volume of investments. It is only in this way that the increase in occupation can be sustained (Keynes, 1939). As such, one of his recommendations is precisely to encourage investment as a way to reduce unemployment, and if there is a lack of private investment, public investment must increase. This is contrary to the policies applied to macroeconomic stability in Mexico, where the free market forces have been left to determine both employment and production.
The focus of this paper is based on Keynesian arguments of effective demand to explain the determinants of employment. The fact that employment depends on production is based on Keynesian approaches, in the sense that when a company satisfies the demand for its product, it uses exactly the amount of labor needed to produce the quantity demanded. If more work is needed to produce a larger amount, companies must employ more workers when production demand is higher (Abel and Bernanke, 2004).
The empirical evidence for different economies has provided elements to accept this relationship (see, for example, Lanteri (2013) for the case of Argentina; Dixon, Freebairn and Lim (2004) for the case of Australia; and Lechuga and Varela (2001) for the case of Mexico). From this perspective, it is important for an employment function to consider wages as one of its determinants. In this regard, there are two theoretical arguments that explain this relationship between employment and wages. First, the neoclassical argument considers that wages act as a cost variable with an inverse relationship, so that if wages increase, employment tends to decrease. However, for some economies, there is evidence that the relationship between manufacturing employment and wages is positive. The theoretical explanation for this is based on the efficiency wages of the New Keynesian Economy (NEK). The central hypothesis is that although the payment of a higher salary generates higher costs for the company, it also provides more benefits because of its positive effect on the workers effort and, ultimately, on productivity. Efficiency wages would be the amount that firms pay above the value of market equilibrium wage to avoid falls in productivity (Malcomson, 1981 and Gordon, 1990).
Within post-Keynesianism developed by Lavoie and Stockhammer (2012), it is considered that the wage decline plays a fundamental role in the unequal growth of economies and polarization over the distribution of income. From the authors’ point of view, the essential cause of the long-term evolution of income distribution, and its increasing dispersion, is the change in economic policies and the institutional and legal environment, which in recent decades has been more favorable for capital and for high-level supervisors in general. Thus, the authors Lavoie and Stockhammer (2012, p. 1) do not consider that salary improvement is an endogenous phenomenon, but rather “the distribution of income can be modified or influenced by appropriate government policies that act as much in the distribution of primary income, for example, reinforcing the power of negotiation of unions or ensuring low real interest rates, as in the distribution of secondary income, modifying the tax legislation.”
The authors Lavoie and Stockhammer consider that it is time to change the “distribution policies in favor of capital (pro-capital distribution)” to policies in favor of a more equitable distribution of income through wage improvement (pro-labor distribution), or what they call “a wage-based strategy” that could generate more stable long-term growth than the currently prevailing model. It stems that the wage share of workers will have negative consequences on both the consumption of goods (which reduces effective demand), and on the level of savings (Lavoie and Stockhammer, 2012). This leads us to reflect on the structure of the domestic market within post-Keynesian analysis, and on government policies that are of the utmost importance to enter the path of equitable development.
In Mexico, the macroeconomic policies of stability have focused more on benefiting national and international capital. Following Shaik (1983), with each economic crisis, international investors place greater conditions on the government, and have a higher level of negotiation to impose the salaries to be paid. To overcome this problem, the authors believe that expanding the country’s wage base will not only reactivate the domestic market, but it will also reduce impacts of international shocks if the domestic market is strong. These arguments are used in this paper to analyze employment and to highlight the relationship between production and real wages with employment. The analysis is complemented by the inclusion of the weight of the endogenous conditions of the territories to boost employment, as suggested by Jesús-Almonte (2019).
2. The manufacturing scenario in Mexico
The experience since the nineties reveals that the manufacturing sector has not been an important generator of formal employment. Moreover, Mexican manufacturing has been characterized in recent years as a sector that is expelling work and where job creation has been reduced, even in those branches where exports are growing significantly.
The explanation for this performance could be associated with a relatively high capital intensity of manufacturing, and a relatively low absorption of employment, particularly in the more modern and productive sectors of manufacturing (Cárdenas and Dussel Peters, 2007). It could also be associated with the important changes that have occurred in the structure of the productive sectors during the last decades; in contrast with the industrial and agricultural sectors, the service sector has become increasingly important (see Garza, 2008; González and López, 2007). In this regard, in 1980, the service sector generated 56.3% of the national total GDP, while the secondary sector contributed 39.5% and the manufacturing sector, specifically, contributed 18.1%, while the primary sector only contributed 4.2%. However, by 2015, the contribution of the tertiary sector to total GDP was 62.7%; the contribution of the secondary sector was 34.2%; manufacturing contributed 17.3%; and the primary sector, 3.2% (Carbajal and Carrillo, 2017).
On the employment side, in 1980 the tertiary sector employed 34.1% of the total employed personnel, while the secondary sector did so with 29.1%, manufacturing participated with 18.0% and the primary sector with 36.7%. For 2015, this data changed substantially, 61.4% of the total national employed population is occupied in the tertiary sector, 24.3% in the secondary sector, 16.0% in manufacturing, and 13.3% in primary activities (Carbajal and Carrillo, 2017). In this context, the manufacturing situation is not encouraging since this sector has been considered the driving force of the economy, and its importance lies not only in its direct contribution to output and employment (for Mexico, manufacturing has contributed significantly to the growth of the economy for a long time) but also in finding the indirect effects that these exogenous variables have on the neighboring regions. Manufacturing also articulates, and complements itself with other productive activities and, above all, as mentioned by Sánchez (2012), it is a sector with increasing returns, a high income elasticity of demand, and an important source of innovation and technological diffusion. Manufacturing presents unique characteristics, such as its backward and forward linkages, its potential for the generation of added value and employment, and its capacity for technological diffusion and productivity growth (Dussel Peters, 1997). Thanks to its dynamism, its effects are transmitted to other sectors of activity inducing innovative behavior in economic agents (Garduño, 2009).
2.1. Growth and employment in the states of Mexico
In recent years, specifically from the beginning of NAFTA, gross value added (VACB) and employed population in manufacturing show a tendency towards concentration in production and employment growth in states that are more closely linked to the external sector, specifically those located on the country’s northern border. In order to highlight the importance of the northern border, which has a geographical proximity to the United States of America (USA), the 32 states were grouped into 5 regions: Northern Border, North, Central West, Central East, and South. According to the data on gross value added (VACB) and employed population, in 1988, the Northern Border - which includes the states of Baja California, Coahuila, Chihuahua, Nuevo Leon, Sonora and Tamaulipas - generated 26.0% of total national manufacturing value added, and employed 27.7% of total employed population. By 2013, these variables have increased significantly in the region, generating 35.6% of the VACB, and concentrating 35.9% of the employment generated by the sector in the country (see Table 1).
The North region (which groups Aguascalientes, Baja California Sur, Durango, San Luis Potosi, Sinaloa and Zacatecas), provides the lowest contributions to the country’s manufacturing product. In 1988, it generated 4.2% of the VACB and employed 6.5% of the employed personnel. By 2013, its contribution to the total manufacturing product grew to 6.7% and employed 7.8% of personnel.
Table 1 Table 1. Manufacturing sector Gross value added (VACB)* and employment by regions. Percentage structure, 1988-2013
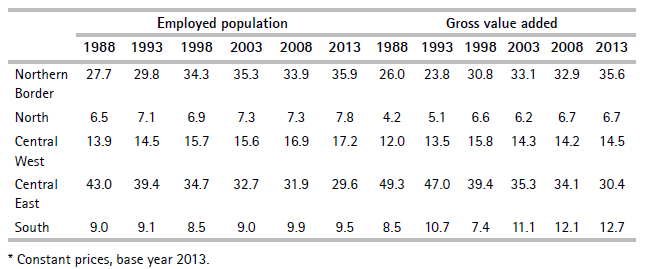
* Constant prices, base year 2013.
Source: Authors based on INEGI (1989, 1994, 1999, 2004, 2009 and 2014)
In the case of the Central West region, production represented 12% of total gross value added in 1988 and employed 13.9% of the total personnel employed in manufacturing. By 2013, it showed a slight increase with 14.5% of VACB and 17.2% of employed personnel.
The Central East region (Mexico City (formerly DF), Hidalgo, Mexico, Morelos, Puebla, Queretaro and Tlaxcala) is noteworthy, as it has considerably reduced its participation both in its contribution to added value and in manufacturing employment. From 1988 to 2013, the region went from 49.3, and 43.0% to 30.4, and 29.6%, respectively (see Table 1). This is explained by the fact that this region incorporates the State of Mexico and Mexico City, which for several decades have been characterized by their growth dynamics in the manufacturing sector, but in recent years have significantly decreased their dynamism. In 1988, these two states contributed with 33.4% of the employed population and with 38.2% of VACB generated of the total national manufacturing. However, these data decreased substantially in 2013, when both states employed only 17.6% of total employed population in the manufacturing sector and contributed 18.3% of total VACB generated by this sector nationwide. Nevertheless, the manufacturing sector continues to be an important determinant of the economic activities of these two states.
Table 2 shows the performance of the states led by the manufacturing sector. To highlight some important changes, the 1988-2013 period was divided into three sub periods: a) 1988-1993, the years prior to NAFTA, b) 1993-2013 to identify the evolution of the sector during the NAFTA; and c) 2008-2013, which includes the recovery phase of the great recession that began in 2008, also because from the first years of the 21st century the specialization of manufacturing has intensified in export intensive and capital intensive activities, but was reduced by the recession in 2008-2009.
Table 2 Table 2. Manufacturing sector Gross value added (VACB)* and employment by regions. Annual average growth rate by periods, 1988-2013
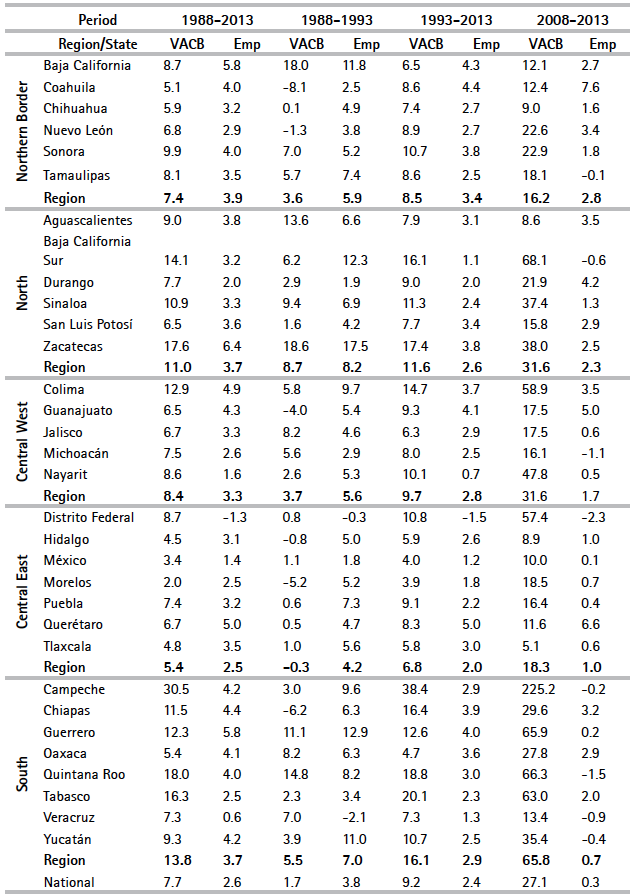
* Constant prices, base year 2013.
Source: Authors based on INEGI (1989, 1994, 1999, 2004, 2009 and 2014)
An important regularity in this period is the interruption of the integration to NAFTA process, and the growing competition with Asia and China, specifically in manufacturing.
In this regard, it has been documented that NAFTA has gone through two different stages (Dussel Peters and Gallagher, 2013). The first stage, from its beginning in 1994 to 2000, was characterized by a process in which the region was largely integrated, due to the increase in trade flows, investments, rules of origin, and specific segments of industrial chains (such as the automotiveauto chain and the yarn-textile-clothing chain). NAFTA was meeting expectations when GDP, trade, investment, employment, and wages grew in the region and intra-industry trade increased significantly. However, in the case of Mexico, this integration did not translate into a broader process that promoted forward and backward linkages (Dussel Peters and Gallagher, 2013), which implied that some sectors were integrated within regions, but also that sectors of other regions could be integrated into exporting dynamics. This caused spillovers from one region to others, and the lagging regions could be integrated into the dynamic companies within NAFTA.
From 2000 to date, NAFTA has been facing a process of deterioration in terms of trade, investment and intra-industry trade. Apparently, Mexico is losing ground to countries like China (Dussel Peters and Gallagher, 2013). Cárdenas and Dussel Peters (2007) point out that since the 2000-2002 period, Mexico’s foreign trade and, particularly, intra-industry trade have undergone significant changes that, in the case of the United States, have been reflected in an important process of commercial disintegration, both in aggregate terms and in its main value chains.
An important feature that can be identified from the data in Table 2 is that the average growth rates of total manufacturing for the 1988-1993 and 1993-2013 periods report higher rates for added value, and lower rates for employment. This would imply that there is growth in the sector but that it is not reflected in an increase in employment since the treaty makes its production intensive in capital and not in labor. This contrasts with the international trend of transnational companies that decide to settle in the Mexican territory driven by low wage costs. We should observe an increase in employment in all sectors, but instead, there is a decreasing trend in the potential or attractiveness of large companies.
Between 1988 and 1993, the average growth of VACB was 1.7%, while employment grew 3.8%. For the 1993-2013 period, an important recovery was reported: added value grew by an annual average of 9.2, reflecting an important recovery in manufacturing production. However, it did not favor growth in employment in the same proportion, resulting in a 2.4% annual average growth, lower than the growth during the previous period.
The performance of manufacturing in the second period may be explained by the recovery of the sector after the Great Recession in 2008-2009, which led to significant growth in VACB (27.1% annual average) but was not reflected in similar magnitudes in employment (the average annual growth rate of employment was 0.3%) (see Table 2).
The states that are supposed to be more closely linked to the world economy, via trade, had greater resentment for the great crisis that began in 2008 (including all the states in the Northern Border region), but they are also the ones that recovered the fastest. It has been documented that the recessions of 1995, 2001-2002 and 2008-2009, seem to be increasingly more severe for richer states compared to poorer ones, and that the states of the Northern Border are increasingly less resistant to recessions (Mejía and Erquizio, 2012). 2.2. The structure of employment and production of manufacturing by state Although the manufacturing sector in Mexico has been considered one of the engines of economic growth and a bastion of industrial development in the country, since the 1980s, it has undergone significant changes in its productive structure. Several authors have discussed these changes; specifically, Mariña (2005) argues that the opening process has not led to a substantial increase in formal employment and better working conditions.
From the description and analysis of production and employment in manufacturing by states and regions, we have attempted to identify some regularity in the evolution of both variables to provide evidence, and to understand the dynamics of employment growth in the manufacturing sector in recent decades, specifically in the 1989-2014 period. The statistical information reveals that the difficulties in the manufacturing sector to make employment growth respond to the slow growth of production. We aim to identify whether factors related to the endogenous conditions of states, in addition to the growth dynamics of manufacturing production can be central factors in the determination of manufacturing employment, as referred by De Jesus-Almonte (2018), and to identify possible spatial effects associated with neighboring states.
3. An estimate of manufacturing employment in Mexico with spatial effects
3.1. Data description
The spatial panel was estimated using information from the Economic Censuses of years 1989, 1994, 1999, 2004, 2009 and 2014, published by the National Institute of Statistics and Geography (INEGI). Data of all years were consolidated for the total manufacturing of Mexico’s 32 states. These are real data at constant 2013 prices. Based on the definition of the variables, as indicated below, the empirical employment model and the aggregate level for the total Mexican manufacturing are estimated.3
3.2. Spatial effects model
From economic theory, we have a priori knowledge that the signs for the parameters to be estimated for total manufacturing were the following (the sign +/- represents the expected sign effect for the coefficients of each explanatory variable):
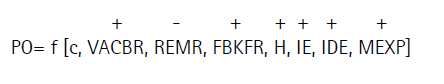
The definition of the variables are presented in the following table:
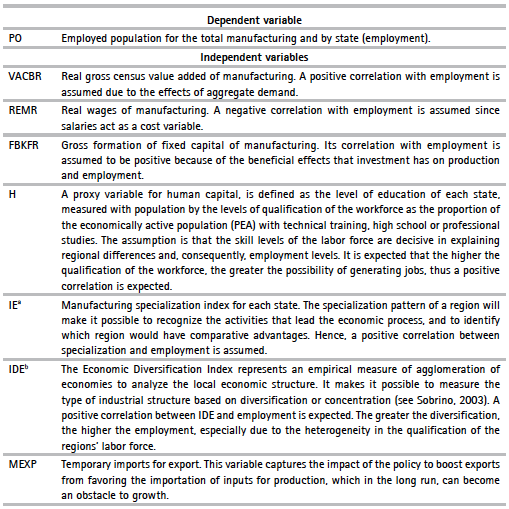
This index compares the relative share of regional activities to national level activities, which makes it possible to measure the concentration of economic activities in the region, compared to those in the country as a whole. Thus, we can determine inter-regional specialization based on the following criteria: if Qij = 1, then the relative size of activity i in region j is identical to the relative size of the same sector throughout the country. In this case, it cannot be said that there is a regional specialization in this activity. If Qij < 1 in region j, then the relative size of activity i is lower than in the country; indicating that there is no specialization. Finally, if Qij > 1 in region j, then the relative size of activity i is greater than in the country; indicating regional specialization in this activity.
b The Economic Diversification Index (IDE) is formally expressed as follows (see Sobrino, 2003)
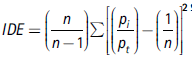
where n is the number of sectors, groups or branches of economic activity, π is production of activity i, and pt is total local production. The IDE is a positive value between 0 and 1: values closer to zero indicate greater diversification of the activity, and values closer to one indicate concentration.
Variables H, IE, and IDE are proposed as proxies of territorial endogeneity conditions of the states and regions of Mexico, as suggested by De Jesús-Almonte (2019), because they are variables that allow us to consider factors that are apparently not tangible but that are influential in a region’s development process.
The variable MEXP (imports for export) for each Mexican state is built from official information from the National Institute of Statistics and Geography (INEGI). This variable is part of the Statistics on Manufacturing and Export Maquiladora. The indicator of Total imported input by manufacturing establishments in the IMMEX program is in thousands of pesos. The inclusion of MEXP seeks to provide empirical evidence on the effect that export promotion programs have on job creation. The impact of such programs is central to the analysis because manufacturing in Mexico has not achieved a process of integration with the rest of the productive system, since, due to its production structure, it requires an increase in imports in order to export. In this context, the great importance of temporary imports for export, at least nationally, is noteworthy. Some authors agree that as of 1993, about 80% of Mexican exports depended on temporary importation processes for export, which expresses their low level of local integration (Dussel Peters, 2009 and Capdevielle, 2007 and 2005)4.
The idea that the more efficient a territory is, the greater the possibilities for investment and production flows to converge to it, would affect not only the growth of economic activity, but also the creation of new formal jobs, and even of higher added value because the structure of its population, the infrastructure, and its human capital enables innovation under the assumptions of the endogenous growth model. Hence, the regions’ endogenous growth requires the promotion and development of comparative advantages and competitiveness. As argued previously, territorial endogeneity must be seen as the degree of integration of specific territories in the value chain. That is, the endogenous nature of the territories can be expressed from the conditions, and dispositions of human capital, and from the possibility of developing regional infrastructure to strengthen the production processes of the different branches or divisions of manufacturing, and the regional productive capacity. This development will make regions potentially susceptible spaces to foster efficient linkages that boost the growth of the region and, in our case, of the manufacturing industry (see Dussel Peters, 2007 and 2004 and De Jesús-Almonte, 2019).
The model in equation [1], is expressed as a linear regression model with panel data of the use of manufacturing for each pair of state-year in equation [2].Variables with the prefix L, indicate logarithmic transformation.
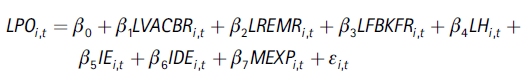
For i = 1,…, 32 states of Mexico, and t = 1989, 1994, 1999, 2004, 2009 y 2014, years of analysis.
The variables that measure the impact of territorial endogeneity on employment are LH, IE, and IDE.
Although there is important evidence in the literature to explain the determinants of employment,5 only a few studies have measured or provided any empirical regularity regarding the weight of the endogenous conditions of the territories to boost employment. The notion of territorial endogeneity is assumed in a strictly functional sense of the territories, so that production rises in the value chain from its endogeneity conditions and generates positive effects on the creation of employment.
Initially, the estimation was made using panel data because, following Wooldrige (2002), the technique makes it possible to capture unobservable heterogeneity, either between economic agents or over time. This technique offers several advantages in that given its ability to control heterogeneity, it reduces multicollinearity and provides more degrees of freedom (Baltagi, 2005). However, as Anselin (1988) observes, some cross-sectional variables can present spatial autocorrelation, hence the decision was made to spatialize the traditional panel model –as suggested by Anselin (1988), Lesage and Pace (2009), Giuseppe (2014) and Elhorst (2014)–, which leads to equation [3]:
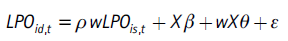
where the error term is as stated in equation [4]:
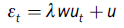
The only difference with previous approaches is q, which captures the spatial behavior of the exogenous variables, r the spatial autoregressive term, and the scalar l that captures local spatial autocorrelation.
Equations 3 and 4 incorporate a spatial weights matrix (W), which is a positive square matrix with its dimension dependent on the size of the data sample that describes the grouping of possible interactions between the spatial units. Elements wij are space weights, which equal zero when there is no neighborhood. The elements of the main diagonal are zero because the possibility of self-proximity is excluded. Finally, the contiguity matrix was standardized, implying that the sum of each row equals one and represents a smoothing of the neighbors’ impacts.
In previous equations, wYt and wXt represent spatial weights of dependent and independent variables respectively, and following authors such as Parajuly and Haynes (2017), the values of r, l and q can generate the following models that we use in this research:
If l = 0 and q = 0 then a spatial autoregressive model (SAR) is generated.
If l = 0 then a spatial Durbin model (SDM) is generated.
The spatial Durbin model (SDM) makes it possible to determine the influence of the exogenous variables generated within a region, known as direct impacts, while the indirect impacts measure the influence of the exogenous variables of the neighbors on the endogenous variable of a given region. With the direct and indirect impacts, as with the totals, the “circular feedback process” can be obtained in the spatial estimates (Anselin, 1988, Lesage and Pace, 2009, Giuseppe, 2014, Quintana and Andrés-Rosales, 2014; Fisher and Getis, 2010).
3.3. Results and discussion
In panel data regressions, the fixed-effect model is generally preferred when working with cross-sectional data, because generally short-term rather than long-term information is available. However, the decision on this type of models is based on the Hausman test. The fixed-effect model is used if the p-value of this test is less than 5%. The best model should be selected among spatial panel models with fixed effects. There are several criteria that authors like Andrés-Rosales et al. (2018) and Parajuli and Haynes (2017) recommend, including the following: a) cross-sectional estimates of the different periods focusing on the values of the Lagrange Multiplier and its robustness, as well as the special lag with its robustness, as suggested by Anselin (1988), Moreno and Vayá (2000); b) considering the statistical significance of the coefficients of the indirect impacts measured by q, as well as the statistical significance of the spatial autocorrelation measures ( r and l); and finally c) the different types of models such as the spatial autoregressive (SAR) and the Durbin spatial model (SDM) are calibrated using the log-likelihood statistics, the Akaike Criterion (AIC) and the Bayesian Information Criterion (BIC). The Durbin Spatial Model (SDM) was chosen in both cases, according to the criteria of the aforementioned statistics and because the values of Rho (r) are greater and more significant.
The main findings of the estimates are reported in Table 3. Columns (a) and (b) are estimates without temporary imports for export (LMEXP), while columns (c) and (d) include LMEXP. This criterion seeks to evaluate whether export promotion programs are factors that significantly influence job generation in the context of the country’s commercial opening.
Due to methodological issues, it is important to clarify that direct impacts are variables that are exogenous to the model, but are generated within each state; that is, they are endogenous to that state. While indirect impacts are variables that are exogenous to the model, but are not determined within a region; instead, they are the exogenous variables of neighboring states, but have an effect on the employment of a particular region. On the other hand, total impacts capture the sum of the direct and indirect impacts of the exogenous variables.
Direct, but endogenous impacts to the state
The results of the estimation showed the following (see Table 3):
a). Remuneration (LREM), sector production (LVACB), gross capital formation (LFBK), human capital index (LH), and economic diversification (IDE) have a positive and significant direct impact on job creation. Although in the case of capital formation, and productive diversification this impact is not important, given that the value of the coefficients is very small.
b). The most important impacts are generated by the sector’s wages, and by production growth. Here, it is striking that the impact of wages is positive and significant, as this goes against the neoclassical approaches in the sense that the higher the remuneration, the lower the demand for workers, but what is observed here is that labor demand in the different states has increased along with the increase in wages.
c). Productivity has a negative impact on the increase of employment in the manufacturing sector, since fewer workers are required when there is an increase in productivity; that is, more goods are produced with fewer but more productive workers. This is a trend observed in the Mexican economy, which means that companies have increased their production but have not influenced the demand for workers in the same proportion, probably because large companies are more capital-intensive than labor-intensive.
d). Human capital (LH), the specialization index (IE) and the diversification index (IDE) measure the importance of territorial endogeneity. We find that human capital has positively, and significantly influenced job creation (coefficients with values of 0.08, and 0.07, respectively), while manufacturing specialization has done so negatively, which means that a greater specialization in the sector tends to hinder job creation. The rationale behind this is that as the sector in the different Mexican regions specializes, it does so with greater technological content, and not so much by increasing its use of employed personnel.
e). Temporary imports for export (LMEXP) have not influenced employment growth. This means that sectors linked to the export sector do not have much influence on the manufacturing employment of the different Mexican regions. These sectors are more technified than traditional sectors and than micro, small and medium enterprises.
Table 3 Table 3. Estimation of the spatial panel in the manufacturing sector, 1989-2014
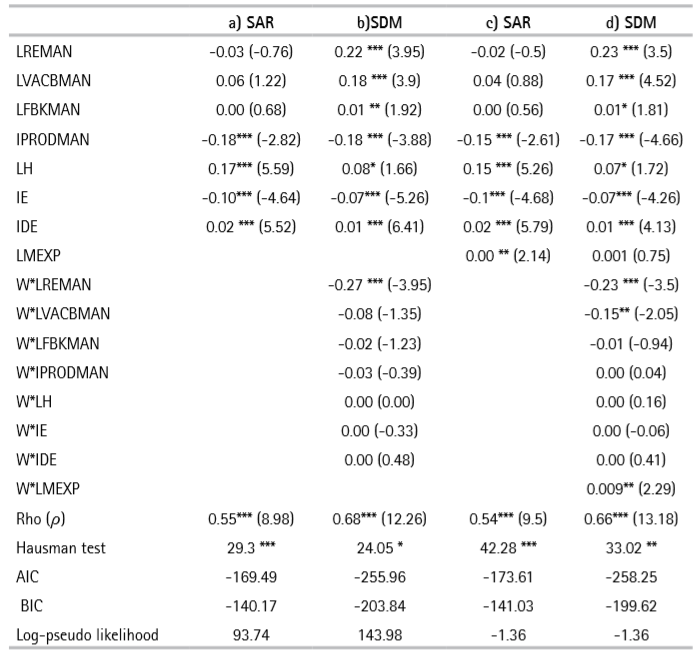
***, **, * are significant at 1%, 5%, and 10% levels, respectively. T-stats are shown in parentheses.
Source: Authors based on INEGI (1989, 1994, 1999, 2004, 2009 and 2014)
f). The values of r are positive and significant, which suggests that manufacturing employment is spatially endogenous with respect to its neighbors. This variable measures global spatial autocorrelation generated by employment, which implies that as employment increases in neighboring regions, a particular region can potentially increase its employment. In economic terms, if a particular state attracts manufacturing companies, the employment that a company will offer will not only benefit the workers of that state but also the neighboring states. This is very recurrent in states such as Mexico City, State of Mexico, Puebla, and Tlaxcala, among others.
Finally, according to Andrés-Rosales et al. (2019a), between 1999 and 2014, employment growth rates for large enterprises (LEs) increased by 0.73%, and employment in small and medium-sized enterprises (SMEs) increased by 0.95%. They show that the share of economic units engaged in the service sector relative to the national total was 36.7%, and observed a similar percentage in the employed population. In the trading sector, these values were 49.9% and 30.5%, respectively. Meanwhile, the manufacturing sector share is 11.7% of the economic units, and 23.2% of national employment. Also, only in the manufacturing sector of all economic units in the sector, microenterprises (MEs) account for 92.5%, SMEs 6.7%, and LEs 0.7%. The total employed population in manufacturing is distributed as follows: 23.2% in microenterprises, 27.1% in SMEs, and 49.7% in LEs. Regarding total gross production, manufacturing LEs represent 77.1% of the output, SMEs 20.6%, and MEs 2.4%. Large companies are determinants of production, employment and wages.
Direct, indirect and total impacts
It is noteworthy that the estimated SDM (spatial Durbin) models are not interpreted as partial derivatives as in the case of the traditional regression (see Lesage and Pace, 2009, and Parajuli and Haynes, 2017). In this regard, Lesage and Pace (2009) mention that a simple change in a region associated with any of the explanatory variables could directly affect a particular region (direct impact) and potentially affect other regions indirectly (indirect impact), which is one of the benefits of using spatial methodology.
In this sense, one of the advantages of spatial panel models is that we can obtain the direct impacts that influence employment in a specific region, which are endogenous to the same region where they are generated, but we can also obtain the indirect impacts that the neighboring regions generate for a specific region. In our case study, this implies that salaries paid within a region, as well as economic growth in the manufacturing sector (VACBMAN), the gross formation of capital, and human capital (H) have positive and significant impacts in the short and long term, while productivity (IPRODMAN) and specialization (SDI) have a negative impact on employment growth in the short and long term (see Table 4).
Regarding indirect impacts generated in the manufacturing sector, it is reported that the wage paid in the neighboring regions has a negative effect on employment growth in a certain region, given the negative coefficient obtained in columns 1 and 2 (-0.31 and -0.52). On the other hand, gross capital formation in neighboring regions tends to affect employment positively in a certain region, given the coefficient obtained in the short and long term (0.05 and 0.08). Hence, the direct impact of remunerations on employment is positive, while the indirect impact is negative.
The coefficient of exports is significant and positive for employment determination from total impact, because the indirect impact of this variable is greater than the direct impact. This means that an increase in exports does not unfold as employment in the region where this sector is located, but if neighbors with these sectors increase their exports, they can influence employment in the given region.
The total impact of wages on employment growth in the manufacturing sector is negative (-0.25 and -0.41), in contrast with the direct impacts described above. This means that an increase in salaries within a region has positive impacts on employment in the same region, but a negative impacts one on its neighbors.
Conclusions
One of the consequences of the breakup of productive linkages in different regions of the country is precisely that the high-tech sectors or exporters do not influence or determine employment in the regions where they have been concentrated. This limits their growth and also restricts their integration. In this way, if a state does not obtain great benefits due to the dynamism of exports, a state with export sectors in the neighboring region has even les opportunities to benefit. What we find is that factors that could boost endogeneity in the states are very weak.
Table 4 Table 4. Direct, indirect and total short and long-term impacts of the manufacturing sector
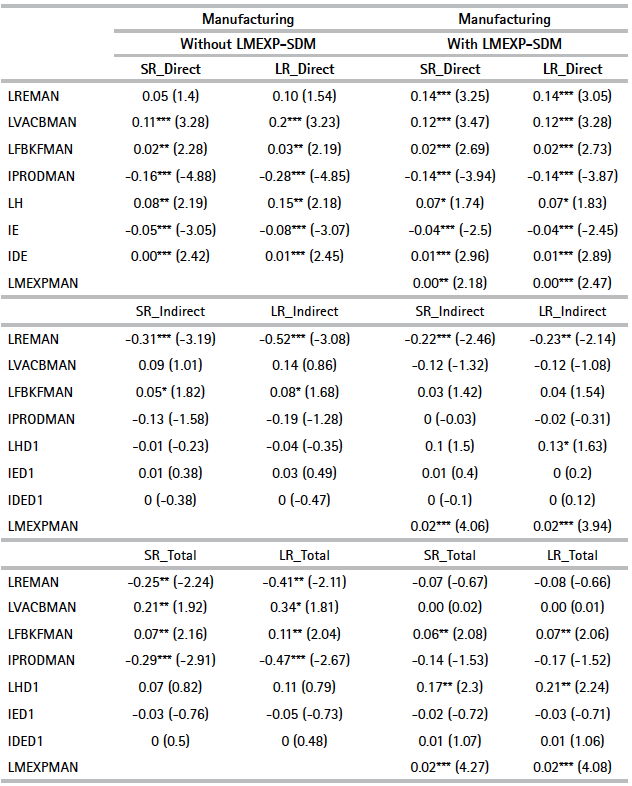
***, **, * are significant at 1%, 5%, and 10% levels, respectively. T-stats are shown in parentheses.
Source: Authors based on INEGI (1989, 1994, 1999, 2004, 2009 and 2014)
Among the benefits of investment are that it generates a boost in economic activity and, consequently, in job creation. In this case, the result for the LFBKMAN coefficient shows a limited effect on employment for total manufacturing, although positive and significant, given a coefficient of 0.02 and 0.03 in the short and long terms.
In relation to qualification levels of available labor (LH), it is assumed that they correspond to development levels in each state, so that education levels are associated with regional endogenous conditions, from income levels of families to infrastructure conditions and the role of governments.
Specialization and diversification in manufacturing are important because they reflect the maturity of the sector to a certain degree. In this sense, the results of the specialization index (IE), and the economic diversification index (IDE) show that the levels of specialization and diversification have not been a sufficient condition to generate growth effects in manufacturing employment. Given the slow growth observed in the macroeconomic environment of the Mexican economy, added to the renegotiation of the North American Free Trade Agreement (NAFTA), we find that, during the period of study, wages have positively influenced employment in the sector. Now, with the new conditions of the trade agreement and with the new government, we hope that the salary increase will also lead to the creation of new jobs. This would imply that the internal market would improve as workers’ income and consumption would increase. The only risk we perceive is that various studies, along with the empirical evidence, show that Mexico imports more goods than it produces. In addition, exports have a large component of imports, since there are no solid productive linkages. Under these circumstances, the increase in wages can lead in the long term to an economic imbalance given that the high rates of growth in wages and employment will lead to demand for either more imported goods or domestic goods with a high content of imported inputs, that will eventually detonate economic crises.
We conclude that the international trend, in which Mexico has been inserted, has shown that worker protection has declined, and the flexibility of the labor market has led to greater job precariousness. This implies that the employment and remunerations generated are not enough. Hence, as mentioned by Lavoie and Stockhammer (2012), the government must modify its policies and its growth model to one that is pro-labor or pro-capital policy, or in their words, a “wage-led and profit-led economic regime,” which is actually more appropriate.
It has been shown that good labor relations improve the propensity of workers to contribute to the production process. Naastepad (2006) found that a 1% increase in real wages leads to a 0.52% increase in labor productivity in the Netherlands. Storm and Naastepad (2009), and Vergeer and Kleinknecht (2010-11) investigated OECD countries from 1960-1984 until 2004. They found that regulated and robust labor market institutions led to faster growth in productivity. Hein and Tarassow (2010) investigated the link between income distribution and productivity growth in six OECD countries and reached the same conclusions.

