English (pdf)
 Article in xml format
 Article references
 Send this article by e-mail
 Cited by SciELO
  Cited by Google
  Similars in
SciELO
Similars in
SciELO  Similars in Google
 Permalink
1. Introduction
In less than a decade, Brazil has gone from being a zero-wind and solar power country to becoming the 10th largest producer in the world. Until 2006, generating electricity from the wind and sun was insignificant in Brazil. But in 2002, a federal government incentive program for renewable energy sources was launched, which gained strength from 2009 onwards (Oliveira Neto; Lima, 2016).
Brazil’s northeast is now the region with the largest installed capacity of renewable energy, predominantly wind and solar power. Incentive policies allowed the region to pioneer the installation of wind and solar plants (Oliveira Neto; Lima, 2016). There are 472 installed parks. According to the Global Wind Energy Council (GWEC), which measures global wind energy data, in 2017, Brazil surpassed Canada in the capacity ranking and now ranks 8th.3
With the growing use of renewable energy, especially wind energy, the northeast region has attracted large investments. These investments may bring benefits to society, both economically and socially.
However, some studies (Bell et al., 2005; Bell et al., 2013) on developed countries evinced that these power plants may lead to the opening of a “social gap,” defined as the difference between national public opinion favorable to wind and solar power plants and local opposition to these power plants, which has often resulted in canceled projects. The building and implementation of renewable power plants without compensation or mitigation —known as “imposition”— may cause conflicts between people and the donors of these plants. “Imposition” occurs when investors and planners concentrate on technical questions of efficiency and production quality above social factors, such as the human connection to a place, identity with the landscape, and disruption to resource-based livelihoods (Brannstrom et al. 2017).
Given the above, the purpose of this research is to reveal the relationship between the installation of renewable energy power plants (wind and solar) and the economic development in Brazil’s northeast region. The methodology used is the generalized spatial two-stage least-squares regression with the dependent and independent variable spatial lag.
This method accounts for spatial correlation (dependence) in the dependent variable. Such specifications are motivated by theoretical arguments that highlight the importance of neighborhood effects, or spatial externalities that cross the borders of the region/municipality and stand out in the dependent variable (Fischer, Wang, 2011).
Two lags are used to see which one best fits the analyzed situation and consequently identify which way the spillovers occur. In the first situation, the spatial lag of the dependent variable (GDP per capita or average salary) is verified; in the second, the spatial lag of the independent variable (presence of renewable energy plants) is tested. The methodology used in this study is similar to that used by Jeetoo (2022) and Chica-Olmo et al. (2020), which focused their research on the spatial relationship between economic growth and renewable energy consumption, respectively, in sub-Saharan Africa and 26 European countries.
The paper is divided into 6 sections, including this introduction. The second section presents a literature review on the social and economic effects of renewable power plants. The third section shed light on the situation of renewable energy in Brazil and the country’s northeast region. The fourth section presents the data and the methodology used in the paper. The fifth section shows the results of spatial autoregression, and finally, conclusions are presented in the last section.
2. Literature review
The use of wind and solar energy to generate electricity is an important vector of social development especially if it is used to serve isolated communities, as it allows universal access to energy at lower costs and it creates numerous jobs (Simas and Pacca, 2013). Such new economic opportunities could therefore reduce the rural exodus, which is one of the major causes of poverty.
However, decisions about the location of wind farms must be made taking into account other possibilities of land use in the region of interest. The location of wind farms in conservation areas and areas intended to serve indigenous communities is another concern (Fearnside, 2013).
According to Simas (2012), among the different impacts brought by the installation of wind and solar farms in a given region, the following stand out: technological and industrial development, which can promote innovation, participation in new markets, and entrepreneurship; and energy independence, which provides access to electricity, the use of local resources, as well as the allocation of public resources in other sectors. The impacts also include job creation, which in turn leads to increased incomes, job training, reduced immigration flows, and increased supply of goods and services, corroborating regional and local development. However, Simas (2012) also points out that the lack of qualified professionals, especially in positions that require a high level of training, can reduce the positive effects of power plant creation.
Brannstrom et al. (2017) compare renewable power plant creation in North America and Europe with Brazil: notably, the economic institutions in Brazil’s northeast region do not benefit the host communities. According to the same authors, land rent and royalties are reported positively in local media, but these benefits move to formal landowners, who may have unfairly acquired the land. Finally, Brannstrom et al. (2017) conclude that no institutions have been established to generate royalties or other economic benefits to host communities. In contrast, institutions in Brazil allow for capital accumulation by local political and economic elites.
Bell et al. (2005) evinced two types of gaps associated with wind power plants: social and the individual gaps. The social gap is given by society’s high degree of support for wind energy shown in opinion surveys and the low rate of achievement in developing new power plants. The individual gap is that which occurs when an individual has a positive approach to wind power in general but vigorously disagrees with a particular wind power development. These two gaps explain that renewable energies can be positive at a macro level but negative or not beneficial at a micro-local level. The projects may also create local benefits, but the social and environmental costs are more valued, and therefore a negative net benefit is obtained.
3. Renewable energy in Brazil and its northeast region.
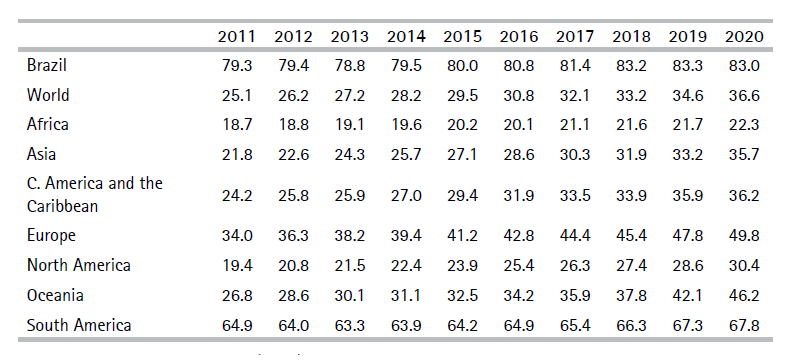
The use of renewable energy in Brazil places the country in a prominent position in the regional and international scenario. According to data from the International Renewable Energy Agency (IRENA), renewable sources contributed 83.0% in the electricity capacity (IRENA, 2021).
Table 1 compares the shares of renewable energy on total electricity capacity in Brazil with the same share in other areas in the world during the 2011- 2020 period. The table shows that Brazil has a larger share of renewable energy than the average of other regions in the world over the period considered. Even when considering the average share of South America, Brazilian leadership is confirmed.
Over ¾ of Brazil’s energy matrix derives from hydroelectricity, but the authorities are encouraging solar and wind energy as primary alternatives. The greatest potential for wind energy in Brazil is during the dry season, so this type of energy is excellent against low rainfall and the geographic distribution of water resources in the country.
Brazil held its first wind energy auction in 2009, in a move to diversify its energy matrix. At the beginning of this decade, a major drought in Brazil limited water to the country’s hydroelectric dams, causing a severe energy shortage. The crisis, which devastated the country’s economy and led to electricity rationing, underscored the country’s urgent need to diversify its energy sources. The bidding guaranteed an investment of R$ 9.4 billion in the construction of wind power generation plants, according to calculations by the Ministry of Mines and Energy (Gannoum, 2019).
In terms of solar power, MPX Tauá —the first photovoltaic solar plant to generate electricity on a commercial scale in Brazil— was inaugurated in August 2011, in the municipality of Tauá, in the state of Ceará. The solar power plant has an initial generation capacity of 1 megawatt (Solar Tauá, 2012).
Table 2 shows the total capacity of renewable energy and divides this capacity according to the type of energy: hydropower, wind energy, solar energy, and bioenergy. The first piece of evidence that the table illustrates is rapid growth of solar energy in the country, as the total capacity moved from 2 megawatts in 2011 to 7881 megawatts in 2020 with a growth rate of 393950% in a decade.
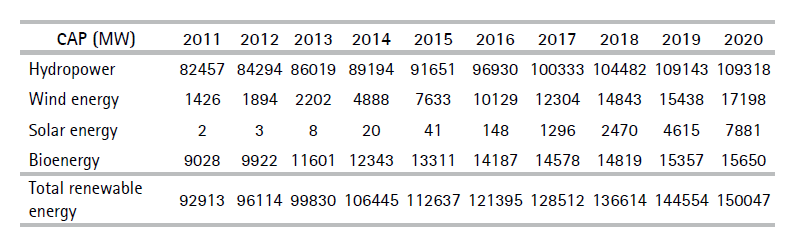
The second, is the equally rapid growth of wind energy: in this case, the growth rate was 1106% between 2011 and 2020. The third piece of evidence is that hydropower always represents the largest portion of renewable energies, even if we can perceive that its importance decreases during the decade: in 2011 this type of energy was 88.74% of total capacity in renewable power, while in 2020, this percentage decreased to 72.85%. These three pieces of evidence from Table 2 show that solar and wind power are becoming increasingly important as part of the production of renewable energy in Brazil, but also as part of the country’s total level of energy production.
One area of the country that has contributed significantly to obtaining these results is its northeast region. Figure 1 shows the Brazilian states that compose the country’s northeast region and the location of the region on the country map.
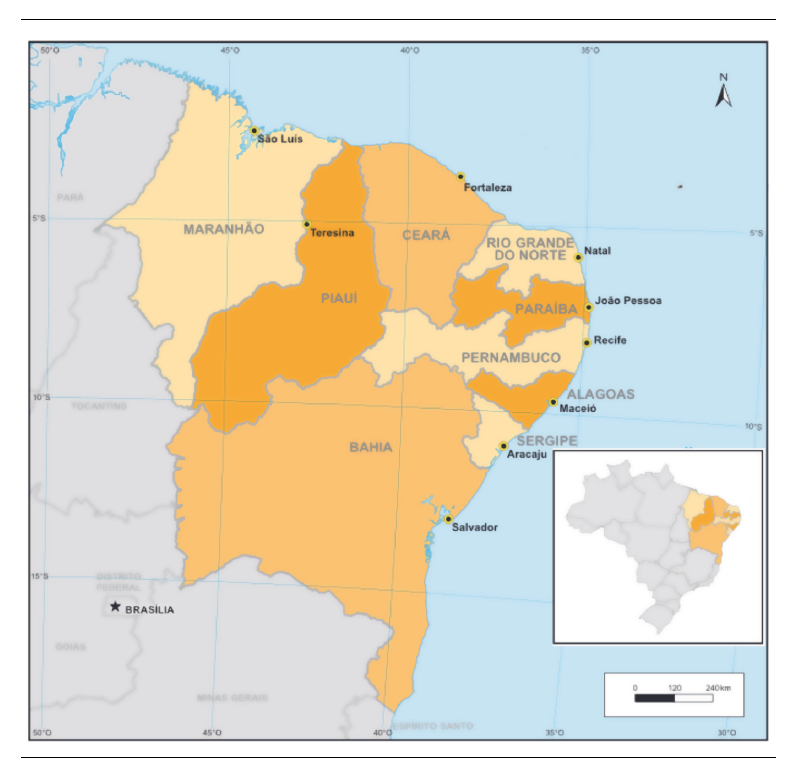
From an economic point of view, Brazil’s northeast region is the third-largest economy among Brazilian regions. Its share in the Brazilian Gross Domestic Product was 14.48% in 2017, after the South Region (17.04% share in GDP) and ahead of the Midwest Region (10.02% share in GDP) (Rodrigues Saraiva Leão, 2019).
However, it is also the region with the lowest GDP per capita. The average real monthly household income per capita obtained from all sources in the región (R$ 884, approximately US$175) did not reach the country’s minimum wage rate (R$ 10454, approximately US$207). Nationally, the average household income per capita from all sources was R$1,406 (approximately US$278) in 2019. Inequality presents a similar situation whereby the Gini Index of per capita household income is higher than in other regions and the situation has worsened in recent years. Indeed it rose from 0.545 to 0.559 between 2018 and 2019 (IBGE, 2020).
However, in the last few years, Brazil’s northeast region has shown positive numbers in the production of energy from renewable sources. In addition to holding 86% of the national wind farms, it also started the year 2021 with records in the generation of solar energy, consolidating itself as a reference in the use of alternative sources.
Characterized by strong winds, the region is the largest wind energy production hub in Brazil. Of the total of 769 existing parks in 2019, 670 are distributed among the states of Rio Grande do Norte, Bahia, Piauí, Ceará, Pernambuco, Maranhão, Paraíba and Sergipe, according to the Brazilian Wind Energy Association (ABEEólica, 2019).
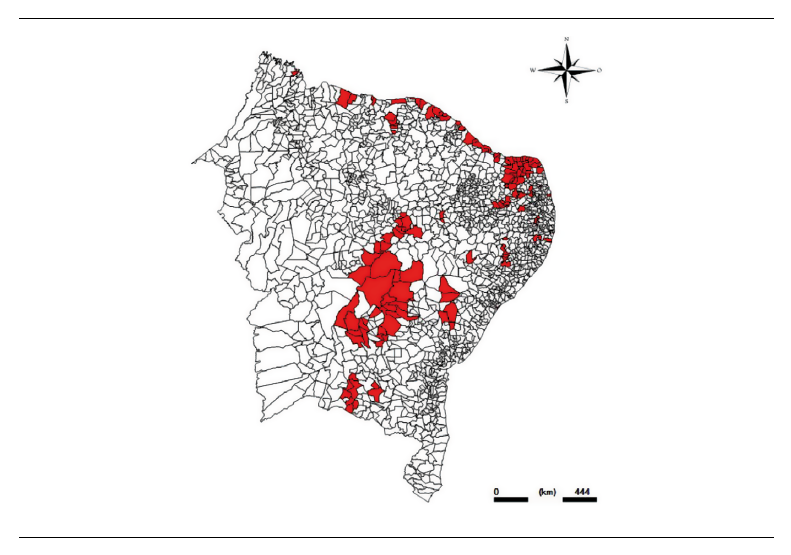
Figure 2 shows the localization of wind power plants on the map of Brazil’s northeast region. The municipalities highlighted in red have at least one wind power plant installed.
The high levels of solar radiation in Brazil’s northeast mean that the region has great potential in terms of generating solar photovoltaic energy. In March 2021, the region reached a record as, in only one day, it accumulated 544 average megawatts, according to information from the National Electric System Operator (ONS, 2021).
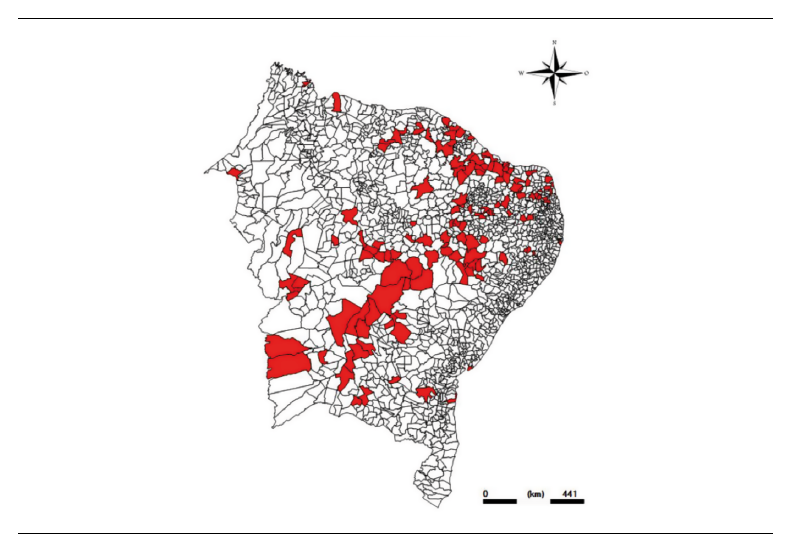
Figure 3 shows the localization of solar power plants on the map of Brazil’s northeast region. The municipalities highlighted in red have at least one solar power plant installed.
Source: Authors based on data from ANEEL (2020)
Figure 2. Municipalities with at least one wind power plant installed
Source: Authors based on data from ANEEL (2020)
Figure 3. Municipalities with at least one solar power plant installed
4. Methodology and data
The quantitative methodology used in this paper is spatial autoregression, which is a regression model that takes into account spatial spillover effects. In regional studies, spatial autoregression plays a crucial role. In comparison to standard econometric models, which limit spillovers to not exist, a significant aspect of spatial econometric models is that the magnitude and impact of spatial spillovers can be empirically evaluated. This is why, spatial econometric methods are widely used in regional economic research and are increasingly used in other social science areas (Elhorst, Vega, 2013).
Specifically, the type of spatial spillover chosen in this research is global spillover. Global spillover implies that one change in one place potentially affects outcomes everywhere. Practically, global spillover means that a change in municipality i will change the situation in municipality i, its local neighbor municipality, the neighbors of its neighbors, and so on. Spatial lags and spatially autoregressive errors are defined by the spatial weighting matrix W.
The model (1) is first fitted with a spatial lag of Y based on W:
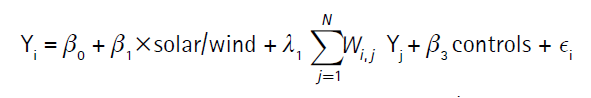 (1)
(1)
Secondly, model (2) is fitted with a spatial lag of solar/wind based on W:
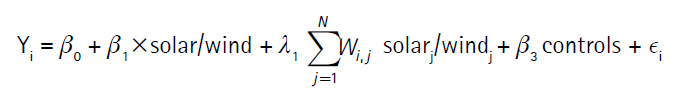 (2)
(2)
where
Y is the dependent variable, which will be the logarithm of the difference in GDP per capita and the logarithm of the difference in the average monthly salary in the municipality;
solar/wind is the variable that identifies the presence of at least one solar or wind power plant in the municipality;
W is the spatial weighting matrix. In this research, it is used an inversedistance matrix; that is, a spatial weighting matrix whose (i; j)th element is the inverse of the distance between units i and j;
controls are socio-economic variables relative to the municipalities.
The methodology of spatial autoregression has some limitations:
The fact that the dependent variable depends on its spatial lags may imply that this variable also depends on the spatial lags of the vector of covariates, incurring the problem of reflection.
These models assume linearity in the parameters. This assumption might not be true in practice.
There are strong criticisms of the overly simplistic representation of all spatial dependence in a single coefficient.
The contiguity matrix W implies a high degree of arbitrariness in its specification, mainly taking into account the irregularity of the maps of municipalities and census sectors (Carvalho Ywata; Albuquerque, 2011)
The estimator used in this analysis is the generalized method of moments (GMM). GMM can be fitted with multiple spatial lags of the dependent variable, multiple spatial autoregressive error terms, and multiple spatial lags of covariates. The GMM estimator assumes that the errors are independent and identically distributed (i.i.d.) but does not require normality.
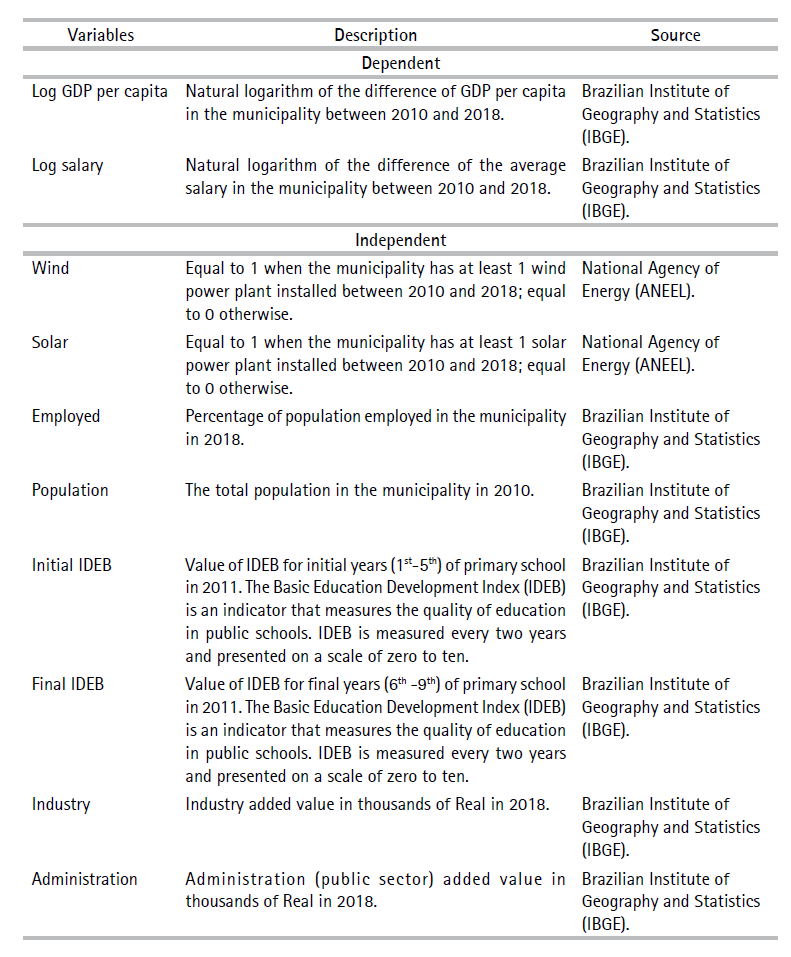
The data used in this paper are from the Brazilian Institute of Geography and Statistics (IBGE)5 and the National Agency of Energy (ANEEL)6 . Table A1, in the appendix, describes each variable used and its origin.
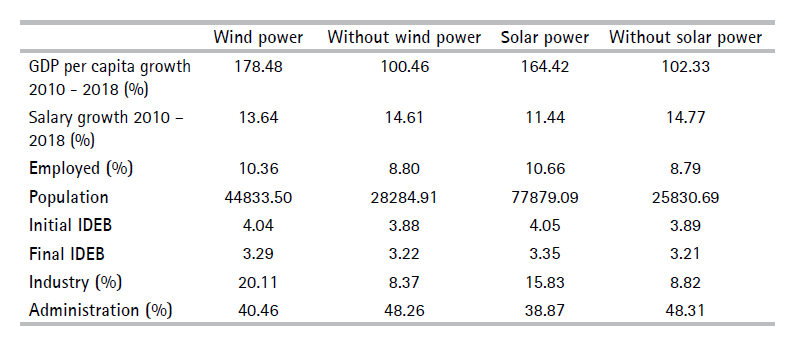
Table 3 below presents the average values of the variables used in this paper according to the presence of wind and solar power plants in the municipality. The first two variables are the dependent variables used in the spatial econometric analysis. In this case, it can be observed that municipalities that have a wind or solar power plant present a greater growth of GDP per capita than other municipalities in the 2010-2018 period. The same does not happen in the case of salary growth in the same period.
Table 3. Average values of variables according to the presence of renewable power plants
+In terms of quantity of minimum wage.
Source: Authors.
In the case of independent variables, municipalities with renewable power plants have, on average, a bigger share of the population employed, a larger population, a better indicator of initial IDEB, a larger share of added value from industry, and a smaller share of added value from public sector administration. Considering the final IDEB, the figures indicate that there is no relevant difference between municipalities with and without renewable power plants.
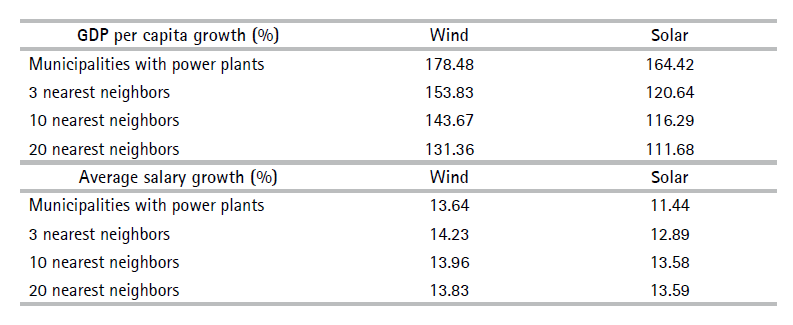
The following table (Table 4) presents the percentage of dependent variable growth (GDP per capita growth and average salary growth) in the municipalities where at least a renewable power plant is installed and in their three, ten, and twenty nearest neighbor municipalities.
Table 4. Percentage of the growth of dependent variables in municipalities with power plants and their neighbors in the 2010-2018 period
Source: Authors.
These percentages show that, in the case of GDP per capita growth, the presence of wind and solar power plants seems to have an effect on neighbors, which is larger for nearest neighbor municipalities and diminishes as more distant municipalities are considered. Moreover, comparing the percentages of neighbors in this table with the percentages of municipalities without renewable power plants (100.46% and 102.33%) in Table 3, the former appear to be larger than the latter; that is, municipalities without a power plant but localized near a municipality with power plant displayed a larger increase in GDP per capita than other municipalities without power plants. The same is not true in the case of average salary growth, whose percentage is almost constant in both wind and solar plants in the four situations considered (municipalities with power plants, three, ten, and twenty nearest neighbor municipalities).
5. Results
The results are divided into two subsections according to the dependent variable considered in the econometric analysis: in the first subsection, the dependent variable is GDP per capita growth; in the second, the dependent variable is the average salary growth.
5.1 Effects on GDP per capita
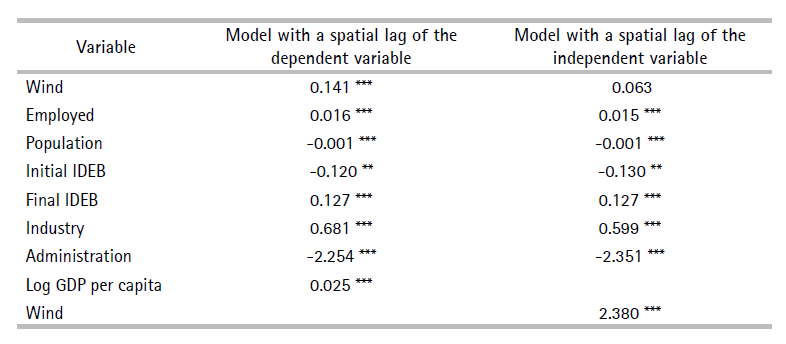
The first results come from an econometric analysis of the presence of wind power plants with a spatial lag of the dependent (Log GDP per capita) and independent variable (Wind). Table 5 presents the results of spatial autoregression.
Table 5. Wind power plant and GDP per capita: spatial lag of the dependent and independent variable
Note:significance levels: * 10%; ** 5%; *** 1%.
Source: Authors.
The first column illustrates the results for the model with a spatial lag of the dependent variable (Equation 1 in the previous section). In this case, it is assumed that spatial spillovers occur in the following way: the presence of wind power plants in municipality i changes GDP per capita in municipality i, which consequently affects its neighboring municipalities.
The second column illustrates the model with a spatial lag of the independent variable (Equation 2 in the previous section). In this case, it is assumed that spatial spillovers occur as follows: the presence of wind power plants in municipality i changes GDP per capita in municipality i and directly in the neighboring municipalities.
The results reveal that spillovers occur because wind power plants, as well as influencing their municipality, affect the neighboring municipalities. Namely, the second column shows a larger spillover effect than the first column. Moreover, in the second column, the direct effect of wind power plants on their municipalities is not statistically significant, demonstrating that these plants lead to a larger benefit for municipalities of the nearby region than for the municipalities where plants are installed.
Considering the independent variables in both models, we can see that, on one hand, Employed, Final IDEB, and Industry show a positive and significant coefficient, which expresses the usual correlation between GDP per capita and employment, human capital creation, and industry. On the other hand, the possible interpretation of the negative coefficient in the Population variable could be due to the fact that the population enters the formula of GDP per capita as a negative element. A limiting factor of the Initial IDEB coefficient could be due to the fact that the variable only has data from 2011. To obtain more conclusive results on this variable, it is necessary to observe a longer series of data. The negative coefficient of the Administration variable would show the Brazilian public sector’s inefficiency in producing economic growth. However, for a proper interpretation of the model, a calculation of direct and indirect effects after the regression is needed. Calculating direct and indirect effects after the regression is essential for the proper interpretation of the model. These effects can be read directly as the change in the metric of the dependent variable per incremental change of the covariate averaged across all the spatial units (observations).
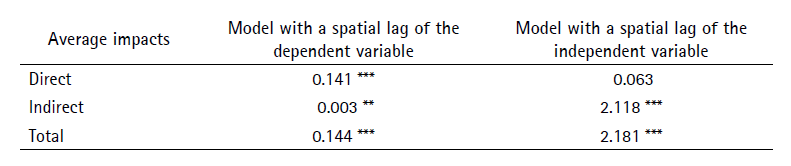
The direct effect is the effect of the change within the municipality, ignoring spillover effects. The indirect effect is the spillover effect (StataCorp, 2021). Table 6 presents the direct and indirect effects of the two models.
Table 6. Direct and indirect average impacts of wind power plants on GDP per capita
Note:significance levels: * 10%; ** 5%; *** 1%.
Source: Authors.
In the case of the spatial lag of the dependent variable, the own-municipality direct effect is the increase of the GDP per capita by 0.141 percentage points. The presence of wind power plants increases GDP per capita in the municipality, and that increases spillover to further increase GDP per capita in neighboring municipalities. The result is a 0.003 increase in GDP per capita (indirect effect). The total effect is the sum of the direct and indirect effects, which is 0.144.
In the case of the spatial lag of the independent variable, the direct effect is 0.063, but this is not statistically significant. The presence of wind power plants in the municipality spills over to increase GDP per capita in neighboring municipalities. The result is a 2.118 percentage points increase in GDP per capita (indirect effect). The total effect is 2.181.
Table 7 shows the results of spatial autoregression in the presence of solar power plants.
The results are similar to the previous analysis: the spatial lag of the dependent variable is smaller (0.025) than the spatial lag of the independent variable, which has a coefficient (3.357) that is even higher than the analysis of wind power plants.
The coefficients of the other variables have the same sign and explication as for the case of wind power.
Table 7. Solar power plant and GDP per capita: spatial lag of the dependent and independent variable
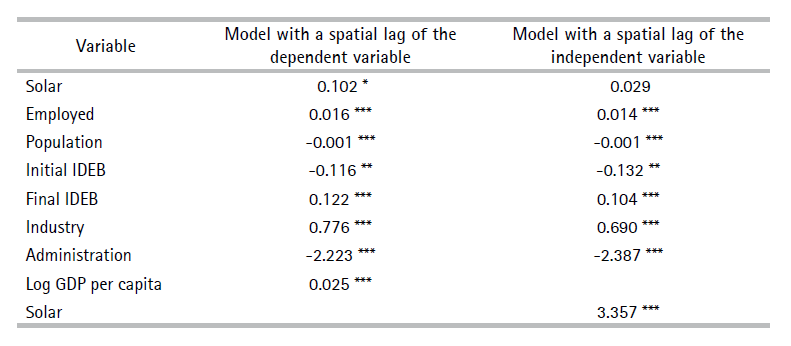
Note:significance levels: * 10%; ** 5%; *** 1%.
Table 8 presents the direct and indirect effects of the two models. The results in this table again highlight the fact that spillovers occur largely through the independent variable. In the second column, the direct effect is close to zero and is not statistically significant, while the indirect effect is 2.987, indicating that the presence of solar power plants in a municipality increased 2.987 percentage points GDP per capita in the neighboring municipalities.
Table 8. Direct and indirect average impacts of solar power plants on GDP per capita
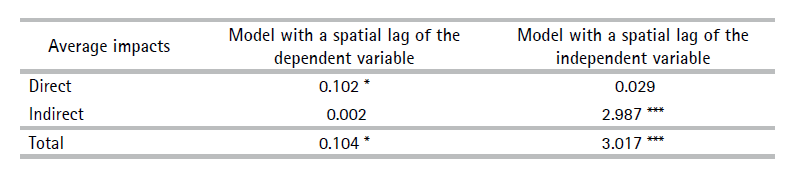
Note:significance levels: * 10%; ** 5%; *** 1%.
Source: Authors.
The positive results for the relationship between renewable energies and GDP per capita are supported by the literature. Apergis and Payne (2010) researched the causal relationship between renewable energy consumption and economic growth for twenty OECD countries in the 1985-2005 period. The results indicated that there would be a long-term equilibrium relationship between real GDP, renewable energy consumption, gross fixed capital formation, and workforce. The authors also concluded that there would be a bidirectional causality in both the short and long term between the consumption of renewable energy and economic growth. Apergis and Payne (2012) reached the same conclusion when analyzing 80 countries in the 1990s.
5.2 Effects on average salary
The first analysis is about the effects of wind power plants on average salary growth. Table 9 presents the results of spatial autoregression.
Table 9. Wind power plant and salary: spatial lag of the dependent and independent variable
Note:significance levels: * 10%; ** 5%; *** 1%.
Source: Authors.
The first aspect to be highlighted is the fact that, in this analysis, fewer variables are statistically significant than in the same analysis conducted for GDP per capita as the dependent variable (Table 5 in the previous subsection). The second aspect is that the presence of wind power plants in a municipality appears to be uncorrelated with average salary growth in the municipality: in both models, the Wind variable is statistically insignificant.
The third aspect is relative to spatial lags. In the model with a spatial lag of the dependent variable, the coefficient (0.422) of the variable that defines the spillover is smaller in absolute terms than the coefficient (-3.599) in the model with a spatial lag of the independent variable.
This second spillover appears to be predominant in describing the spillover in the case of wind power plants. This is confirmed in the following table (Table 10), which shows the direct and indirect average impacts.
Table 10. Direct and indirect average impacts of wind power plants on average salary
Note:significance levels: * 10%; ** 5%; *** 1%.
Source: Authors.
The only impacts that are statistically significant are the indirect and the total in the model with a spatial lag of the independent variable. These impacts are negative; that is, the presence of wind power plants in a municipality seems to reduce the average salaries of workers living in neighboring municipalities. This evidence is supported by the study by Araújo, and Freitas (2008), which explains that the operation and maintenance of wind power plants, in general, do not demand many well-paid jobs locally. It is possible to operate and control the power plants at a distance using computers.
Moreover, Araújo (2016) explained that renewable power plants normally create vacancies for outsourced civil construction employees. However, these jobs are temporary, lasting approximately six months and in the operation phase, the number of jobs decreases. For example, some parks only have 10 employees performing maintenance and surveillance activities.
Another issue that has worried the local populations is the constant process of migrating workers during the installation phase of the plants and the subsequent unemployment of these individuals once the plants start to be operative. This phenomenon appears to have occurred frequently in wind projects, and there are reports of it occurring in other energy projects.
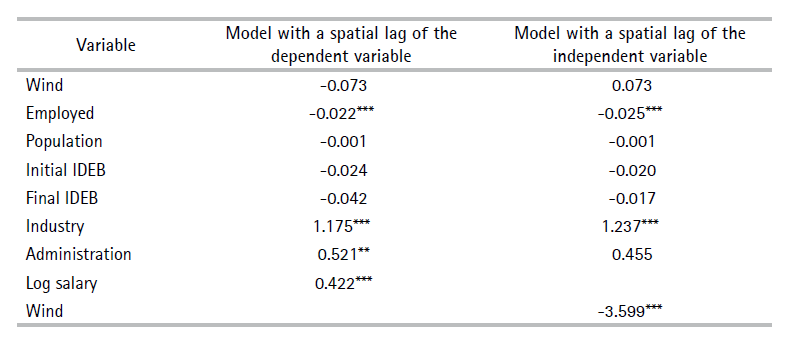
Moving on to solar power plants and their effect on average salary, Table 11 shows the results for the models with a spatial lag of the dependent variable and independent variable. The results are similar to the previous results relative to wind power plants (Table 9). In this case, the table shows that the coefficient that describes the spillover in the case of the independent variable is still negative and higher in absolute terms than the coefficient for wind power plants.
Table 11. Solar power plant and salary: spatial lag of the dependent and independent variable
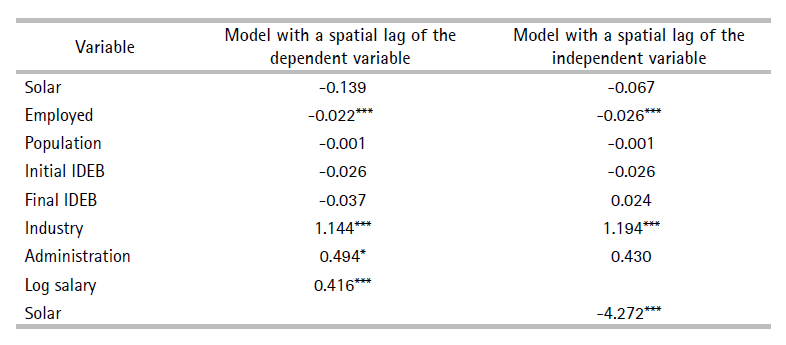
Note:significance levels: * 10%; ** 5%; *** 1%.
Source: Authors.
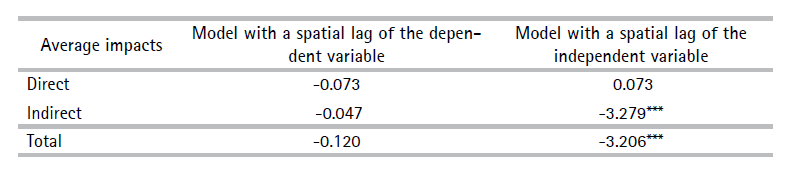
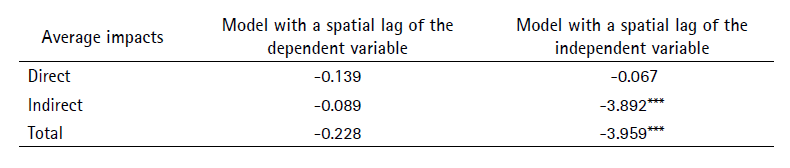
Table 12 continues the analysis by presenting the direct and indirect impacts of the solar power plant on the average salary. The results in terms of impacts are similar to the previous analysis: the only impacts that have statistical significance are the indirect and the total in the case of the model with a spatial lag of the independent variable. These impacts are negative; that is, the presence of solar power plants in a municipality seems to reduce the average salaries of workers living in neighboring municipalities.
6. Conclusions
According to the predominant point of view among agents of the State, the business sector, and part of civil society, the renewable power matrix is considered ‘clean’, as it does not accentuate climate change. The term ‘clean energy’, created in the context of climate negotiations, encompasses technical energy generation processes that, despite the non-emission of greenhouse gases into the atmosphere, have caused undesirable changes to ecosystems and social conflicts. The territorial implications caused by these so-called ‘clean’ energy sources are currently disregarded in most of the literature on the subject. Therefore, this article sought to analyze the socioeconomic implications of the implementation of wind farms in Brazil’s northeast region.
The results of the spatial econometric analysis indicate that the presence of renewable energy power plants is beneficial only in terms of GDP per capita growth and not in terms of salary growth. Moreover, according to the model with a spatial lag of the independent variable, the most benefited municipalities in terms of GDP per capita growth are not those where plants are installed, but rather, the neighborign municipalities; that is, the spillover effect is greater than the direct effect.
The wind and solar projects are usually installed in ‘empty territories’, with little or no social and cultural activity. These projects could provide people with an opportunity to overcome their conditions of underdevelopment, but in most cases, they do not. There is a lack of social policies in these locations, before and after the construction of power plants.
This is not new when we consider renewable power plants in developing countries. For example, in Mexico, local groups have been known to complain about how they are treated by the wind power producers. Producers promised progress, jobs, and millions in investment in clean energy, but the investments only benefited businessmen, all the technology was imported, and the power was not supplied at a reduced price for local inhabitants (Stevenson, 2009).
Some public policies may be suggested to help to overcome this situation. Renewable power should be adjusted to economic and social situations to avoid local tensions with traditional resource users and inhabitants.
A first policy should involve the strengthening of property rights which could increase the bargaining power of local populations allowing them to have larger benefits from renewable energy. This policy is following the guidelines of the U.N. Secretary-General, leading up to the 26th U.N. Climate Change Conference in November 2021, who affirmed that it is crucial for developing countries to address land rights to reduce future conflicts around renewable energy development.
A second policy should involve the creation of instruments financed by firms of power plants that could benefit local municipalities. These instruments could include, for example, funds for education and employment, special energy tariffs for the local population, and long-term infrastructure. This policy has a similar precedent in Brazil, which involves oil royalties. Oil royalties are a financial compensation due to the beneficiary municipalities by companies that produce oil and natural gas in Brazilian territory: a remuneration to society for the exploitation of these natural resources.