English (pdf)
 Article in xml format
 Article references
 Send this article by e-mail
 Cited by SciELO
  Cited by Google
  Similars in
SciELO
Similars in
SciELO  Similars in Google
 Permalink
Introduction
Technological change is one of the main engines of economic growth and social progress. However, technical advances typically alter the production process and hence modify the productivity and ultimately the demand for different factors. Substantial technological changes are profoundly disruptive, at least in the short run. Over the last decades, a new concern has emerged: recent advances in digital technology and robotics are replacing routine labor tasks that that can be easily automated based on rule-based algorithms. This concern has been examined by the task-based approach of Autor et al. (2003) and Acemoglu and Autor (2011) who argue that the complementarity or substitutability between technology and labor does not occur at worker level but rather that it depends on how susceptible different tasks are to automation. Most papers for developed countries have found evidence in favor of the hypothesis of job polarization: labor routine tasks are heavily concentrated in the middle of the skills distribution, and hence employment has been increasingly concentrated on high-wage occupations and low-wage occupations, at the expense of traditionally middle-skill jobs. Evidence for developing countries, and for Latin America in particular, is still scarce and so far, inconsistent with the polarization hypothesis.
In this paper, we explore these issues by documenting the patterns of changes in employment by occupations characterized by different degrees of exposure to routinization in the six largest Latin American economies (Argentina, Brazil, Chile, Colombia, Mexico, and Peru, that represent 79% of total population and 86% of total GDP) over the last two decades. We combine (i) our own indicators of the degree of routinization based on information on task content by occupation from the Programme for the International Assessment of Adult Competencies survey (PIAAC) with (ii) labor market microdata from harmonized national household surveys. In sum, we exploit a novel and rich dataset to construct measures of routine task content of the actual jobs held by workers in Latin America and combine them with microdata from about 5 million workers in the region’s six largest economies over two decades. This effort aims to identify a set of stylized facts regarding employment and routinization in Latin America. The data unveils several interesting results.
Exposure to routinization is heterogeneous across demographic and socioeconomic groups and across countries. The most salient asymmetry is among skill groups, with a higher degree of routinization observed in occupations characterized by low skill levels and low wages. On average for the six largest Latin American economies, our index of routine task content (RTC) is 0.603 for the unskilled, somewhat smaller for the semi-skilled (0.527), and much lower for skilled workers (0.341).
Employment growth was decreasing in the degree of routine task content of the occupations. Although there is considerable heterogeneity across countries, the general result holds: across all six countries employment growth was lower, or even negative, in occupations with a high degree of routine task content. These asymmetric shifts in employment have led to a modest decrease in the overall level of routinization within Latin American economies over the past two decades.
The intensity of these patterns has varied over the business cycle. The correlation between employment fluctuations and routinization was more pronounced during the booming 2000s than in the more sluggish 2010s.
A within-between decomposition analysis reveals that the decline in the proportion of high RTC occupations within total employment has been linked to both shifts in the structure of the economy towards sectors more intensive in low RTC occupations, and changes in the intensity of use of different occupations within sectors.
Our results are consistent with the existing literature that shows that workers that perform routine tasks are more likely to have been affected by automation. However, in contrast to most findings for developed economies, our results are in line with much of the previous literature in LDCs, as we find no evidence for labor market polarization. Instead, employment was increasing in the initial wage.
In this paper, we contribute to the literature that characterizes patterns in the employment structure associated with technological changes. We are aware that our results are merely descriptive and cannot be taken as causal evidence of the effects of technology on the labor market. Yet, we believe the evidence we show in this paper is useful, as it contributes to a better characterization of the dynamics of the labor markets in Latin America against the backdrop of technological changes that replace labor routine tasks. This initial, mostly descriptive, step is crucial in the complex process of understanding the mechanisms by which technology affects employment and other labor outcomes.
The rest of this paper is organized as follows. In Section I we review the literature on employment and routinization. In Section II we provide details on the methodology applied and the data used. The main results are presented in Section III. In Section IV we include some robustness checks. Section V bring the paper to a close with a discussion of the main results.
I. Literature review
The early literature on skill-biased technological change dates back to the works of Katz and Murphy (1992), Bound and Johnson (1992), and Card and Lemieux (2001). Following Tinbergen’s idea of the race between technology and education this literature assumes that technology is complementary to skilled labor, therefore positively affecting the relative demand and wage of skilled workers. Technological change is thus associated with an unambiguous unequalizing effect on income distribution.3
More recently, with the proliferation of automation processes in the form of digital technology and robotics, the literature on technology and labor markets has shifted to the task-based approach of Autor et al. (2003), and Acemoglu and Autor (2011). The task approach argues that the complementarity or substitutability between technology and labor does not occur at worker level but rather depends on how susceptible different tasks are to automation.4 In particular, routine tasks that follow well-defined rules can be more easily automated based on rule-based algorithms, using increasingly powerful computers. A growing body of literature focused on developed countries documents that recent technological advancements are displacing labor-intensive routine tasks that are predominantly concentrated within the middle segment of the skills distribution. This hypothesis is known as job polarization (Autor et al., 2006, 2008; Autor and Dorn, 2013; Goos and Manning, 2007; Goos et al., 2014; Michaels et al., 2014) and refers to the change in the structure of work in industrialized countries, with employment increasingly concentrated in high-education high-wage occupations, and low-education low-wage occupations, at the expense of traditionally middle-skill jobs.5
Within the task-based approach, Acemoglu and Restrepo (2018) propose a framework with two possible equilibria. In a static model with fixed capital and exogenous technology, automation reduces employment and the labor share, and may even reduce wages. Conversely, the creation of new tasks increases wages, employment, and the labor share. Furthermore, in a dynamic economy that endogenizes capital accumulation and the direction of research towards both automation and the creation of new tasks, they find two possible results. In the long-run, if capital is relatively inexpensive compared to labor, there is a tendency to automate all tasks. However, in other scenarios, both types of innovations can coexist. Automation can lower labor-related production costs, thereby diminishing the motivation for further automation. Simultaneously, this can stimulate the emergence of new more complex tasks where labor has a comparative advantage. Some equilibria of the models reflect one of the greatest fears regarding the adoption of new technologies: the potential displacement of workers and destruction of jobs (Zuleta, 2008; Peretto and Seater, 2013; Boldrin and Levine, 2002). The question is empirically tackled, among others, by Autor and Salomons (2018) with a cross-country panel of industry-level data. As a direct effect, automation leads to job displacement and decreases the proportion of value added generated by labor in the industries where it is implemented. Concerning employment, positive effects in related customer industries and triggered increases in aggregate demand outweigh losses in these industries. However, the reduction in the labor share within the industry where automation is applied is not compensated for in other sectors.
The literature on employment and automation in the developing world is still incipient but growing.6Das and Hilgenstock (2018) propose a metric for assessing the risk of labor displacement caused by information technology based on Autor and Dorn (2013), and implement it for 85 countries. They find little evidence of polarization in developing countries. In part, this result is driven by the fact that developing economies are significantly less exposed to routinization than their developed counterparts. Maloney and Molina (2016) apply the Autor and Dorn (2013) approach to census data in 21 developing countries in Africa, Latin America, and Asia, finding no strong evidence for polarization in these LDCs. Changes in the occupational structure appear to be more in line with traditional skill-biased technological change mechanism. Messina et al. (2016) and Messina and Silva (2017) exploit the Skills Toward Employment and Productivity (STEP) Surveys conducted in Bolivia, Colombia, and El Salvador as a proxy for the routine/abstract/manual content of jobs in Latin America. They also find few signs of job polarization.
We contribute to this literature with a study that combines a rich dataset (PIAAC) that allows us to construct novel measures of routine task content of the actual jobs held by workers in Latin America, and a large, harmonized dataset of labor market variables from workers in the region’s six largest economies over two decades. This combination allows us to more precisely identify some stylized facts regarding the connection between employment growth and routinization in Latin America.
II. Data and methodology
To explore the correlations between employment changes and routinization, we use data from two primary sources: the PIAAC survey to construct routinization measures and a set of national household surveys to study labor market changes.
A. Routinization measures
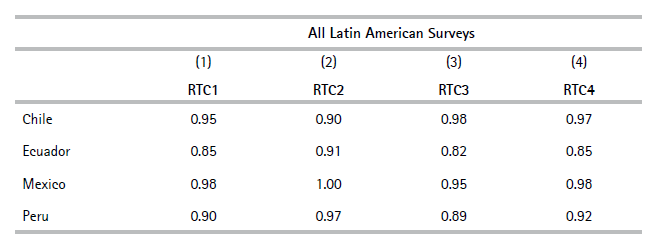
In this paper, we use our own routine task content (RTC) indexes constructed using microdata from the Programme for the International Assessment of Adult Competencies (PIAAC) surveys conducted by the OECD. In particular, we take the mean results for the Latin American countries covered in the study: Chile, Ecuador, Mexico, and Peru.7 Each Latin American PIAAC survey has between 2,000 and 4,000 observations on employed individuals. Our empirical analysis involves workers in Argentina, Brazil, Chile, Colombia, Mexico, and Peru. Three out of these six countries have their own PIAAC survey, which we could in principle use separately. However, individuals are unevenly distributed across occupations, which results in some occupation-level RTC indexes being constructed with too few observations. To deal with this issue, we pool together the four Latin American PIAAC surveys and construct the RTC indexes based on the pooled surveys from all countries.8
We focus on four specific job-related questions: Do you manage or supervise other people? Do you plan activities of other workers? Are you confronted with problems? Do you write articles or reports? The four questions reflect tasks that require creative thinking, flexibility, and problem-solving abilities that cannot be easily codified and replaced by technology. These tasks can be performed both in manual and cognitive occupations. Importantly, they have high variability in responses across individuals.
For each individual in the PIAAC survey we also know their occupation according to the ISCO 08 classification. We then use this information to define a routinization task content index RTC1 at the occupational level as the percentage of workers in the occupation who report not performing any of the four activities above often. The index captures the percentage of individuals within an occupation that mostly perform routine tasks. The higher the RTC of an occupation, the greater the potential for automation.
For robustness, we define three additional measures of RTC at the occupational level. RTC2 expands upon RTC1 by incorporating two additional questions: Do you calculate budgets or costs? and Do you give presentations? RTC2 is then the percentage of workers in the occupation who report not performing any of the six activities often. For RTC3 (RTC4), we first compute, for each worker, the percentage of the four (six) flexible tasks that s(he) does not perform often, and then take the mean of these values within each occupation.
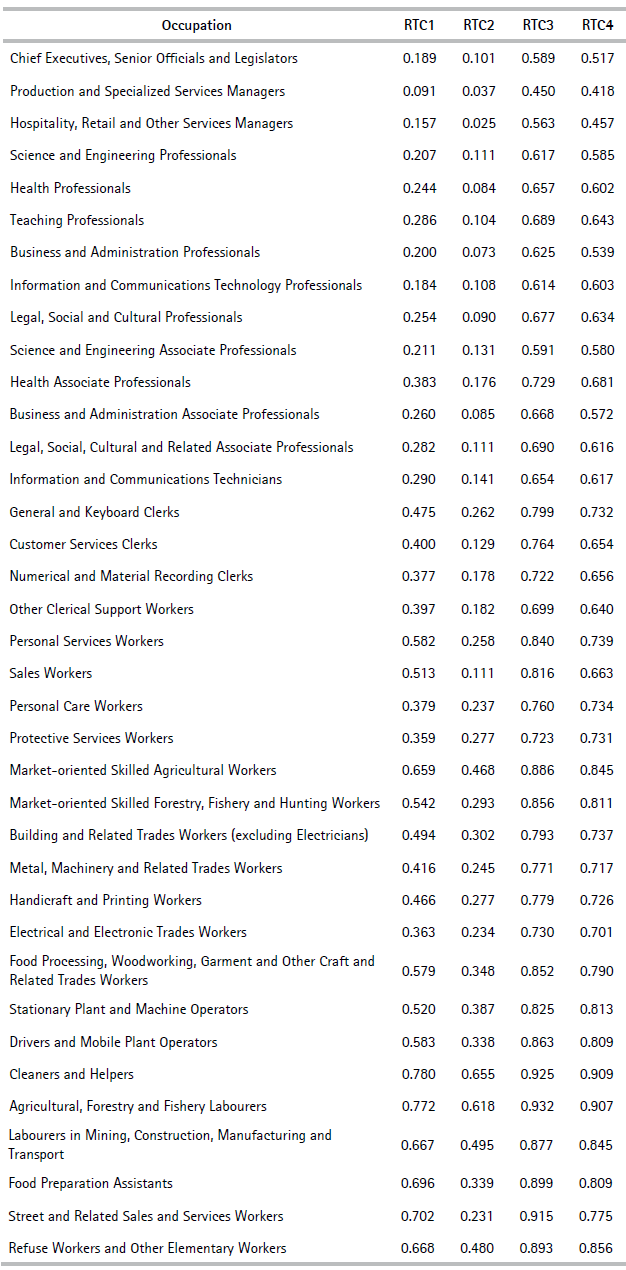
Table 1 shows the values of the different RTC indexes for the occupations at the ISCO 08 2-digit level. The correlations across indexes are high: all above 0.89. In what follows, we focus on the RTC1 measure, but the main results are robust to the use of alternative indexes (see Section IV). There are large heterogeneities in the routine task content across occupations. The index is lowest for managers and professionals and highest for some unskilled occupations, such as cleaners, agricultural laborers, and refuse workers. The range of variation is large. From 0.091 for production and specialized services managers to 0.780 for cleaners and helpers. The average is 0.422 and the median 0.397.
A similar approach to the one described above is implemented in Autor et al. (2003) and Autor et al. (2006, 2008). For our specific objectives, our measure possesses a notable advantage: it is constructed using information on actual tasks performed by Latin American workers. In the robustness section, we compare our indicators with other measures that are based on information from the US and other developed countries. Some of these measures (e.g., Arntz et al., 2016; Frey and Osborne, 2017) primarily assess the potential for future automation rather than the present level of routinization, which is more aligned with our research goals. In any case, it is important to highlight that there is a substantial correlation between these measures of current routinization and the potential for future automatability (see Section IV).
B. Labor market variables
In order to explore the labor market implications of automation, we rely on microdata from the official national household surveys of the six Latin American countries included in the study: Encuesta Permanente de Hogares (EPH) in Argentina, Pesquisa Nacional por Amostra de Domicílios (PNAD) in Brazil, Encuesta de Caracterización Socioeconómica Nacional (CASEN) in Chile, Gran Encuesta Integrada de Hogares (GEIH) in Colombia, Encuesta Nacional de Ingresos y Gastos de los Hogares (ENIGH) in Mexico, and Encuesta Nacional de Hogares (ENAHO) in Peru. Surveys were processed following the protocol of the Socioeconomic Database for Latin America and the Caribbean (SEDLAC), a joint project between CEDLAS at Universidad Nacional de La Plata and the World Bank. Household surveys are not uniform across Latin American countries and, in most cases, not even within a country over time. The issue of comparability is of utmost importance. Given this concern, we make all possible efforts to make statistics comparable across countries and over time by using similar definitions of variables for each country/year, and by applying consistent methods of processing the data (SEDLAC, 2020).
We focus on the 2004-2019 period and consider three time windows: the mid2000s, the early 2010s, and the late 2010s. To enhance statistical power, we combine data for different years in each window. The first window encompasses data from around 2005, the second from around 2011, and the third from around 2017. To simplify, we often refer to these windows as simply 2005, 2011 and 2017. For example, in Argentina, the mid-2000s window includes surveys for 2004, 2005 and 2006; the early 2010s window comprises data from 2010, 2011, and 2012; and the late 2010s window encompasses information from 2016, 2017 and 2018. Table 2 provides details on the information used in each country. Nominal variables (hourly wages and monthly labor incomes) are deflated by the national Consumer Price Index (CPI) of each country and expressed in 2011 PPP values in order to make them comparable over time.9 Unfortunately, Latin American countries do not use a common system of occupation codes. Countries use different versions of the ISCO classification or even their own codes. To ensure a consistent and unified classification, we standardized the occupation codes for each country by mapping them to the two-digit ISCO 08 classification using official crosswalks.10
Table 2. Information from national household surveys
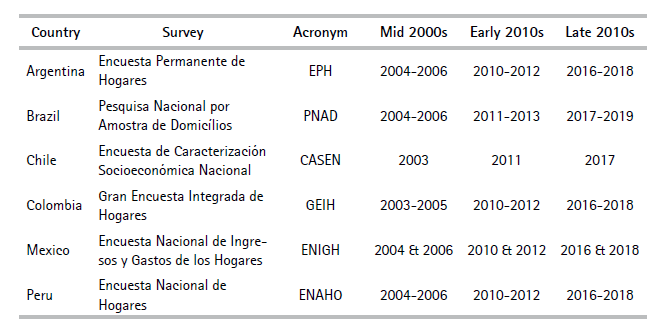
Source: Authors based on national household surveys.
In sum, our dataset has information on the RTC index for each occupation, and data on labor market variables at the country-period-occupation level, drawn from harmonized national household surveys.11 These variables include employment, full-time workers employment, hours worked, hourly wage, socio-demographic variables (such as average age, average number of skilled workers12, average number of males, share of informal workers, etc.) and the distance of average earnings to the minimum wage.
C. Linking employment and routinization
The methodology we follow in the paper is straightforward. We look at medium-run changes in employment by occupations characterized by different degree of routinization. Specifically, we regress non-parametrically (lowess regressions13) and parametrically (OLS and FE) the change in employment on (i) the routinization index of the occupation and (ii) the initial average wage of the occupation. The objective of the first set of regressions (the ones that use the routinization index) is to assess the hypothesis that routine tasks have been more affected in terms of employment. The objective of the second set of regressions (the ones that use the initial average wage) is to explore the job polarization hypothesis.
For our OLS-FE regressions, we use the following equation:
 (1)
(1)
where yict is the number of jobs (in logs) or the number of (log) hours worked in occupation i and country c during period t. When analyzing changes in employment and routinization, our measure of routine task content of occupation i, RTCi, is our main variable of interest. Instead, when assessing the polarization hypothesis, our main variables of interest are the initial wage wic t = 0 and its square (they replace RTCi in equation (1)). Øt=0×  controls for time-varying characteristics specific to each occupation to partial out correlations that may arise from factors unrelated to routinization. Specifically, we include as controls baseline values interacted with time dummies of the following occupational-level sociodemografic and labor market characteristics: mean age, share of male workers, share of skilled workers, share of informal workers, share of self-employed workers, and the proximity of average earnings to the minimum wage. λt controls for time-specific factors that might affect employment or hours worked growth during the period under study and are constant across occupations and countries. wc are country fixed effects that control for differential trends that may affect each country distinctly. Finally, Ɛict is the error term. We cluster the standard errors at the country level to account for any potential correlation of the outcome variables for occupations of the same country over time. It is worth noting that given that the LHS variable in equation (1) is the first difference of the log of the outcome variable, we eliminate any fixed characteristic at the occupation level that might be correlated with our outcome variable.
III. Results
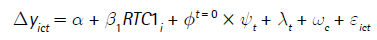
We start with a simple characterization of the working population in Latin America, focusing on the extent of routinization within their respective occupations. The mean value for the RTC1 index constructed from PIAAC in the six largest Latin American economies for the late 2010s was 0.505. There is a great deal of heterogeneity in the degree of routinization across countries: from 0.471 in Argentina to 0.554 in Peru (See Table 3). It is important to emphasize that since RTC at the task level is fixed (due to data limitations), differences in the RTC levels across countries capture different national occupational structures. In that sense, Argentina, Chile, and Brazil have occupational structures that imply RTC values below the regional mean, whereas Colombia, Mexico and Peru have employment structures more biased towards occupations with higher routinization. The results are robust to the use of alternative RTC indexes.
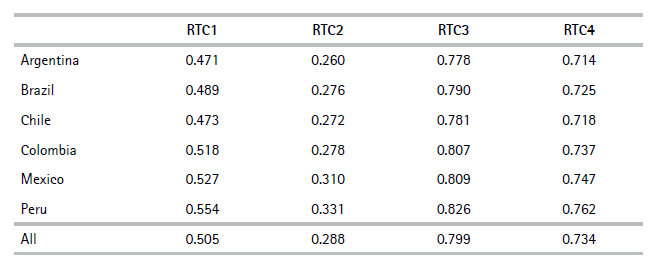
The heterogeneity in the degree of routinization across occupations translates into significant differences in RTC across economic sectors, given that industries differ in their occupational structures. Table 4 shows the mean values (across the six Latin American economies) of the four routine-task content indexes defined based on PIAAC for the 17 sectors at the 1-digit ISIC. Construction, Transportation, Restaurants & Hotels, Domestic Services and Agriculture are the sectors with the highest degrees of routinization. In the other extreme, Finance, Teaching and Health & Social Services are sectors where automation is less feasible. The range of variation in RTC across sectors is very large (from 0.315 to 0.683 when using RTC1), which suggests that the sectoral structure of the economy is a key factor to understanding the degree of routinization in a country and its changes over time.
Table 4. Routinization indices by industry–Latin America
Note.Mean value across Argentina, Brazil, Chile, Colombia, Mexico, and Peru.
Source: Authors based on national household surveys and PIAAC.
The degree of routinization also differs by the workers’ socioeconomic and demographic characteristics (Table 5). The RTC indexes are substantially lower among skilled workers. For instance, on average for the six economies the RTC1 is 0.603 for the unskilled, somewhat smaller for the semi-skilled (0.527), and much lower for the skilled workers (0.341).14Figure 1 shows the pattern for the complete range of years of education. The index of routine task content decreases very slowly up to around 10 years of education (corresponding to the completion of the first level of secondary school). Beyond this point, the decline becomes more pronounced.
Table 5. Routinization indices by skill, gender and age–Latin America
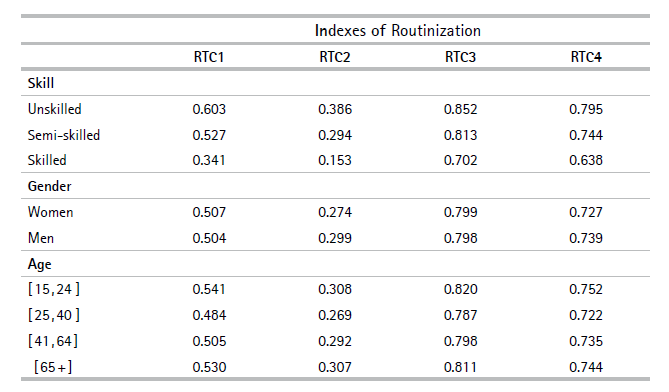
Note.Mean value across Argentina, Brazil, Chile, Colombia, Mexico, and Peru. Semi-skilled are those with 9 to 13 years of education. The other two groups are defined accordingly.
Source: Authors based on national household surveys and PIAAC.
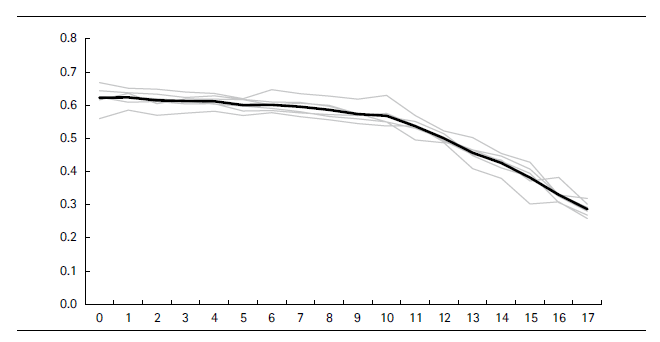
Source: Authors based on PIAAC and national household surveys of late 2010s.
Figure 1. Routinization indices by years of education–Latin AmericaNote. Each gray line shows a different country.
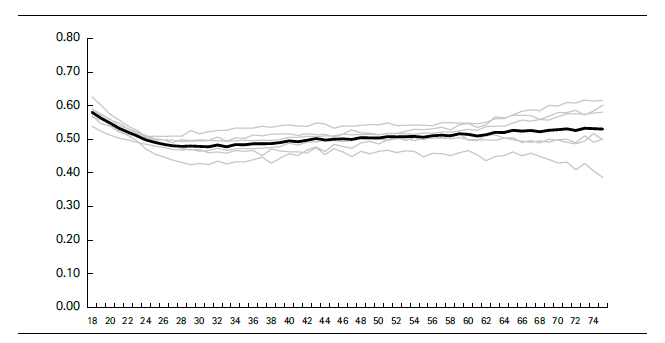
There are no significant gender gaps in the values of RTC; the differences are very minor and not statistically significant.15 Differences in the degree of routinization by age are not as pronounced as those observed based on skill (Figure 2). In any case, routinization seems to be high among very young workers. The RTC index decreases with age up to around age 28 and then slowly increases. Mean RTC goes from 0.580 for workers aged 18 to 0.479 for those aged 28, and then rises to 0.533 for workers in their mid-70s. There is however some heterogeneity in this pattern: RTC is actually mostly decreasing in age in Argentina.
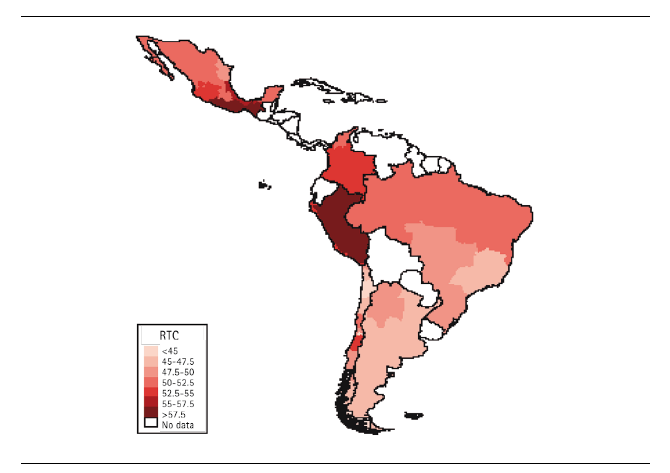
Finally, there are some significant differences across the regions in which the territories of Latin American countries are usually divided (Figure 3). In all countries the degree of routinization is somewhat higher in the poorest regions: NOA and NEA in Argentina; Norte and Nordeste in Brazil; Maule, Araucanía and Coquimbo in Chile; Pacífica and Atlántica in Colombia; Sur in Mexico and the rural areas and Selva in Peru.
Source: Authors based on PIAAC and national household surveys of late 2010s
Figure 2. Routinization indices by age–Latin AmericaNote. Each gray line shows a different country.
Source: Authors based on PIAAC and national household surveys of late 2010s.
Figure 3. Routinization indices by region–Latin America
A. Changes in employment
The Latin American economies experienced significant changes over the two decades under analysis. In particular, in South America economic growth was robust in the 2000s and weaker or inexistent in the 2010s. In Colombia, per capita GDP grew at an annual rate of 3.6% during the second half of the 2000s but decelerated to 2.1% in the 2010s. Similarly, in Chile GDP per capita decelerated from 3.6% to 1.6% , while in Peru, it slowed down from 5.6% to 2.9%. The contrast was starker for Argentina and Brazil, which both suffered recessions in the 2010s (the growth rates in both decades were 3.9% and -0.7% in Argentina, and 3% and -1% in Brazil). Mexico is the only country in our sample with a different pattern. The country’s per capita GDP grew at a rate of 0.4% in the mid-2000s and subsequently experienced a slight acceleration to 1.4% in the 2010s.
Changes in employment are partly linked to GDP trends but they also have their own determinants and dynamics. In most countries, the contrast between the two decades is noticeable in the employment rate (Table 6). In Argentina and Peru, the employment rate increased in the first period (2005-2011) and fell thereafter (2011-2017), while Colombia experienced a deceleration, and Brazil a more intense fall in employment in the 2010s. Chile and Mexico stand out as the two countries with better employment performance in the 2010s. Against this backdrop, in what follows, we analyze changes in the employment structure with a focus on the degree of routinization.
B. Changes in employment and routinization
In this section, we explore whether changes in employment in Latin America have been related to the degree of routinization of the different occupations. We start by exploring this relationship by means of simple non-parametric estimations (lowess regressions) at the occupation level. We consider three measures of employment: number of workers, number of full-time workers, and total hours of work. In all cases, we assign workers to their main jobs, in case they have more than one.
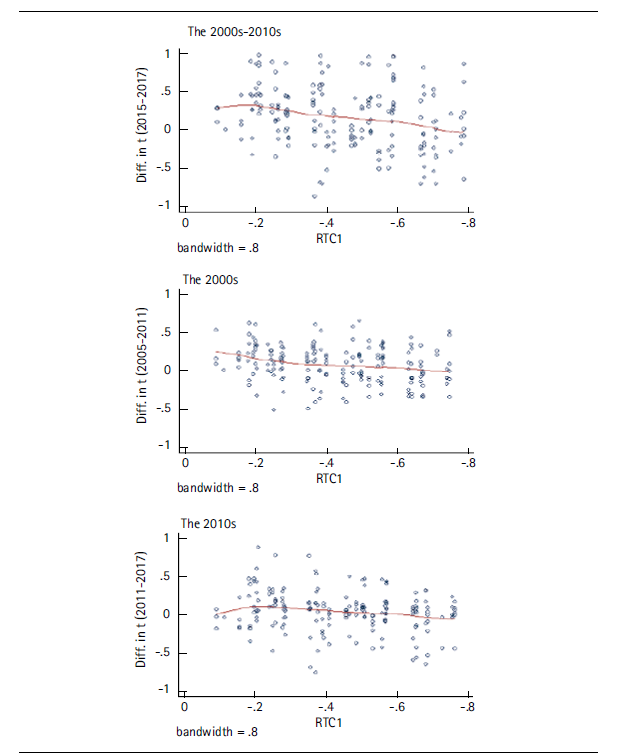
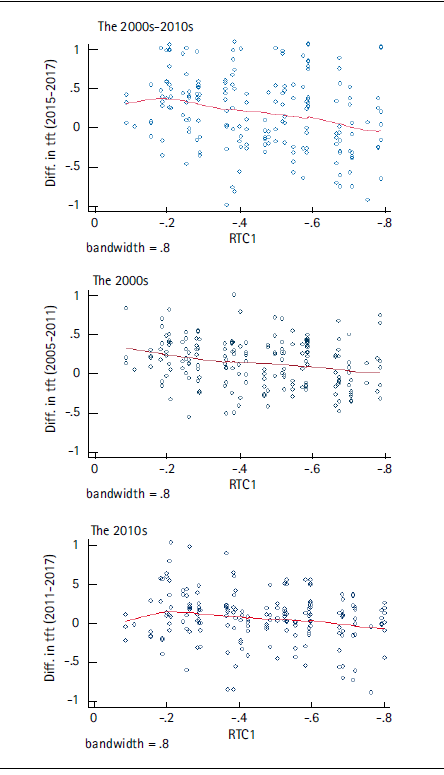
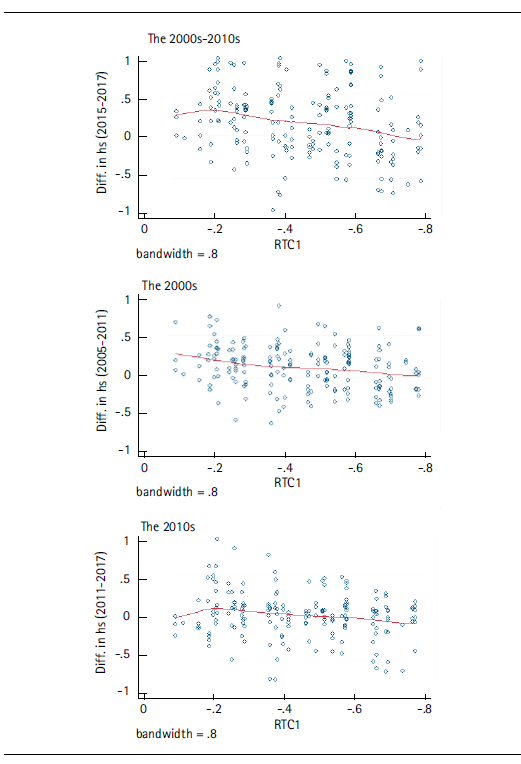
Figure 4 illustrates the relationship between the annual rate of change in the total number of workers and the degree of routinization by occupation. The figure includes observations from all six countries in our sample for the whole period, and then divided by decade. Changes in employment have been decreasing in the degree of routine task content of the occupations. In the 2000s, employment increased in most occupations, especially those with a lower degree of routinization. In fact, on average, the increase in jobs was negligible for occupations with high RTC. The pattern was similar although somewhat less marked during the more sluggish 2010s.16Although there is considerable heterogeneity across countries, the general result holds: in all six countries employment has increased less, or even decreased, in occupations with high routine task content.17 The results are similar when considering full-time workers (Figure 5) and total hours of work (Figure 6).
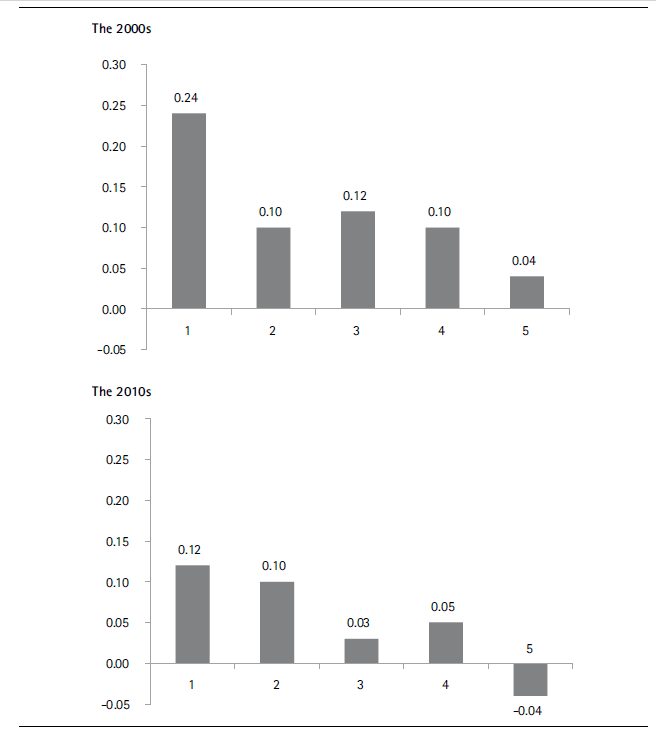
In Figure 7 occupations are sorted in the horizontal axis by quintiles of the degree of routinization estimated by RTC1. In both periods, the change in employment decreased in the RTC quintiles. In the 2000s, a growth of jobs was generalized but less significant among those occupations with high RTC. Whereas the number of workers in occupations with the lowest risk of automation (bottom quintile of RTC) grew 24% in the 2000s, the increase was much more modest (4%) in high routine task occupations. In the 2010s, this asymmetric pattern was similar, albeit with smaller changes in employment. In fact, the number of workers in occupations in the top RTC quintile went down by -4%.
Source: Authors based on PIAAC and national household surveys.
Figure 4. Lowess regression of growth rate in number of workers and routinization by occupationNotes. Each graph is a Locally Weighted Scatterplot Smoothing of the changes in employment over our routine index. The titles above each graph indicate the period used to build the outcome variable. In the 2000s, we use the growth rate in employment between around 2005 and around 2011. In the 2010s we compute it between around 2011 and around 2017. Finally, in the 2000s-2010s we consider the extreme periods of our sample (i.e., the outcome variable is the change in employment from around 2005 to around 2017). The bandwidth we used is 0.8
Source: Authors based on PIAAC and national household surveys.
Figure 5. Lowess regression of growth rate in full-time workers and routinization by occupationNotes. Same details as in note of Figure 4 apply
Source: Authors based on PIAAC and national household surveys.
Figure 6. Lowess regression of growth rate in hours of work and routinization by occupationNotes. Same details as in note of Figure 4 apply.
Source: Authors based on PIAAC and national household surveys.
Figure 7. Growth rate in number of workers by quintiles of RTCNote. Occupations sorted by quintiles of RTC1 in the horizontal axis.
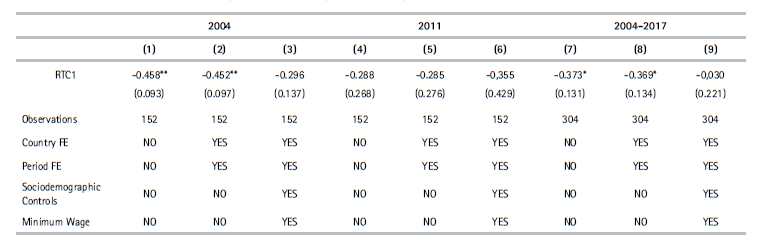
Next, we study the correlations between our routine index and changes in employment by running regressions as in equation (1). The results in Table 7 reveal that in the 2000s, a 1 p.p. increase in the RTC index is correlated with a reduction of 26.2% of the employment growth rate (Column (3), our preferred specification described by equation (1)). We also find negative correlations in the 2010s, but the effects are weaker and noisier.
Table 7. Regressions of employment growth on RTC
NotesThe dependent variable is the first difference in the log of average employment by occupation. To compute the results in the first three columns we restricted the sample to the first two periods. Analogously, the columns (4)-(6) were built restricting the sample to the last two periods. Finally, the last three columns use the full sample with all the periods. Robust standard errors clustered at the country level in parentheses.
***p < 0.01
**p < 0.05
*p < 0.1
Source: Authors based on national household surveys and PIAAC.
We have documented a negative correlation between changes in employment in occupations and the level of routinization. This correlation remains significant even after accounting for various variables and fixed effects. Strictly speaking, our results are just a characterization of the patterns of employment changes in Latin America: occupations with higher automation potential experienced lower employment growth. We can speculate further on the mechanisms driving these results. In particular, we argue that our results are consistent with a plausible narrative driven by the interplay of two factors: the increasing process of automation and the business cycle. For reasons probably related to improved external conditions, the 2000s were an exceptional decade of economic expansion in Latin America. A dramatic increase in demand coupled with technological changes favoring automation led to a widespread increase in employment, that was less intense in those occupations more susceptible to automation. Despite heightened competition of new machines, employment in high RTC occupations in general did not fall, favored by the economic expansion. The incorporation of automation technologies displacing workers from routine tasks is easier for firms during periods of economic upturn, when displaced workers can often find alternative jobs within the same firm, or in other companies or sectors. This situation changed notably in the 2010s, a decade characterized by less favorable external conditions resulting in economic deceleration or stagnation across Latin America. In such a scenario, incorporating new technologies that displace workers is more problematic, and hence difficult to implement. During that decade, we still observe that employment growth is decreasing in the automatability of the jobs, but the relationship appears to be somewhat weaker, probably due to increased costs associated with workforce layoffs during economic downturns. While our proposed mechanism appears plausible, it is important to emphasize that our findings align with this narrative but do not definitively prove it. Further extensive research is needed to shed additional light on this topic.
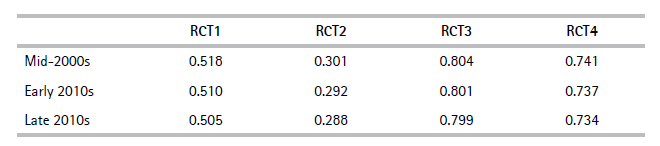
As a result of the asymmetric changes in employment, the overall degree of routinization has decreased in the Latin American economies over the last two decades (Table 8). This decline was more pronounced in the 2000s compared to the 2010s. Specifically, RTC1 fell from 0.518 in 2005 to 0.510 in 2011, and then to 0.505 in 2017. The other RTC indexes reveal a similar pattern of gradual reduction in the degree of routinization over the last two decades. It is important to note that since we have only one observation of RTC in the period, the decline in the overall national RTC index is primarily driven by shifts in the employment structure toward occupations characterized by a lower degree of routinization. Mexico is the only country that displayed a different pattern, with an increase in routinization, only noticeable in the 2000s. This increase could have been mainly the consequence of outsourcing by US firms of more routine tasks.
C. Changes within and between sectors
We have documented stronger employment growth in low RTC occupations, implying an increase in the share of those occupations in total employment. Was that increase mainly associated with changes in the structure of the economy towards sectors more intensive in the use of low RTC occupations, or rather associated with changes in the intensity of use of different occupations within sectors? In order to explore this issue, we follow Goos et al. (2014) and implement a between-within sector decomposition of the changes in employment shares by types of occupations in terms of the degree of routinization. To do so, we first divide occupations in terciles according to the value of RTC: low, mid and high RTC1. At any point in time workers are characterized by the RTC group and by the sector or industry (1-digit ISIC) of their main jobs. We decompose the overall change in employment shares for each RTC group into a within-industry and between-industry component. Formally,
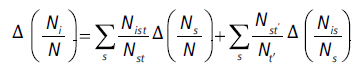 (2)
(2)
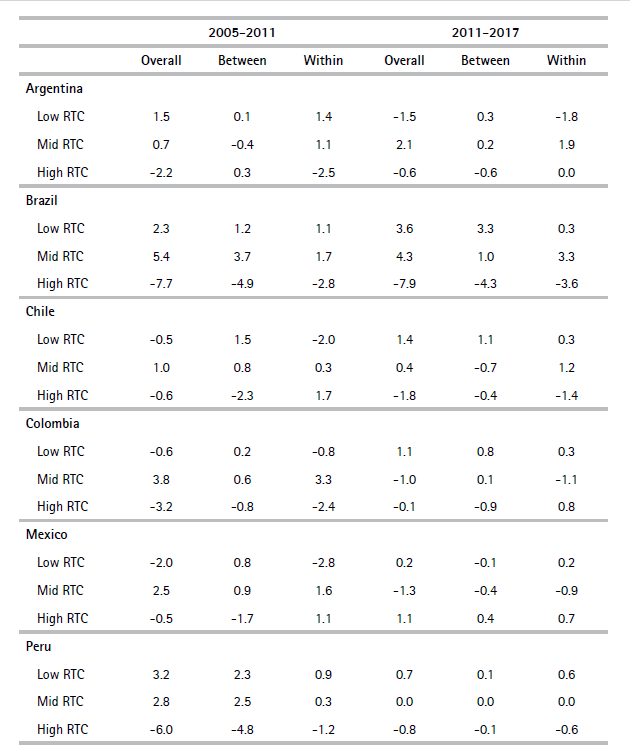
where Nist labels employment in group of RTC i, sector or industry s, and time period t. The change in the share of group i in total employment can be written as the sum of two terms: the between-sector component and the within-sector component. The first records the change in i’s employment share associated with changes in the sectoral structure of the economy while the second records the direct impact of changes in the intensity of use of different occupations within sectors. Table 9 shows the results for each country of the decompositions measuring employment with the number of workers. The results are similar when considering hours of work.
Table 9. Between and within decomposition of changes in employment shares. Number of workers
Source: Authors based on national household surveys and PIAAC.
Results are substantially heterogeneous across countries and over time. However, there are some common patterns, in particular a generalized fall in the participation of the high RTC group in all countries and periods (except for Mexico). Consistent with the results in Goos et al. (2014), we find that within-industry and between-industry components are both quantitatively too large to be ignored in the analysis. The results of the decompositions suggest that both changes in the sectoral structure of the economy and changes in production within sectors are highly relevant in understanding the pattern against employment in high routine occupations in Latin America.
D. Routinization and initial wages
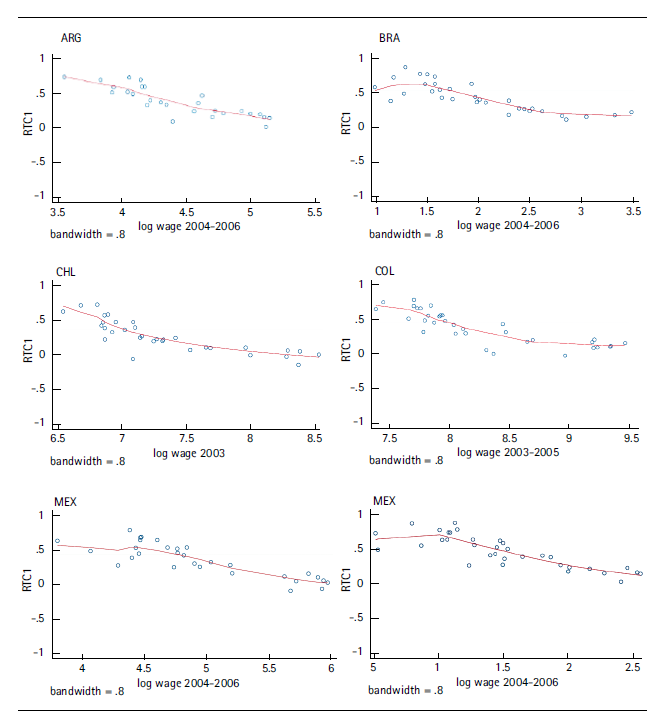
In the past decades, there has been a very active line of research that explores changes in the structure of jobs by skills. The typical analysis involves the assessment of changes in employment by occupations classified by initial wages, as rough measures of skills. In this section, we explore that relationship with our data for Latin America. In Figure 8, we plot our preferred RTC measure of routinization by occupation on the mean log hourly wage in the initial period (around 2005). The relationship is clearly decreasing in all countries: high-wage jobs are those with lower routine task content. The mean correlation coefficient for our sample of six countries is -0.831. The correlation coefficients are also very high when computed with the median instead of the mean, and restricting the sample to full-time workers (Table 10).
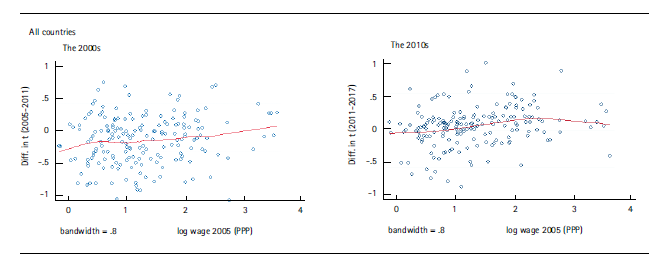
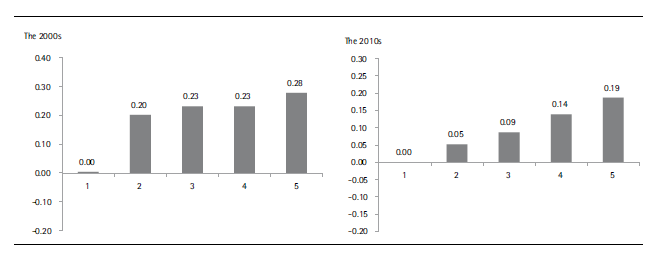
Considering the strong inverse correlation between routinization and initial wage, the results in Figure 9 are not surprising. Growth in employment in Latin America was increasing in the initial wage during the last two decades, on average and in all countries. In Figure 10 occupations are sorted by quintiles of the initial wage. In both periods employment growth increases in the initial wage. Whereas the number of workers in occupations with high wages (top quintile) grew 28% in the 2000s, employment was virtually constant in low wage occupations. In the 2010s, this asymmetric pattern was similar, albeit less marked.
Source: Authors based on national household surveys and PIAAC.
Figure 8. Lowess regression between RTC and initial wages by occupationNotes. Each graph is a Locally Weighted Scatterplot Smoothing of the changes in employment over the mean log hourly wage in the initial period (around 2005). The titles above each graph indicate the country in which we run the regression. Wages are at constant 2011 PPP prices.The bandwidth we used is 0.8
Table 10. Linear correlation between RTC and initial wage
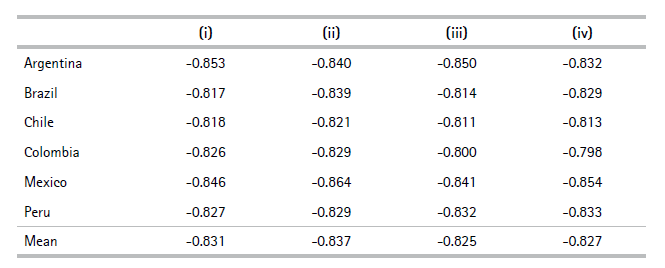
NoteCorrelations of RTC1 with (i) mean log wage, (ii) mean log wage full-time workers, (iii) median log wage, (iv) median log wage full-time workers.
Source: Authors based on national household surveys and PIAAC.
Source: Authors based on national household surveys and PIAAC.
Figure 9. Lowess regression between growth rate in number of workers and initial wage by occupationNotes. Each graph is a Locally Weighted Scatterplot Smoothing of the changes in employment over the mean log hourly wage in the initial period (around 2005). The titles above each graph indicate the period in which we built the growth rate of employment to run the regressions: the 2000s comprise our first two periods (around 2005 and around 2011) and the 2010s are our last two periods (around 2011 and around 2017). Wages are at constant 2011 PPP prices. The bandwidth we used is 0.8
Source: Authors based on national household surveys and PIAAC.
Figure 10. Growth rate in number of workers by quintile of initial wageNote. Occupations sorted by quintiles of initial wage in the horizontal axis.
To shed further light on this relationship, we run a regression as in (1) but including the initial wage and its square as variables of interest. Table 11 presents the results of the association between employment growth and initial wages both at the extensive margin (Panel A) and the intensive margin (Panel B). An increase of 10 log points in the initial wage was correlated with an increase of 3.9 log points in the rate of change of employment considering all the periods of our sample (the marginal effect of Panel A in the third column of the table). The results in Table 11 suggest that the relationship between employment growth and initial wage is concave. More importantly, it is always increasing for the range of initial wages observed in our Latin American sample.
Table 11. Regressions of employment growth on initial wage
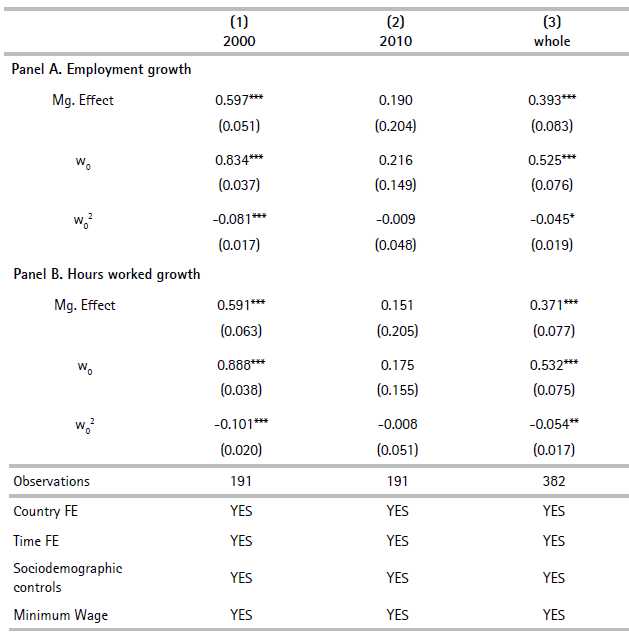
NotesPanel A dependent variable: first log difference of occupational employment. Dependent variable of Panel B: first difference of the log of hours worked by occupation. The marginal effect was calculated taking the average of the initial wage. To compute the results in the first column we restricted the sample to the first two periods. For column (2) we restricted the sample to the last two periods. Finally, in the last column we use the full sample with all the periods. Initial wage at constant PPP-2011 prices. Robust standard errors clustered at the country level in parentheses.
∗∗∗p < 0.01
∗∗p < 0.05
∗p < 0.1
Source: Authors based on national household surveys and PIAAC.
These patterns provide no support for the polarization hypothesis that has been discussed for industrialized countries, according to which employment is increasingly concentrated in high-wage occupations and low-wage occupations, at the expense of traditionally middle-wage jobs. The evidence aligns with other studies that find little evidence of polarization in developing countries (Das and Hilgenstock, 2018; Maloney and Molina, 2016; Messina and Silva, 2017). The causes of this contrast remain relatively unexplored. Possible factors include differences in the skill composition of similar occupations between industrialized and developing economies, the impact of off-shore employment, the role of new technologies in fostering sectors in developing countries that employ medium-skill jobs, and differences in the intensity of the automation process. More research is needed to understand these factors.
IV. Robustness
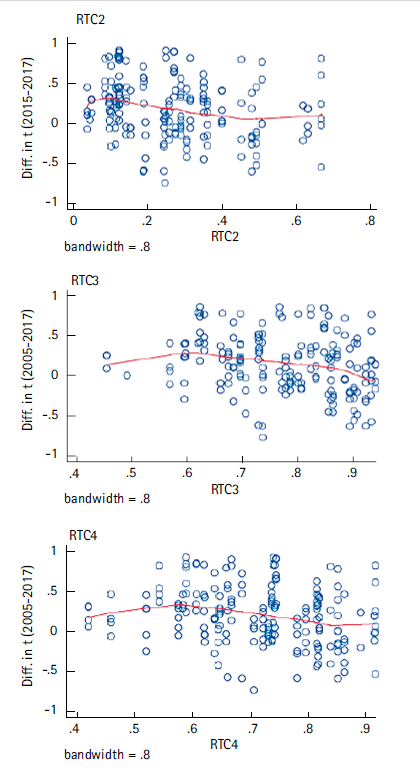
Our results are robust to the use of alternative RTC indexes constructed based on PIAAC. Figure 11 shows the relationship between employment changes (for the whole period; from around 2005 to around 2017) and routinization for indexes RTC2, RTC3 and RTC4. In all cases, the main results hold: employment changes were decreasing in the routine task content over the period under analysis.18
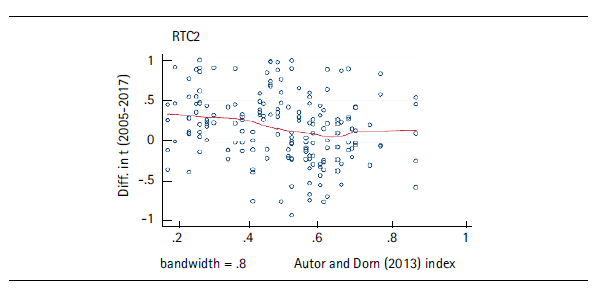
One of the most widely recognized measures of occupation routinization is the Routine Task Intensity (RTI) index used by Autor and Dorn (2013) and Autor et al. (2013), based on the US Dictionary of Occupational Titles. The RTI index is calculated by taking the difference between the log of Routine tasks and the sum of the log of Abstract tasks and the log of Manual tasks. The correlations between the measure used by Autor and Dorn and our RTC indexes based on PIAAC data are highly significant, with a linear correlation coefficient of 0.84. As a result, our findings remain largely consistent when using the Autor and Dorn measure of RTI (Figure 12).19
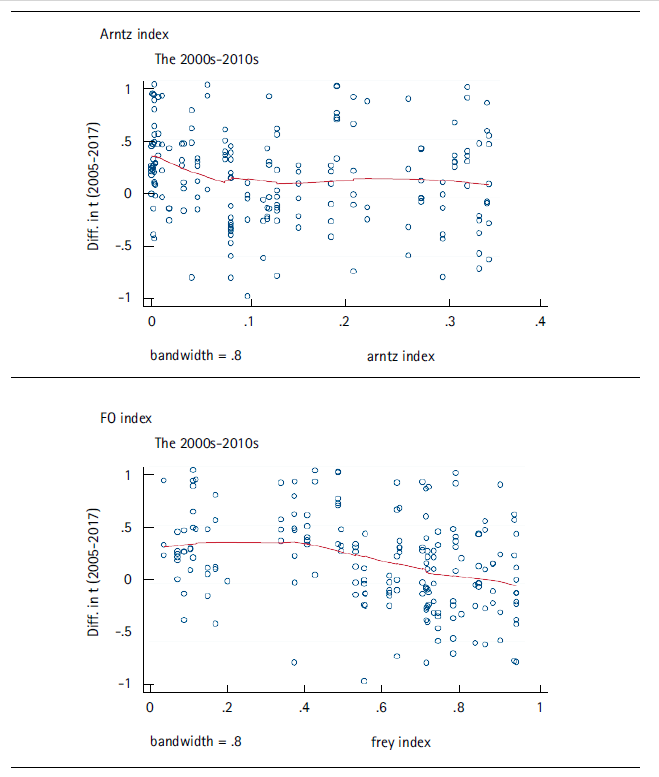
Our indexes, derived from PIAAC data use information of the actual tasks currently performed by Latin American workers. A recent strand takes a more prospective view, motivated by the acceleration in the implementation of new technologies. How many tasks or occupations might be automatable in the near future? There have been a number of initiatives aimed at assessing the potential for automating or substituting occupations with machines in the near future. So far, the most popular approach follows the study of Frey and Osborne (2017) (FO). The FO approach assumes that occupations are homogeneous in terms of tasks. However, this is a strong assumption, as workers in the same occupation usually conduct different tasks, resulting in varying degrees of exposure to automation depending on their specific job responsibilities (Autor and Handel, 2013). To address this concern, Arntz et al. (2016, 2017) adopt a task-based approach rather than an occupation-based one, by focusing on what people actually do in their jobs rather than relying on occupational descriptions of jobs. Based on US observations in the PIAAC, Arntz et al. (2017) estimate a model of the automatability indicator of FO on workers’ actual tasks, and use the predictions of this model as an indicator of true automatability.
Source: Authors based on data from PIAAC and national household surveys.
Figure 11. Lowess regression between growth rate in number of workers and routinization. Alternative RTC indexes from PIAACNotes. Each graph is a Locally Weighted Scatterplot Smoothing of the changes in employment over our routine index. The titles above each graph indicate which alternative routine index we use. All regressions were performed considering the extreme periods of our sample (i.e., the outcome variable is the change in employment from around 2005 to around 2017). The bandwidth we used is 0.8.
Source: Authors based on national household surveys and PIAAC.
Figure 12. Lowess regression between growth rate in number of workers and routine task intensity index of Autor and Dorn (2013)Notes. The graph is a Locally Weighted Scatterplot Smoothing of the changes in employment over Autor and Dorn (2013) routine index. The regressions was performed considering the extreme periods of our sample (i.e., the outcome variable is the change in employment from around 2005 to around 2017). The bandwidth we used is 0.8.
The FO index and the variation proposed by Arntz et al. (2017) are conceptually different from our indexes for routine task content. Those are indexes of future automatability that measure the risk for routinization in some developed economies in the near future, while ours are indexes of the current degree of routinization faced by Latin American workers. However, the correlations among all these measures are high. For instance, the linear correlation coefficient between our RTC1 and the FO (Arntz) index is 0.78 (0.72). Predictably, the main results of our paper do not substantially change if we consider these two indexes of risk of automation (Figure 13).20 As expected, this relationship is somewhat looser than when considering the degree of current routinization among Latin American workers (our RTC).
Source: Authors based on data from PIAAC and national household surveys.
Figure 13. Lowess regression between growth rate in number of workers and automatability by occupation. Alternative indexesNotes. Each graph is a Locally Weighted Scatterplot Smoothing of the changes in employment over two prospective automatability indexes. The titles above each graph indicate the index used to perform the regressions. All regressions were performed considering the extreme periods of our sample (i.e., the outcome variable is the change in employment from around 2005 to around 2017). The bandwidth we used is .8.
Finally, as detailed in Tables A2 and A3 of Appendix A, we run our regressions with a sample consisting of only one year per period for each Latin American country. This approach enhances the comparability of the results across countries but comes at the expense of reduced statistical power. Specifically, we used years 2004, 2011 and 2017 for Argentina, Brazil, Colombia, and Peru. For the initial period in Chile, we used data from 2003, and for the subsequent periods, we use 2011 and 2017, aligning with the approach employed in other countries. Finally, for Mexico, we used data from 2004, 2010, and 2018 that are within ±1 years from the other countries. The results for the effect on the change in the average number of workers are analogous, with the same sign (negative) and stronger for the 2000s. However, with fewer observations, the results are noisier (the same applies to the relationship between RTC and initial wages).
V. Concluding remarks
In this paper, we study changes in employment by occupations characterized by different degrees of exposure to routinization in the six largest Latin American economies over the last two decades. To do so, we use our own measures of the degree of routinization by occupation constructed from the responses of Latin American workers to the Programme for the International Assessment of Adult Competencies survey. In this concluding section, we stress five points.
Exposure to routinization is heterogeneous across demographic and socioeconomic groups and across countries. The most salient asymmetry is among skill groups: our index of routine task content decreases very slowly up to around 10 years of education and falls abruptly thereafter. This pattern is key to understanding some of our findings.
Our results are consistent with the existing literature, which suggests that workers engaged in routine tasks are more susceptible to the impact of automation. Over the period under study, the increase in jobs was significantly decreasing in the degree of routinization. At least since the mid-2000s the labor structure in Latin America has gradually shifted toward occupations with a lower degree of exposure to routinization.
The magnitudes of these changes have not been uniform over time. During the booming 2000s employment increased for most groups, especially in those occupations less affected by the ongoing process of increasing automation. The pattern was similar, although less marked, during the more sluggish 2010s.
Our research reveals that the decline in the proportion of high RTC occupations within the overall employment has been influenced by two primary factors: shifts in the economic structure towards sectors more intensive in low RTC occupations, and changes in the intensity of use of different occupations within sectors.
Given the decreasing pattern of RTC in education, and in line with most prior literature on LDCs, our analysis does not reveal evidence of labor market polarization. Maloney and Molina (2016) suggest several potential explanations for the absence of polarization in developing countries’ data, which contrasts with observations in advanced economies. Different initial occupational distributions, the influence of the offshoring of jobs, or the effect of new technologies in fostering sectors that employ middle-skill jobs could offer plausible explanations for this divergence. More research is needed to understand these factors.