English (pdf)
 Article in xml format
 Article references
 Send this article by e-mail
 Cited by SciELO
  Cited by Google
  Similars in
SciELO
Similars in
SciELO  Similars in Google
 Permalink
Introduction
Quality education is one of the main drivers of economic mobility. The gaps among different population groups in terms of access to quality education usually lead to future income and opportunity gaps (Yang and Qiu, 2016; Abdullah et al., 2015). Thus, identifying student performance gaps is crucial for the design of public policies aimed at reducing income and wealth inequality. This is especially relevant for highly unequal countries like Colombia.
The Program for International Student Assessment (PISA) tests has become an important frame of reference for evaluating the academic level of students in a country and is very useful in identifying the aspects of educational policy that should be reconsidered, reinforced, or implemented for achieving better educational outcomes. In fact, in the past two decades, large-scale international assessments have been on the rise, with PISA being viewed by many as holding strategic significance in global education policy debates (Pons, 2017). These tests, administered by the OECD, measure students’ level of preparedness for adult life. By analyzing these results, stakeholders can compare the most relevant factors explaining gaps in students’ educational performance in each country.
Unlike previous large-scale curriculum based tests, PISA tests are literacy-based, making students’ test results more suitable for comparing student performance across countries and over time within a single country. They measure students’ knowledge and skills in three main domains, namely reading, scientific, and mathematical literacy. Evidence suggests that high-income countries have responded to PISA results by endeavoring to draw lessons from the best practices of other nations (Dixon et al., 2013; Heyneman and Lee, 2014; Niemann et al., 2017; Rowley et al., 2019; Parcerisa et al., 2020, Gomendio, 2023). Less evidence is available for low- and middle-income countries that participate in PISA and more research is needed to conclude whether results have offered insights for education policy and practice in these countries, and whether such insights have affected education policy (Rivas, 2015; Delprato and Antequera, 2021; Li, 2021). In fact, while there are more than 114 published articles evaluating the PISA results for the United States (and at least 72 for Australia, 69 for Germany, 52 for the United Kingdom, and 31 for Ireland), studies involving less developed economies are relatively scarce (Hopfenbeck et al., 2018).
Furthermore, it is essential to recognize the diverse array of research initiatives worldwide that interact with the PISA. Various types of studies have explored the applications and implications of PISA data. Internationally, researchers have extensively analyzed the wealth of PISA results, producing insights that have shaped education policies and practices (Agasisti et al., 2018; 2021; Thieme et al., 2012).
Paradoxically, while middle-income countries, and especially Latin American countries, have received less attention, according to the World Bank “The results from PISA 2018 highlight the learning crisis in Latin America and suggest that promoting better and more equitable learning continues to be the most important challenges to be tackled by the education systems in the region” Di Gropello et al. (2019). More research is required for these countries in which gender and rural-urban gaps are substantial. Existing studies for Latin America have addressed various issues pertaining to PISA results (Gamboa and Waltenberg, 2012; Villar and Zoido, 2016; Rivas and Scasso, 2021; Delprato and Antequera, 2021; Flores-Mendoza et al., 2021). However, most of them (e.g., Jorge-Moreno et al., 2018; Krüger and Formichella, 2019; Pinto et al., 2019; Rivero, 2019; Suárez-Mesa and Gómez, 2024) concentrate on PISA results from 2012 or 2015, primarily focusing on the mean scores, overlooking the disparities that may arise across the distribution of the sample (Lounkaew, 2013). This issue is particularly relevant for countries where test results exhibit significant heterogeneity among different school characteristics (urban vs. rural, public vs. private, etc.). Explanatory variables identified as significant determinants of academic achievement may exhibit varying effects across different percentiles of the score distribution. Therefore, designing effective policies to narrow educational outcomes requires a deeper understanding of the determinants of test performance across different quantiles of the distribution. Additionally, while the rural-urban gap remains the single most extensively documented development and welfare disparity in the region’s economies, existing studies on PISA results in Latin American countries have not sufficiently focused on the rural-urban performance gap, with only a few exceptions (Santamaría, 2017; Ramos et al., 2012).
This research comprehensively investigates the determinants of student performance in the Program for International Student Assessment (PISA) 2018 tests, focusing specifically on the rural-urban educational gap in Colombia, using data from individual Colombian test takers. As the second most recent OECD member, Colombia exhibits notable characteristics, including pervasive economic and social disparities between rural and urban areas (Rendón and Gutiérrez, 2019). For instance, in 2017, the proportion of rural Colombians living in multidimensional poverty was more than double that of urban residents. Additionally, Colombia has a long history of violence and internal migration, particularly impacting rural regions (Angrist and Kugler, 2008; Méndez-Giraldo et al., 2023). Development gaps are also mirrored in rural-urban educational disparities. Our contribution to the literature centers on this gap. To our knowledge, there is only one previous paper for Colombia with this focus (Ramos et al., 2012), and it does not employ data from the latest PISA test results nor does it distinguish results for different performance distribution quantiles.
Our study employs a multifaceted approach, and the contributions to the existing literature are threefold. First, we estimate a student-level education production function at different points along the achievement distribution. This contribution is especially relevant for a country, such as Colombia, in which educational inequality is particularly pronounced. Second, using the Oaxaca–Blinder decomposition, we gauge the extent to which differences in achievement between urban–rural students can be attributed by aspects including individual characteristics, family characteristics, and school characteristics. Finally, by incorporating additional factors such as bullying, teacher support, positive feelings, and resilience into the PISA 2018 student data, we employ the Oaxaca–Blinder decomposition once more to ascertain the influence of these factors on the achievement differential.
The findings, rooted in the PISA 2018 database, revealed profound and statistically significant disparities across various subjects—mathematics, reading, and science. Importantly, observable factors emerged as pivotal drivers of the identified performance gap, with school characteristics playing a significant role, explaining over 40% of the variations in students’ performance. Family characteristics also played a substantial role, explaining more than 20% of the gap in mathematics and science, and 32% in reading. Individual characteristics, while statistically significant only in mathematics and science, contributed nearly 10% to the performance gap.
Intriguingly, subjective factors such as bullying and teacher support did not prove to be significant determinants of the observed differences. Gender-specific analyses revealed distinct effects, with family and school characteristics exerting more influence on girls, while individual factors held greater importance for boys.
Results from quantile regressions indicate that important differences are observed when considering distinct test percentiles. Mean estimation results show that all individual characteristics (except gender in the case of results on reading) and almost all family characteristics are relevant in explaining differences in scores both for rural and urban students. However, parents’ educational level and family property are not important drivers of the observed differences in results. Interestingly, while Oaxaca-Blinder decomposition results indicate that school characteristics are the most relevant in explaining score gaps, OLS results show that the only school characteristic that matters is whether the school is public or privately owned. As in most studies for developing countries, students from private schools outperform their peers in state schools (Diaz-Rios and Urbano-Canal, 2021; Pedró et al., 2015).
Regression results show that the effect of individual, family, and school covariates on student performance vary depending on the quantile of the distribution that is considered. For instance, repeating a year and house characteristics, which are relevant determinants of performance in the mean, lose significance at the two tails of the distribution.
The empirical findings of this study carry significant implications for the implementation of educational policies in Colombia and other similar developing economies. Section 2 provides a description of the data. The third sec- tion outlines the methodology employed. In the fourth section, we present the main results of the Oaxaca-Blinder decomposition and of quantile regressions. Finally, the last section offers concluding remarks.
I. Data
We gathered data from the Program for International Student Assessment (PISA) 2018 test, administered to 15-year-old students to measure their proficiency in mathematics, reading, and science literacy. The test, first conducted in 2000, is administered every three years. In its latest iteration, students from 79 countries took the test.
The PISA employs a two-stage procedure, where schools are initially sampled followed by the sampling of students within selected schools. This sampling technique increases the standard errors within a population. Consequently, estimating a population parameter requires the use of weights associated with the sampling and the computation of uncertainty due to sampling. Hence, student performance must be estimated using ten plausible values for each student, and results must be aggregated. Data is weighted to account for three factors: first, students do not have the same probability of being selected; second, differential participation rates require nonresponse adjustments; and third, certain explicit strata are oversampled for national reporting purposes (OECD, 2018).
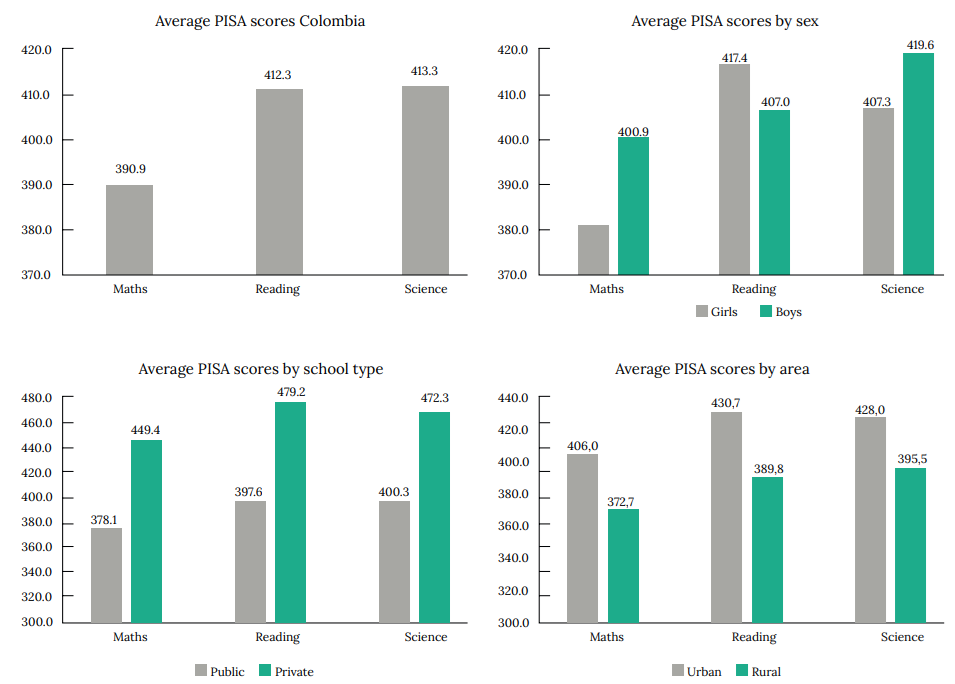
Data for Colombia consists of 7522 observations for students in 247 participating schools. Figure 1 presents some descriptive statistics. Panel (a) shows average scores for Colombia in mathematics, reading and science. These results are far below average test scores for the 79 participating countries, especially in mathematics (391 in Colombia vs. a test average of 489). Panel (b) shows average performance by gender. Boys outperform girls both in mathematics and science, while girls do better in reading. However, the most notable gaps are observed when scores are stratified by school type. Private schools widely outperform state schools in the three areas. Notably, scores for private Colombian schools are close to global (79 countries) averages. Importantly, as shown in panel (d), large gaps are observed between students in rural and urban areas. As in other developing countries, students in Colombia’s rural areas have fewer school choices than their urban peers, with the majority attending state schools, as demonstrated by Echazarra and Radinger (2019). In 2017, only 4.2% of rural students attended an independent private school, compared to 23.4% of urban students (Sanchez, 2018).
The breadth and depth of the information collected through PISA allows for a detailed understanding of educational dynamics, enabling a robust analysis of the factors influencing student performance. By employing this data, a solid empirical foundation is established, supporting the exploration of educational disparities between rural and urban areas in Colombia. The richness of PISA data not only provides a panoramic view but also facilitates the identification of significant patterns and trends, thereby contributing to the formulation of informed conclusions and offering valuable insights for decision-making in the educational and policy realms. In this context, the utilization of PISA data emerges as an essential component for achieving the objectives of this study, enabling a deep and meaningful investigation into disparities in student performance within a specific national context.
2. Methodology
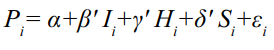
The literature has shown that student perfor- mance is primarily explained by three basic components: individual characteristics, family characteristics, and school characteristics (see, for instance Hanushek, 1997; Sherman et al., 2008; Woessmann, 2016) We incorporate a fourth component related to other subjective factors which could impact student performance, such as bullying, teacher support, positive feelings, and resilience. These factors, which have been shown to be important determinants of academic performance (Dietrich and Cohen, 2021) were included in the PISA 2018 student survey, allowing their incorporation into PISA evaluation studies. The following equation is the starting point of our empirical model:
 (1)
(1)
where Pi stands for student i’s average score of the ten plausible values for each subject area. Ii, Hi, Si are vectors of individual characteristics, family characteristics, and school characteristics, respectively. Finally, is the intercept and represent an independently and identically distributed zero-mean error term.
Expanding on this, the vectors Ii, Hi, and Si in Equation (1) encapsulate a comprehensive set of variables representing individual, family, and school characteristics, respectively. For the individual characteristics (Ii), the vector includes Grade repetition, Student international grade, and Student gender, offering insights into the student’s academic history and attributes. The family characteristics (Hi) vector encompasses the Index of the highest parental education in years of schooling, Household possessions, Index of the highest parental occupational status, Cultural possessions at the household, Household educational resources, and Family wealth. These variables collectively capture the socio-economic and educational background of the student’s family. Finally, the school characteristics (Si) vector consists of School ownership, Student-teacher ratio, School size, Number of available computers per student at modal grade, Proportion of available computers connected to the Internet, Total number of all teachers at school, Index proportion of all fully certified teachers, and Class size. These variables are intended to shed light on various aspects of the educational environment, institutional resources, and teaching dynamics within the school setting. The inclusion of these specific variables ensures a comprehensive exploration of the multifaceted factors influencing student performance, aligning with the established literature, and enhancing the robustness of our empirical model.
Our focus is on the rural-urban gap. Thus, students are grouped based on their school location, distinguishing between rural and urban areas in Colombia. Rural school are in small towns or villages with a population of fewer than 15,000 people, while urban schools encompass the remaining areas. Furthermore, in certain specifications, we further stratify the analysis by gender.
A. Oaxaca-Blinder Decomposition
We first used the traditional Oaxaca-Blinder decomposition (Blinder, 1973; Oaxaca, 1973), frequently implemented in studies identifying some sort of labor market discrimination (by race, gender, etc.). This decomposition is a statistical method that explains the difference in means of a dependent variable between two strata into a part that responds to observed differences in the mean values of the model’s covariates within the groups and group differences in the effects of the covariates. Emphasis is usually placed on the second part of the decomposition, namely the unexplained differential in the dependent variable.
In this study, the Oaxaca-Blinder decomposition estimates the difference in student performance by urban and rural groups and explains how much is due to observable factors and how much is due to unobservable or residual aspects.
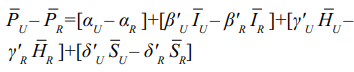
Equation (1) is estimated separately for students in rural and urban areas. As average values of residuals in these linear regressions are zero, then:
 (2)
(2)
where the subscript U corresponds to urban students and R corresponds to rural students.
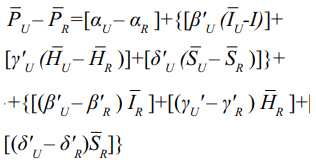
Following Jann (2008), equation (2) can be written as follows:
 (3)
(3)
The component given by 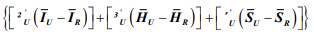 measures the portion of the difference in student performance that is attributable to group differences in endowments, in other words, the explained component. The component given by
 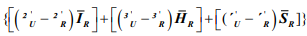 represents the contribution of differences in the coefficients, more specifically, the unexplained component. Some studies refer to this component as the “discrimination” component. However, it is important to note that the unexplained differential in the dependent variable should not be interpreted solely as the amount of the difference attributable to discrimination. This is because other covariates not included in the regression, such as unobserved factors, may also contribute to these differences.
B. Quantile regression
Under the assumptions of linearity and , it is possible to use OLS to estimate the coefficients of Equation (1). However, the literature suggests the presence of potentially relevant nonlinear relationships between the dependent variable and the included independent variables derived, for example, from the presence of heteroskedasticity in the education production function (Escudero et al., 2009; Gertel et al., 2012) due to unobservable factors. Consequently, in this study, we conduct regressions on the mean, as well as on the 10th and the 90th percentiles of the sample distribution.
Quantile regressions are useful for evaluating test results while considering heterogeneity in the population under analysis, and for examining whether the coefficients of the explanatory variables vary across different quantiles. Findings from quantile regressions can offer significant insights for public policy as they provide the policymaker with crucial information on the impact of different covariates on performance for students across the entire distribution, including those at the center and the tails.
III. Empirical Results
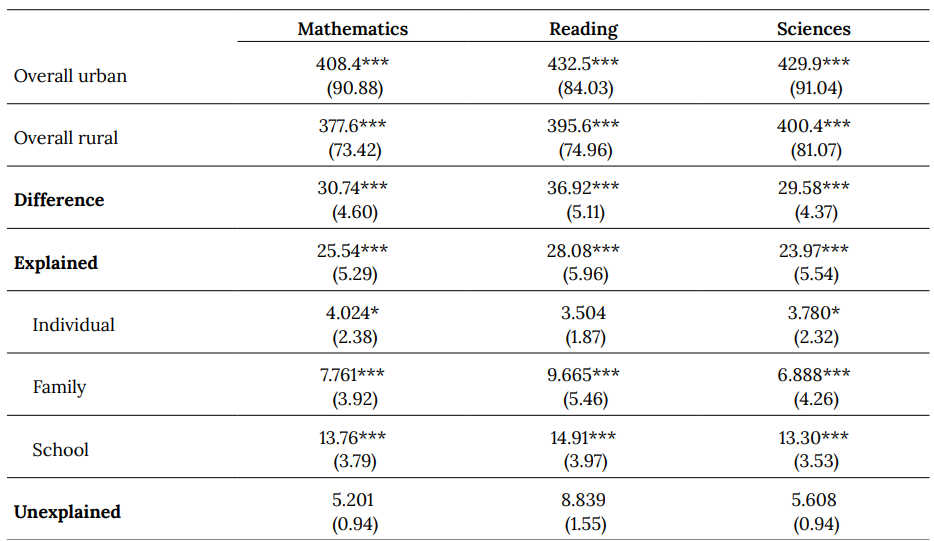
The Oaxaca-Blinder decomposition results are presented in Table 1. Estimation results are consistent in showing that test performance is significantly different for students in Colombia’s rural and urban areas. On average, students in rural areas obtain a score which is 30.7 points lower in mathematics, 36.9 points lower in reading, and 29.6 points lower in science than their urban school counterparts. These differences are significant at the 1% significance level. Interestingly, all these differences in test outcomes can be accounted for by explained factors, with school and family characteristics being most important.
This result is highly significant, as it indicates that school characteristics, which account for over 40% of the rural-urban gap, can be modified and improved by public policy actions. Rural schools in Colombia exhibit higher student-teacher ratios, inferior physical infrastructure, and lower teacher quality compared to schools in urban areas1. Educational policy in Colombia should prioritize efforts to narrow student performance gaps by investing in the enhancement of school quality, particularly in rural areas. However, results also indicate that the gap cannot be fully closed through educational policy alone. Family characteristics account for a significant portion of the gap (over 20% in mathematics and science, and 32% in reading), indicating the need to implement broader social policies aimed at reducing poverty in rural areas and improving the overall learning environment for school students. Finally. individual characteristics explain nearly 10% of the gap. Interestingly, bullying, teaching support, and other perception variables were found to be insignificant in explaining the gap.
Table 1. Oaxaca-Blinder decomposition results for the rural-urban educational gap in Colombia using PISA 2018 test results (mathematics, reading, and science)
* p<0.05
**p<0.01
***p<0.001
t statistics in parentheses
In Tables 1 and 2 the variables included in each dimension are: Individual: Grade repetition, Student grade, Gender; Family: Highest parental education in years of schooling, Household possessions, Highest parental occupational status, Cultural possessions at the household, Household educational resources, Family wealth; School: School ownership, Student-teacher ratio, School size, Number of available computers per student at modal grade, Proportion of available computers that are connected to the Internet, Total number of all teachers at school, Proportion of all fully certified teachers, Class size.
Source: Authors based on PISA 2018 microdata.
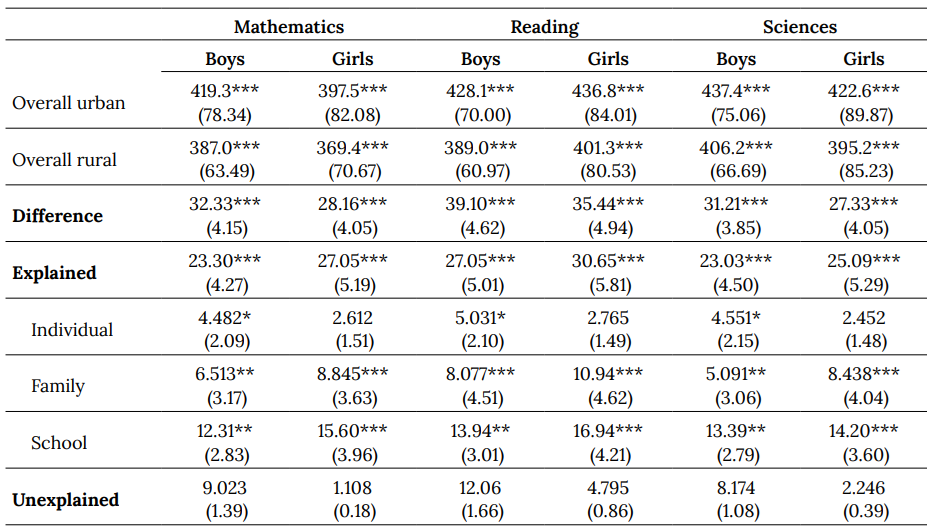
Similar conclusions are drawn when results are stratified by gender (see Table 2). However, the effects of endowments (i.e., the explained part) are more pronounced for girls than for boys. Furthermore, while school and family characteristics are more influential for girls than for boys, the reverse is true for individual characteristics. Family characteristics are probably more significant for girls than for boys due to gender discrimination issues prevalent in Colombia, where many girls are compelled to adhere to discriminatory gender roles within their households. The degree of gender discrimination is highly correlated with family characteristics (Rodriguez-Burbano et al., 2021).
Table 2. Oaxaca-Blinder decomposition results for the rural-urban educational gap in Colombia using PISA 2018 test results and stratified by gender (three areas)
*p<0.05
**p<0.01
***p<0.001
t statistics in parentheses
Source: Authors based on PISA 2018 microdata.
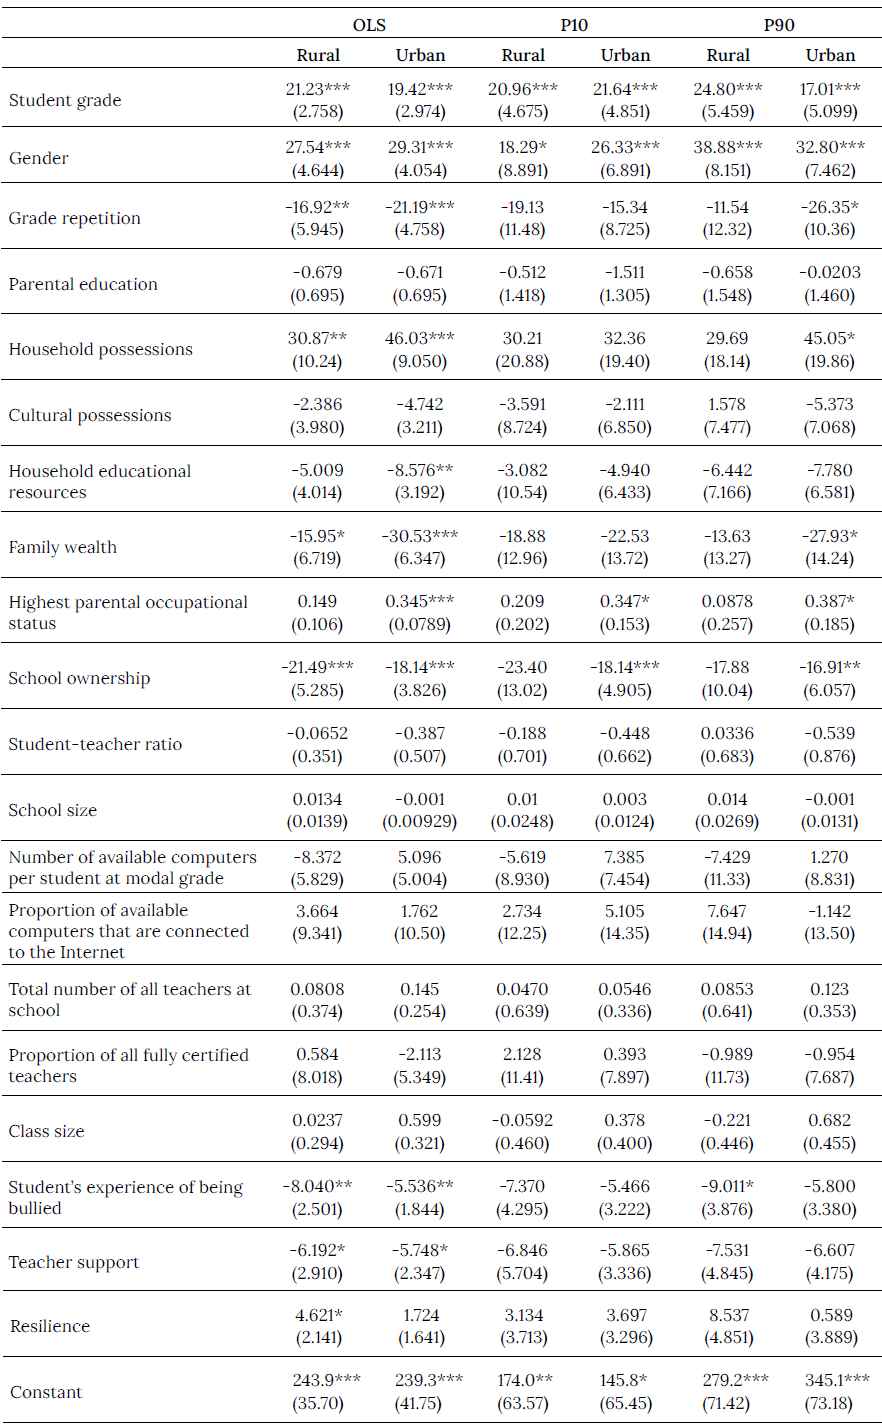
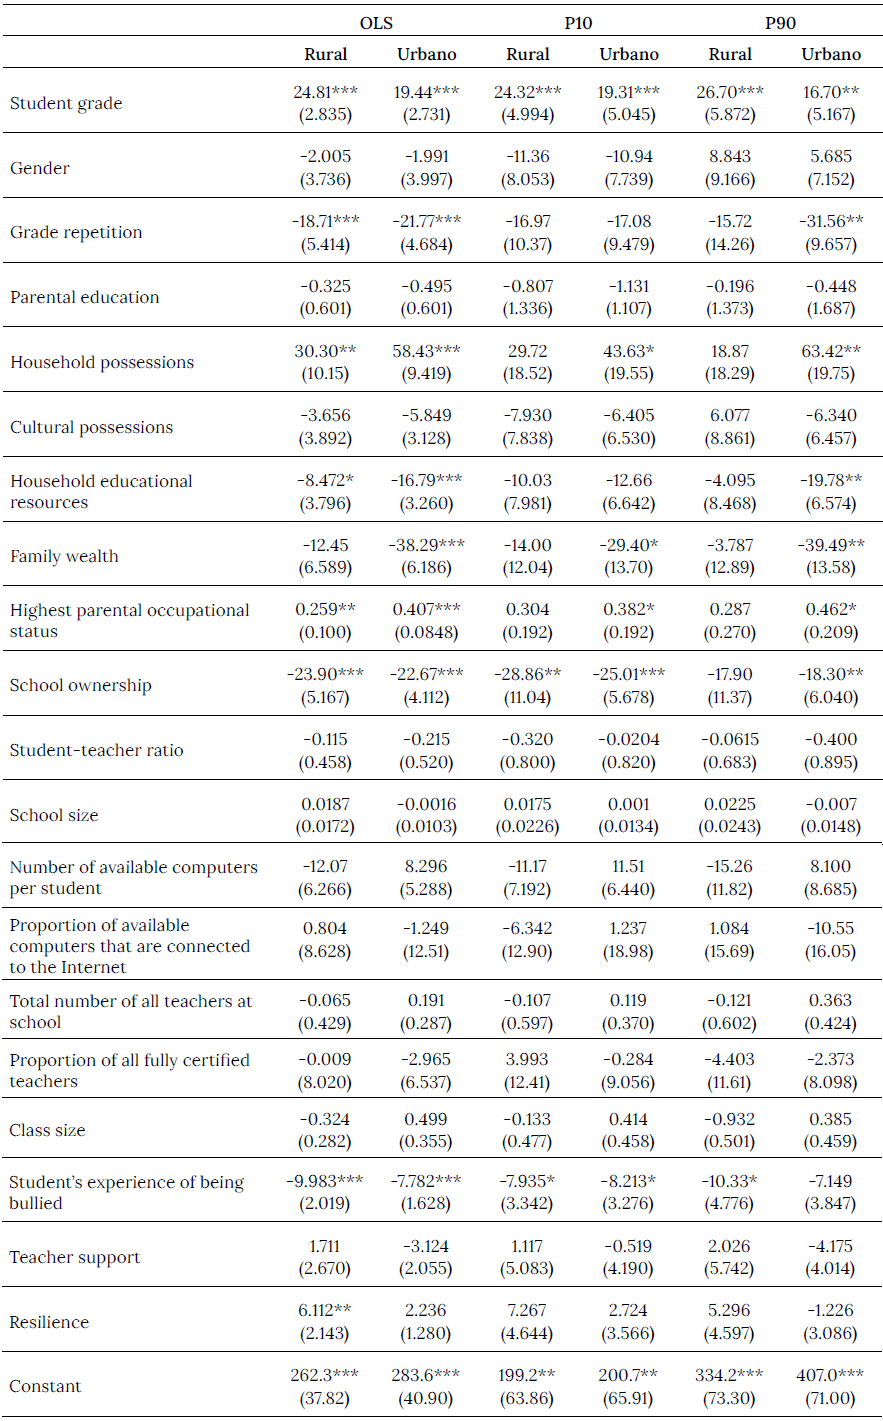
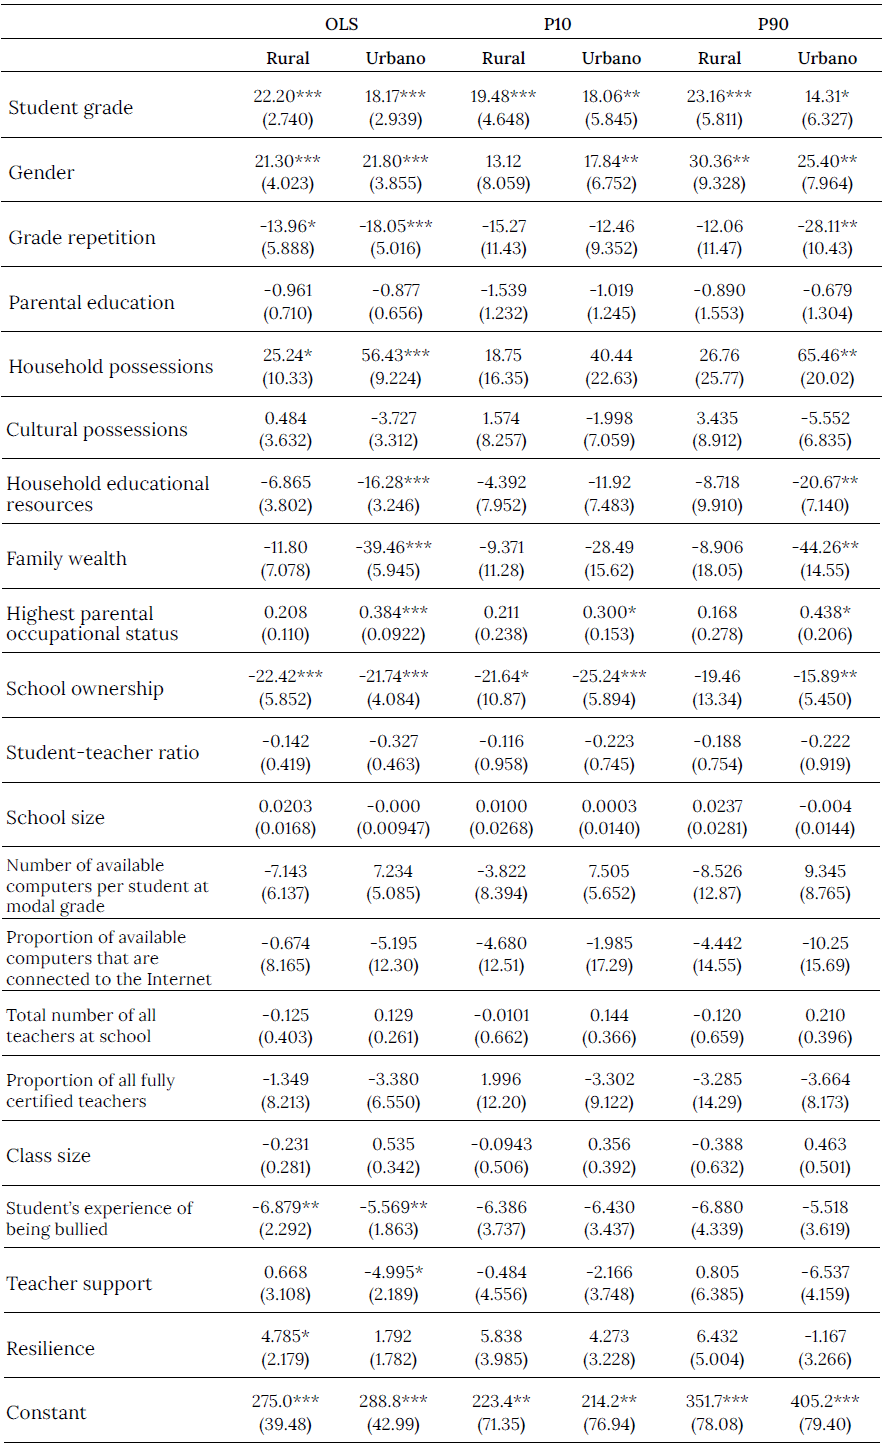
Quantile regression results are shown in Tables 3 (mathematics), 4 (reading), and 5 (science), in the Appendix. Mean estimations indicate that all individual characteristics (except for gender in the results for reading) and almost all family characteristics (notable exceptions are parents’ educational level and cultural possessions) are relevant in explaining differences in scores both for rural and urban students. Interestingly, while Oaxaca-Blinder decomposition results indicate that school characteristics are the most pertinent in explaining score gaps, OLS results show that the only school characteristic that matters is whether the school is a state school or a private one. This result is particularly relevant in this study, as rural schools are mostly state schools. Therefore, a combination of policies aimed at improving the quality of state schools and of promoting the development of a stronger private school system in rural areas should be implemented in order to narrow the country’s rural-urban educational gap.
Boys outperform girls in mathematics and science, and differences are greater for urban schools. In mathematics, boys in urban (rural) schools obtain on average 28.4 (23.4) points more than girls. In science, these differences are of 21.5 (16.8) points, respectively. However, no significant gender differences in scores are observed in reading. Additionally, students that have repeated a year have significantly lower results in test scores across all three subject areas.
Regressions for the 10th and 90th percentiles reveal notable differences compared to mean regressions. For instance, the variable indicating whether a student has repeated a year, which is significant for explaining differences in test performance at the mean and for students at the 90th percentile, appears to be irrelevant at the lowest tail of the distribution. In essence, students with poor performance who have repeated a year obtain similar results to those with poor performance who have not repeated a year. However, repeating a year makes a difference for average and top-performing students. A similar conclusion is reached when considering household educational resources. The Household possessions variable is pertinent for urban students in all percentiles of the distribution, and is statistically significant for those at the highest percentile. In rural areas, this variable is only significant in the mean. This observation may be attributed to the higher income inequality observed in urban areas in Colombia, where significant socioeconomic disparities exist. Rural areas, on the other hand, are predominantly inhabited by low-income households. Notably, significant variables tend to hold more significance for students in the highest percentile compared to those in the lowest percentile. These, and other examples, illustrate the importance of considering different distribution quantiles for understanding PISA test results and gaps. An effective public policy aimed at improving student performance and narrowing significant gaps must take into account the varying effects that different covariates have across distinct segments of the performance distribution.
Gender gaps, however, exhibit similar patterns across the three quantiles examined in this study. Specifically, boys outperform girls in mathematics and sciences in all cases, except for rural students in the 10th percentile. Conversely, in reading, gender differences are only significant for rural students in the 10th percentile.
Conclusions
This study provides a comprehensive exploration of the educational disparities between rural and urban areas in Colombia, leveraging the rich dataset of the Program for International Student Assessment (PISA) 2018. The empirical findings reveal stark and statistically significant variations in test performance, underscoring the challenges faced by students in rural Colombian areas. Students in these regions consistently lag behind their urban counterparts by 30.7 points in mathematics, 36.9 points in reading, and 29.6 points in science. Importantly, these performance gaps are elucidated by school and family characteristics, which account for over 40% of the rural-urban educational divide. This nuanced understanding of the contributing factors emphasizes the imperative for targeted policy interventions to improve school quality in rural areas and addresses broader socio-economic disparities affecting student outcomes.
Moreover, the gender-stratified analysis reveals nuanced patterns, particularly the disproportionate impact of school and family characteristics for girls and individual characteristics for boys. Notably, the study delves into the complex fabric of gender discrimination and its intersection with family dynamics, shedding light on the multifaceted nature of educational disparities. Surprisingly, subjective factors such as bullying, teacher support, and other perception variables were found to be insignificant in explaining the rural-urban gap. This challenges conventional wisdom and prompts further investigation into the intricate socio-cultural dynamics shaping student performance.
The strengths of this study lie in its ability to bridge research findings with actionable policy recommendations. By recognizing the significance of school and family characteristics, the study provides a foundation for targeted policy measures. The results advocate for a dual approach, urging policymakers to not only enhance the quality of state schools but also to stimulate the development of a robust private school system in rural areas. This synthesis of research and policy implications positions the study as a valuable resource for shaping educational policies that address the multifaceted challenges faced by students in different regions of Colombia. As we move forward, it is crucial to consider these findings as a catalyst for informed decision-making and a call to action for comprehensive policies that transcend traditional educational boundaries.