English (pdf)
 Article in xml format
 Article references
 Send this article by e-mail
 Cited by SciELO
  Cited by Google
  Similars in
SciELO
Similars in
SciELO  Similars in Google
 Permalink
Introduction
Compared to other developing regions, Latin American countries are extremely vulnerable to consumption boom-bust cycles and exhibit lower savings rates (Cavallo et al., 2016). Although the macroeconomic causes of these patterns have been extensively studied, little is known about other mechanisms that might be at play, such as positional concern. For instance, consumption cascades and the overconsumption of positional goods (Frank et al., 2014) driven by status-seeking behavior might have relevant consequences for a wide set of social outcomes that range from reducing expenditure on goods that enhance human development improvements in the long run, to diminished aggregate savings or increased crime rates (Charles et al., 2009; Hicks and Hicksy, 2014; Mejía and Restrepo, 2016).
A prerequisite for the design of empirical studies on consumption motivated by status-seeking behavior relies on identifying a set of positional goods. Since Chao and Schor´ s (1998) pioneering work, many attempts have been made to define a set of such goods based on visibility surveys. Drawing on the survey instrument proposed by Heffetz (2011), we identify a list of visible goods for a sample of Uruguayan adults and assess its variability according to individuals’ preferences for status and their personality traits (as measured by the Big Five Inventory, BFI).
Despite the relevance of identifying negative externalities, yielding, for example, to consumption booms, environmental degradation, or agency losses, that need to be addressed in order to promote human development and reduce multidimensional inequalities and poverty, there are no available studies on expenditure visibility and positional concerns for Latin American countries.
Ever since Veblen’s seminal work, theories on the determinants of positional consumption assume that access to certain goods increases individual well-being, not only due to the intrinsic value of the goods, but also because other people recognize them as a proxy for wealth (Frank, 1985; Veblen, 1994). In the same vein, Bourdieu (1979) argues that positional consumption constitutes a key element in the distinction of higher social strata, taste formation, and the legitimization of culture. As status cannot be obtained from the market, it arises from the perceptions of others and, therefore, consumption needs to be socially visible (Falk and Knell, 2004; Heffetz and Frank, 2011; Clark, 2012; Clark and D’Ambrosio, 2015).
Thus, visibility does not result from ‘objective’ observability but depends on the cultural and social value that each society or socioeconomic group assigns to holding certain goods and the associated expenditure (Heffetz and Frank, 2011). In their analyses for the United States and South Africa, Charles et al. (2009) and Kaus (2013) conclude that, conditional on income, populations facing discrimination spend relatively larger amounts of money on visible goods. They also show that the consumption of visible goods reduces expenditure on health and education as well as savings, eroding medium and longrun well-being. Furthermore, Maurer and Meier (2008) show that the sociocultural visibility of goods explains a substantial proportion of the heterogeneity in household expenditure patterns in the United States.
Observability or expenditure visibility and positional concerns might also be related to a wide set of personal characteristics such as age, gender, region of residence, intelligence, attractiveness, and personality traits (Akay and Karabulut, 2020; Postlewaite, 1998; Hillesheim and Mechtel, 2013). Moreover, recent findings by Bucciol et al. (2015) for the United States and Akay and Karabulut (2020) for Turkey indicate that personality traits, as measured by the BFI, are directly associated with self-perceived positionality. In both studies, conscientiousness and openness to experience are positively associated to status-seeking behavior.
Although the existing literature has highlighted status-seeking behavior and personality traits as key determinants of positional or visible consumption, few empirical studies identify their relative importance due to the lack of suitable data.1
Our empirical exercise is based on micro-data from the 2016/17 wave of the Longitudinal Study of Well-being in Uruguay (Estudio Longitudinal del Bienestar en Uruguay, ELBU). Unlike previous studies that gathered visibility information based on telephone surveys (Heffetz, 2011), ELBU involved face-to-face interviews, which might be associated with lower levels of social desirability responses (Holbrook et al., 2003). Since ELBU follows the principal caregiver of a child of reference, 91% of the interviewees were women. Survey instruments included questions capturing standard household survey demographic and socio-economic variables, Heffetz visibility scale and personality-trait items, and specific questions on preferences for status.
With respect to the existing literature, this research makes three main contributions. First, we provide a visibility ranking of consumption categories for a Latin American country, that exhibits scarce variability across demographic and socio-economic groups. The resulting order of goods is very similar to previous findings for the United States and South Africa. The scale is consistent and exhibits high reliability levels. Second, our findings confirm that, on average, individuals with greater preferences for status, assign higher visibility scores to all goods categories. Regarding the BFI domains, we identify a positive and significant association between conscientiousness and expenditure visibility. At the same time, openness to experience and neuroticism are also associated to the subgroup of goods with higher visibility. These findings suggest that expenditure visibility is not homogeneous across individuals as the standard consumer theory assumes. Moreover, a relevant proportion of consumer choices might be explained by differences in status concerns across individuals. Third, we show that status concerns exhibit a higher correlation to expenditure visibility than personality traits, reinforcing the idea that the sociocultural visibility of goods is highly determined by social interactions as suggested in the seminal writings by Veblen (1994) and Duesenberry (1967), among others. Taken together, our findings suggest some avenues for policy design that could help prevent consumption cascades and redirect expenditure choices to valuable human development functionings, particularly in contexts of rapid economic growth.
This article is organized as follows. First, we review the existing literature assessing the links between visibility, personality traits, and preferences for status. Then, in Section 3, we describe the main features of ELBU, the operationalization of the visibility scale, and the main variables of interest in this research. In Section 4, we present the analytical framework and the empirical strategy used in this study. Section 5 contains our main results, and Section 6 gathers some final remarks.
I. Visible goods, personality traits, and status preferences
One of the pioneering papers aimed at operationalizing positional goods through their visibility was written by Chao and Schor (1998). They identified consumption motivated by status by examining women’s spending on cosmetics. Recently, Heffetz (2011) proposed a 31-item survey instrument designed to identify visible goods based on the time it would take neighbors to notice higher-than-expected expenditures. This instrument was implemented through a telephone survey on a representative sample of 480 adults aged 18 years or over. It was subsequently used by Charles et al. (2009), and later expanded in Heffetz (2018).2 In all these studies, cars, watches and jewelry, personal care items, and clothing obtained the highest scores in reported visibility. To date, we have not found similar exercises available for Latin American countries.
In addition to socio-economic and demographic variables, expenditure visibility is associated to preferences for status and personality traits. Preferences for status have been theorized as a specific form of social preference. In turn, the empirical literature has found that people have heterogeneous social preferences, and that envy, altruism, pride, and status concerns operate with different levels of intensity (Clark and D’Ambrosio, 2015; Heffetz and Frank, 2011). An almost direct implication is that heterogeneous preferences may affect how the achievements of others, and, in particular, their consumption, are perceived. Although there is scarce evidence available based on survey data, experimental studies have confirmed the existence of significant differences in the extent of preferences for positionality, with significant variations by country and population sub-group (Alpizar et al., 2005; Carlsson et al., 2007, 2009; Carlsson and Qin, 2010).
The recent economic literature reveals a widespread consensus on the influence of social interactions on individual decisions and choices. However, there is less agreement on their intensity or on the determinants of group choices. When people compare themselves with others, they implicitly assign a higher weight to those individuals belonging to their reference group, which might include their friends, their work colleagues, their neighbors (Duesenberry, 1967; Luttmer, 2005), higher social classes (Veblen, 1994; Hirschman and Rothschild, 1973), or society in general (direction of comparisons) (Weiss and Fershtman, 1998).3 However, due to data constraints, in the empirical literature, it is commonly assumed that people compare themselves with others with similar observable characteristics (Heffetz, 2012).
Few studies identify reference groups based on information reported by survey respondents. Using data from the European Social Survey, Clark and Senik (2010) find that in most cases comparison groups are co-workers and friends. Meanwhile, Knight et al. (2009) show that in China two thirds of households report that their reference groups are individuals living in the same village.
Besides, recent empirical research addresses the association among personality traits and preferences for status, as well as the selection of domains for comparison with others (Landis and Gladstone, 2017; Friehe et al., 2014). Another branch of the literature, has focused on the variation of perceived social status and the importance of relative income according to personality characteristics (Bucciol et al., 2015; Proto and Rustichini, 2015; Budría and Ferrer-i- Carbonell, 2018). Friehe et al. (2014) and Landis and Gladstone (2017), for example, conclude that extraversion is associated with positional concerns. Akay and Karabulut (2020) implemented a series of experiments with university students in Istanbul to measure the positionality of several goods. They found a positive relationship between participants’ positionality perceptions and their score in the neuroticism and conscientiousness dimensions of the BFI.
Based on panel data for the United States, Bucciol et al. (2015) conclude that the BFI dimensions have a high predictive power to explain self-perceived social status.4 This evidence clearly highlights the relevance of considering personality traits as key potential determinants of the visibility of goods. However, to the best of our knowledge, these aspects have scarcely been explored in the empirical literature on the subject.
II. Data and main variables
A. Data
This study is based on data from the ELBU’s fourth wave, that were collected in 2016/17. ELBU follows a sample of households that had children attending the first year in state schools in 2004 and were located in the departmental capitals of Uruguay (85% of the cohort). Since children attending private schools were not included in the sample, the upper tail of the income distribution is under covered.5 Although ELBU comprises four waves, only the last one gathered information on the visibility of goods, the BFI, and intensity of comparisons. Meanwhile, a question on the direction of interpersonal comparisons was included in the last two waves (2011/12 and 2016/17). In general, the responding adult was the mother of the youngster of reference who, in 2016/17, was between 18 and 20 years old.
Wave 1 included 3187 households and 1525 were recovered in wave 4 (attrition rate= 49%). Table A1 in the Annex depicts the potential biases in panel attrition. Differences are negligible in most observable characteristics considered, although there is a higher loss among households in Montevideo and those whose household heads had a lower educational attainment level. Although our analysis is entirely based on data from wave 4, in the robustness checks question, we use waves 3 and 1.
Since the previous literature and our own findings (below in this article) demonstrate that socio-economic variables are not relevant to identifying or ranking visible goods, using a data-set such as ELBU that lacks the upper tail of the income distribution is not a severe drawback in the context of this paper. However, regarding the association of the visibility index with personality traits and the direction of comparisons, if these characteristics were distributed differently among the richest strata compared to the rest of the population, our results might represent either a lower or an upper bound depending which characteristic predominates.
B. The visibility index
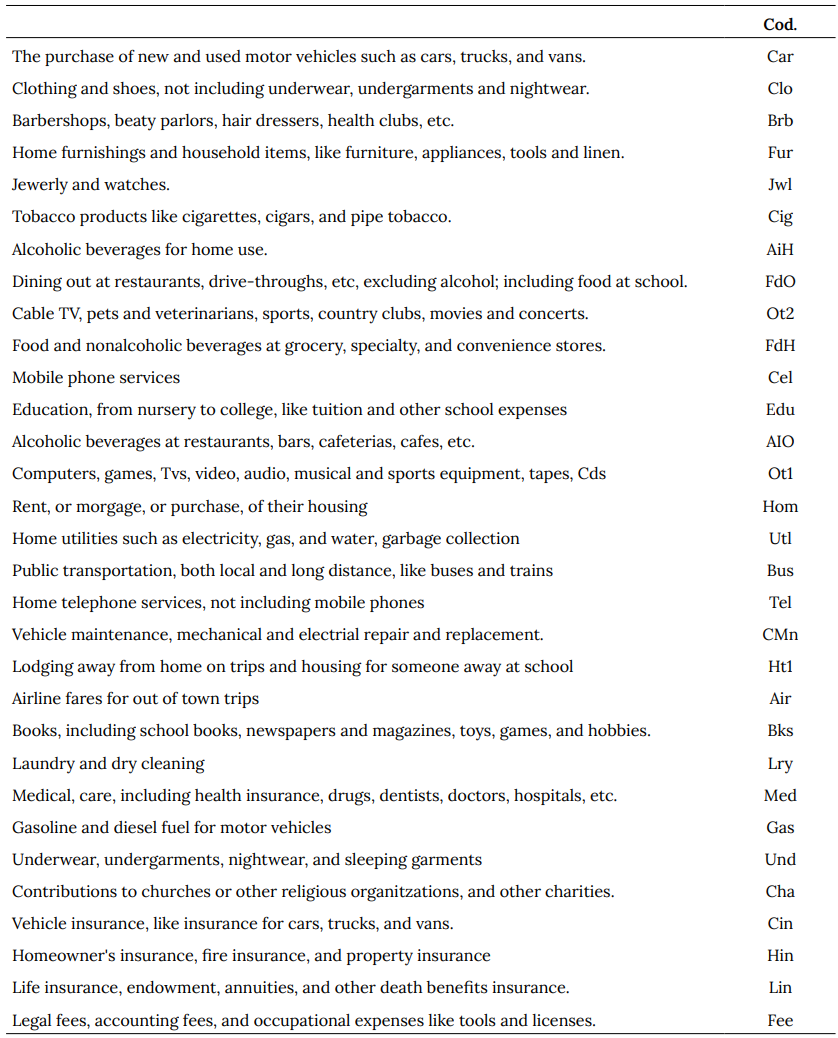
The visibility instrument designed by Heffetz is based on the following question: “Imagine that you meet a new person who lives in a household similar to yours. Imagine that their household is no different from other similar households, except that they like to, and do, spend more than average on (category of good). Would you notice this about them, and if so, for how long would you have to have known them, to notice it? Would you notice it almost immediately upon meeting them for the first time (1), a short while after (2), a while after (3), only a long while after (4), or never (5)? (category of good)?”
This question was repeated for the 31 categories of goods.6 However, in ELBU, the original response categories corresponding to intermediate values were collapsed as follows: (1) almost immediately, (2) after a while (original values=2, 3 and 4), and (3) never.
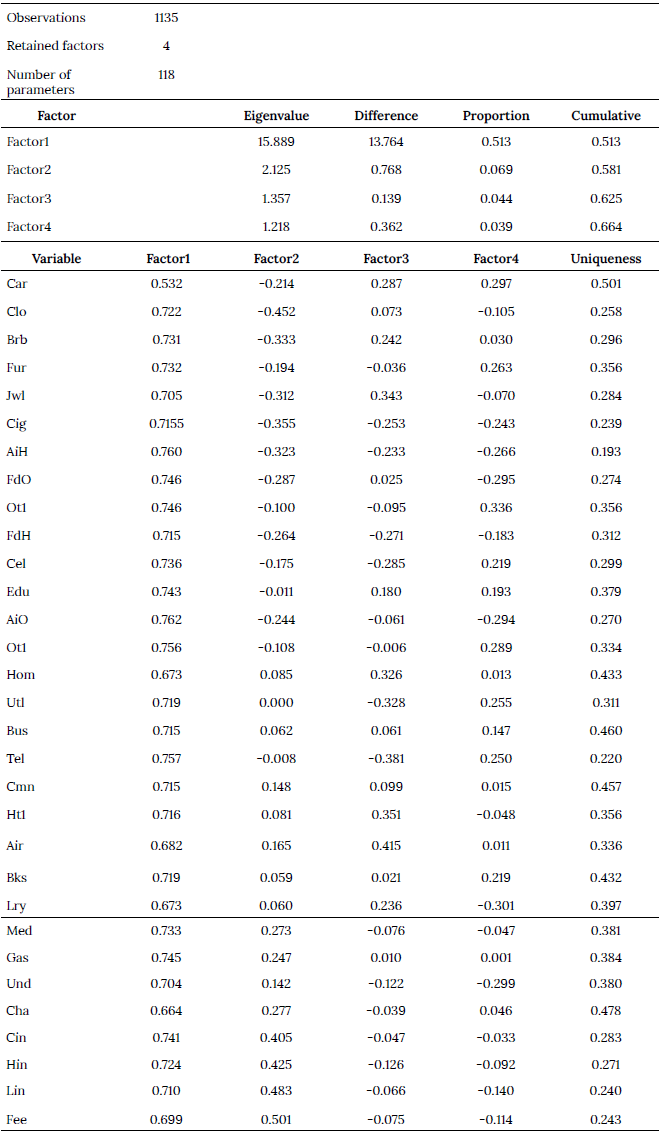
We obtained a Cronbach’s Alpha reliability coefficient of 0.9655, indicating a high internal consistency of the scale. To assess whether the 31 items converge to the same factor, we performed an exploratory factor analysis. Table A3 in the Annex indicates that all goods belong to the first factor, which explains 51.25% of the total variance, and, in all cases, factor loadings are above 0.50.
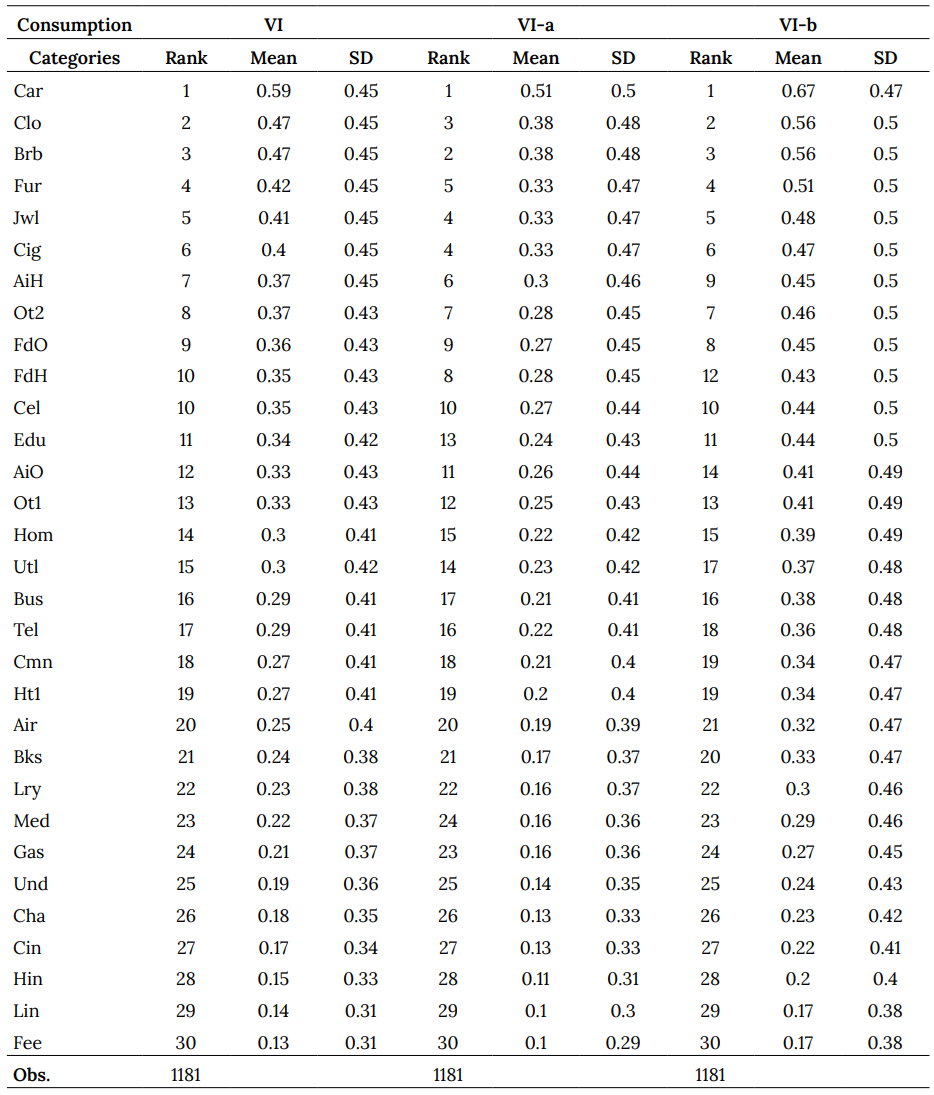
To build the visibility index (V I), we first recoded the responses as follows: zero (answer=3: no visibility), 0.5 (answer=2: medium visibility), and 1 (answer=1: maximum visibility). Following Heffetz (2011), our baseline measure is the average of the value provided for each of the 31 items. A higher value of the index implies greater visibility. The respective aggregate visibility index (all) computes the average of the 31 items.7
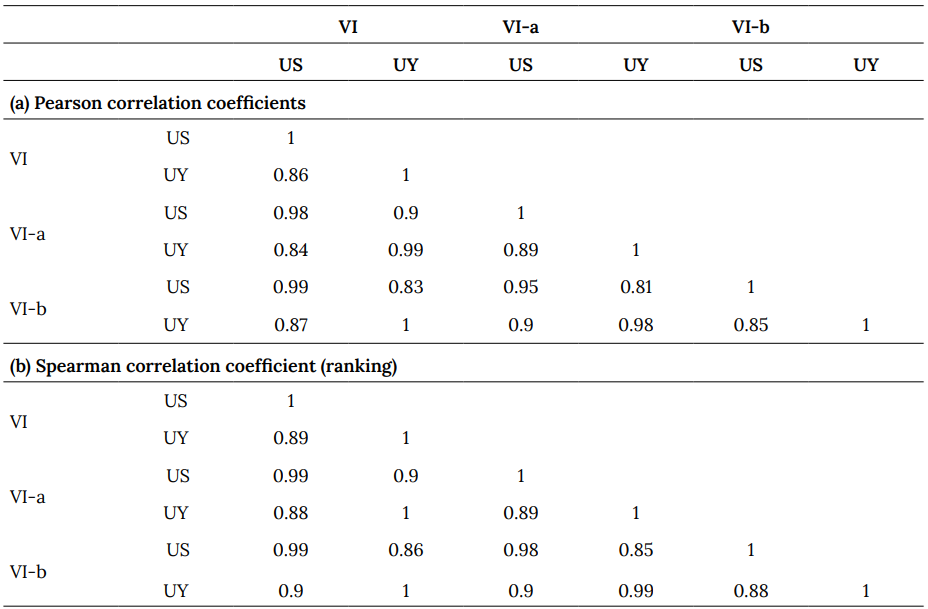
In addition, although ELBU interviewees were mostly women, the indices we obtained are very similar to the ones computed by Heffetz (2011) for the United States (Figure 1), with a respective Pearson or Spearman correlation coefficient higher than 0.85 and 0.81 (see Table A4 in the Annex).8 Although both countries demonstrate significant differences in average per capita household income and consumption levels, and Uruguay is a relatively more homogeneous society, they exhibit very similar visibility rankings. These results also coincide with the findings by Kaus (2013) for South Africa, suggesting that this instrument behaves similarly in different economic and cultural contexts.
In the case of Uruguay, cars display the highest expenditure visibility score, followed by clothing, and personal care. Another feature that seems to be corroborated is that visibility transcends objective observability of the type of expenditure (where, what, and how it is consumed). This attribute seems to be present in the goods located in the first three positions. However, based on observability, it is more difficult to understand heterogeneity levels in education (12th position, V I of 0.33), laundry and dry-cleaning expenses (23rd position, V I 0.23), or medical care (24th position, V I 0.22). These differences may be related to demographic, socio-economic or cultural characteristics (Heffetz, 2012).
C. Main variables
As noted above, expenditure visibility is disaggregated by socio-economic and demographic variables, personality traits, and preferences for status.
i. In line with Heffetz (2012), the first group included demographic variables (age, sex, ethnicity, household size, and number of household members under 18); and socioeconomic variables (years of schooling, per capita income quintiles, and labor force status). Descriptive statistics are presented in Table 1. Note that 91% of the respondents are women.
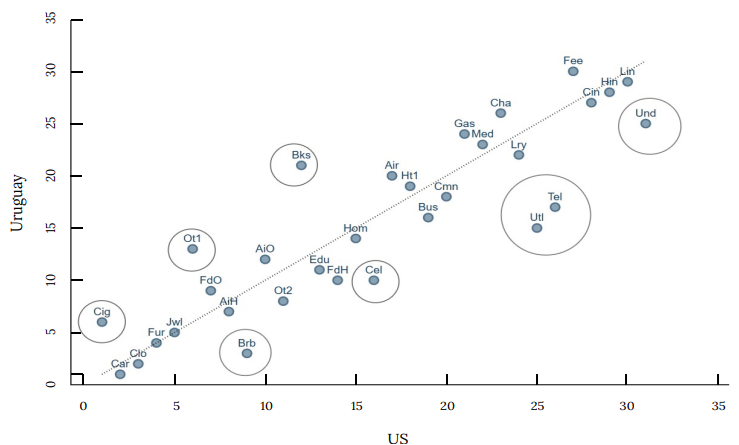
Source: Column 1 in Table A5 and Heffetz (2011).
Figure 1. Visibility Ranking: the United States vs UruguayNote: This figure depicts the visibility ranking for Uruguay and the United States and the 31 goods categories. Estimations for Uruguay are based on ELBU and the ones for the United States are based on Heffetz (2011). The horizontal axis corresponds to the United States the visibility of goods ranking and the vertical axis to the Uruguayan one.
Table 1. Descriptive Statistics. Demographic and Socio-economic Variables
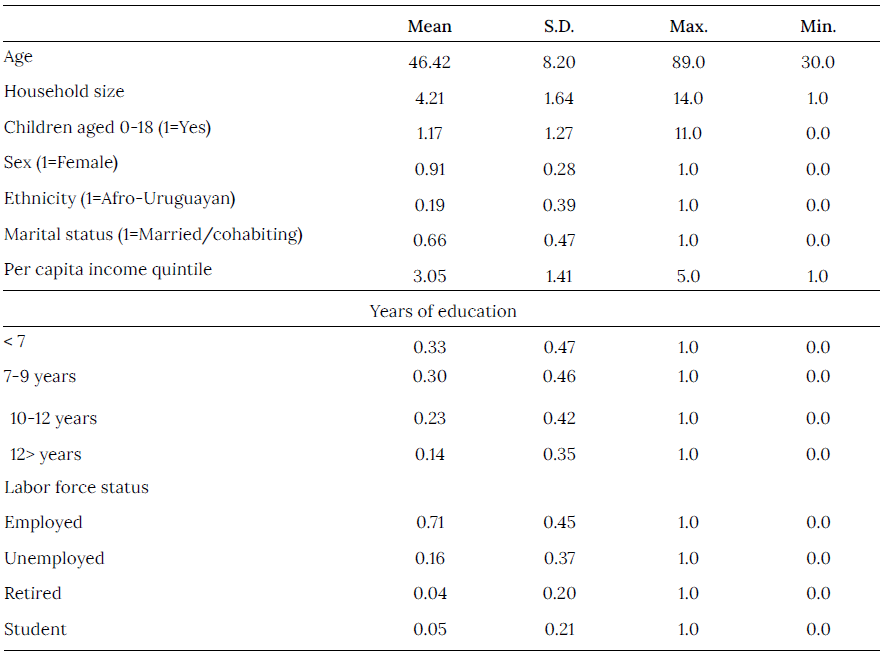
NoteThis table depicts descriptive statistics of the main characteristics of ELBU respondents.
Source: Authors, based on ELBU
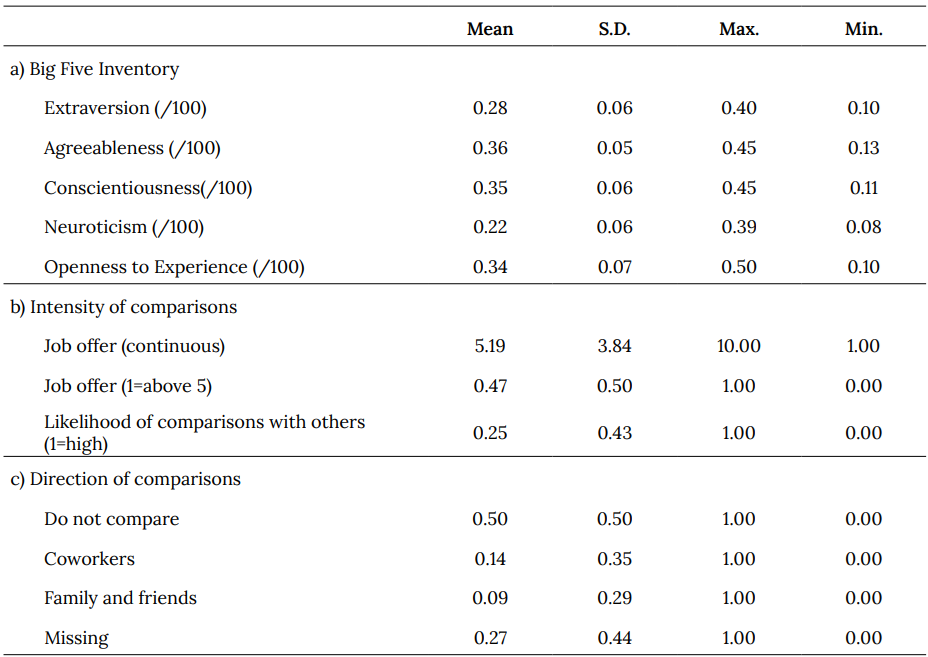
ii. As previously noted, personality traits were assessed using the BFI. This instrument identifies five dimensions (John and Srivastava, 1999): (i) extraversion (sociability, activity, assertiveness, and positive emotionality); (ii) agreeableness (altruism, tenderness, confidence, and modesty); (iii) conscientiousness (impulse control, such as thinking before acting, delaying gratification, following rules and regulations, and planning, organizing, and prioritizing tasks); (iv) neuroticism (implies feeling anxious, nervous, sad, or tense); and (v) openness to experience (breadth, depth, originality, and complexity of mental life and experiences).9 Although the BFI has been widely used and can be easily included in a survey questionnaire, it is not exempt of criticism. Besides the caveats of being a self-reported measure (Dang et al., 2020), in their assessment of 23 middle- and low-income countries, Laajaj et al. (2019) conclude that in some economic and cultural contexts that differ from rich and educated populations, the validity of BFI is lowered. Moreover, to date we lack validation of the Spanish version of the instrument based on a representative sample of the whole population. Table 2 shows that the lowest score is observed in neuroticism (0.22), while the highest corresponded to agreeableness (0.36).
iii. Preferences for status were approximated in two different dimensions: intensity (a) and direction (b) of comparisons to others. In the first case, we used two alternative indicators. Our preferred option is based the following survey question: Imagine that you get an offer for a permanent full-time job that you like. Your potential employer asks you to indicate the wage you are willing to receive. For each of the following items, please indicate on a scale from 1 to 10 (where 1 is very little and 10 is a lot) how true it is that you would consider in your proposal: 1. your friends’ earnings; 2. earnings from people who have the same experience and qualification as you; 3. your neighbors earnings; 4. your earnings in a previous job; 5. the earnings of a relative that does not live in your household; 6. the wage bargained by the corresponding union; 7. you would not compare yourself to anyone. We created a variable reflecting the maximum value of the answers of each respondent to those options that entail comparisons with other individuals (1, 2, 3, 5 and 6) and included it in the regression analysis as a continuous variable or as a binary one indicating answers lower than 5 (0) or equal to 5 or above (1). An alternative option was based on the following survey question: How important is it for you to compare your income to others? Answers range on a scale from 1 (not important at all) to 5 (very important). Options 4 and 5 were labelled as high intensity comparisons.
To measure the direction of comparisons, we drew on a question that resembles the one previously analyzed by Clark and Senik (2010): Which persons are you more likely to compare your income to? The following response options were offered: coworkers, family members, friends, someone else, I do not compare my income to anyone’s. We grouped the answers into three categories: ‘coworkers or others”; 2 “family or friends”; and 3 “do not compare.” This question was also included in wave 3 and it is used in our robustness checks.
Descriptive statistics on intensity and direction of comparisons are presented in Table 2. More than two thirds of the interviewees indicate that they do not consider it relevant to compare themselves with other people, and the average of the variable reflecting the maximum in the 1 to 10 scale is around 5 (intensity of comparisons). Regarding the direction of comparisons, 50% of the respondents indicate that they do not compare themselves with anyone, whereas 13% compare themselves with coworkers, and 10% with family and friends. Notice the large percentage of non-responses (26%).
III. Conceptual framework and empirical strategy
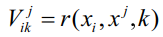
Based on Heffetz (2011), we present a basic model reflecting the determinants of the socio-cultural visibility of goods. Subsequently, additional aspects related to social interactions and personality traits are added. In the original model, visibility depends on the type of good consumed, the characteristics of the respondent, and the person whose consumption is observed:
 (1)
(1)
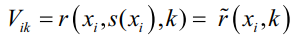
where r(·) is a function describing how fast individual i recognizes expenditure of a third party j in k and vector x is a set of personal and household characteristics. As previously indicated, the visibility scale is based on perceptions of the consumption of other individuals j with similar characteristics to the survey respondent i, termed jref. In this way, we impose an additional assumption on the type of visibility we are capturing (xj = s(xi)) in the survey questionnaire, which restricts the r function to the domain in which respondent, i believes she is similar to jref. Thus, the sociocultural expenditure visibility can be modelled on the basis of an adapted response function:
 (2)
(2)
Equation 2 explicitly shows a limitation of the Heffetz (2012) instrument, since it does not allow us to distinguish whether variations in the degree of visibility result from differences in the characteristics of individuals i, differences in the people whose consumption is observed iref, or a combination of both.10
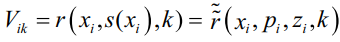
To allow for additional sources of individual heterogeneity, we incorporate personality the individual characteristics i vector, and preferences for status, both in terms of intensity and direction of individual comparisons. These additions have not been considered in the previous empirical literature on expenditure visibility and might provide a better understanding of signaling models. Thus, we rewrite Equation 2 as follows:
 (3)
(3)
where
 (4)
(4)
Based on the preceding definitions, it is possible to formulate an empirical specification to estimate the parameters of interest, that, compared to the previous literature, reduces the bias of potentially omitted variables. The socio-demographic characteristics vector, xi, can be opened into a set of observable Xi and unobservable ηi variables:
 (5)
(5)
This linear relationship is directly derived from the extended model and can be estimated upon different dependent variables k, such as the composite index or the 31 goods categories. αk is a constant term, while  is an error term that has two main components. The first one is a function of the omitted socio-demographic variables (ηi), and the second one
  reflects differences in individual tastes not captured by BFI or other sources of measurement error. Besides, pi reflects personality traits BFI, zint represents the intensity of comparisons, and zref identifies the relevant comparison group. The model estimated by Heffetz assumes that the latter parameters take value 0, and alter the definition of the error term
  . Without additional assumptions on the behavior of these errors conditioned on the demographic variables observed, the estmated parameters βk cannot be interpreted as representing a causal relationship. However, given Xi, the estimated coefficients represent the best linear prediction of Vik for the index k.
We first assess the statistical significance of λk by incorporating a dichotomous variable that identifies individuals who assign little importance to interpersonal comparisons, which can be interpreted as having low preferences for status. If socio-cultural visibility is related to interpersonal comparisons and the search for status, a negative coefficient (λk < 0) would be expected. In addition, the absolute value of this coefficient should be greater for those categories of goods that occupy higher positions in the visibility ranking. In a second test, we analyze the statistical significance of alternative operationalizations of the direction of comparisons. In this case, for each category of goods, pk should be significantly different from zero. In this case, there is no a priori expected sign.
While the model’s predictive capacity may be enhanced, it is important to note that measurement error and endogeneity biases may persist. This is because the factors that explain visibility could also determine preferences for status, even after controlling for personality traits. Although we lack a proper instrumental variable to address these concerns, we carried out a set of robustness checks substituting variables from wave 4 an indicator that was equal to 1 if the individual responded that she compared herself to others in waves 3 and 4, based on the direction of the comparisons question. As they were not available in wave 3, we were not able to carry out the same test for the personality traits variables.
IV. The visibility of goods: descriptive statistics and main determinants
We first display some general descriptive statistics showing the main features of the visibility index (Section 5.1). Following this, we present the econometric analysis (Section 5.2).
A. Descriptive analysis
Table 3 shows V I averages disaggregated by the variables of interest in this paper. We also carry out the same analysis grouping the 31 categories of goods into three groups according to their visibility index (low, intermediate, and high). Visibility levels in the US are higher than those we obtained for Uruguay.11 Differences can also arise from the fact that ELBU interviewees were mainly women, although the subjects of reference (who were around 18 years at the time of the fourth wave fieldwork and 51% were males) were also asked to respond the visibility questionnaire and differences in V I by gender were negligible (Leites et al., 2019).
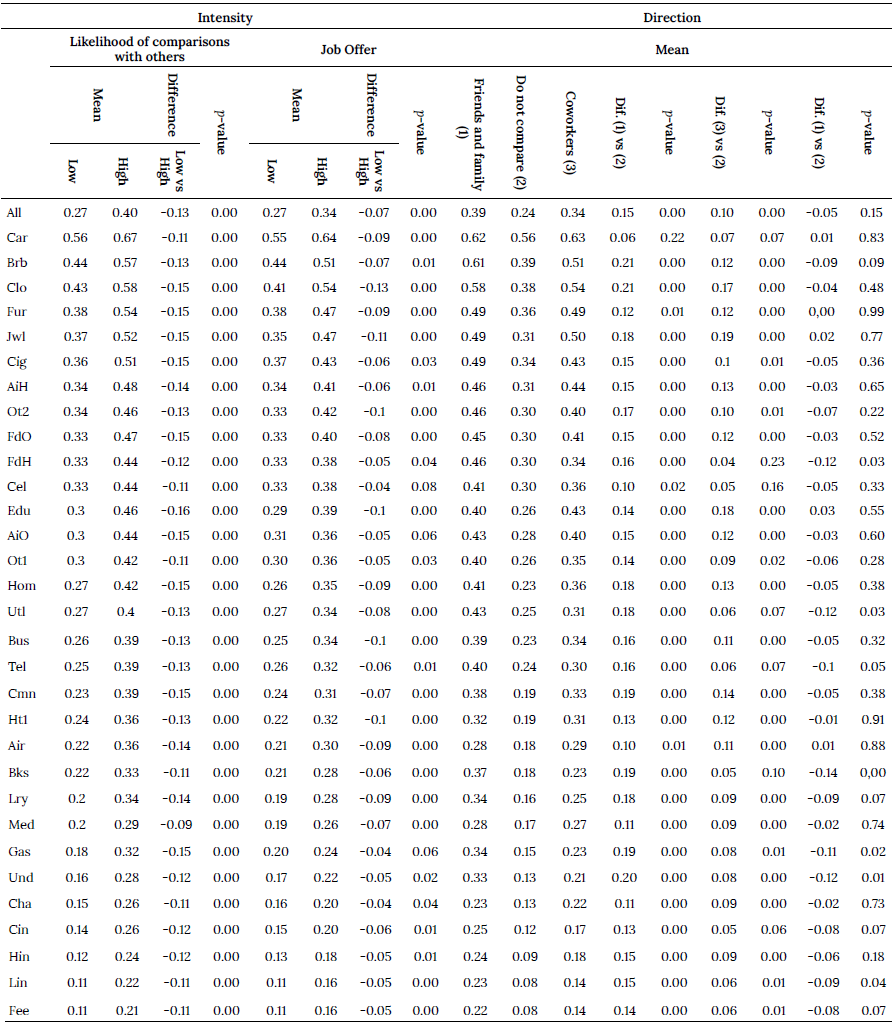
Expenditure visibility is very similar across socio-economic categories, such as income and education. However, there is a clear association regarding ethnic-racial ancestry, with higher levels of visibility responses in the Afro-Uruguayan population. Preferences for status also show a significant correlation. For instance, visibility levels are higher among those who declare that they compare themselves with family and friends or colleagues, and among those who report a greater intensity of comparisons (under the two alternatives considered). These results suggest that there is an association between relative concern and expenditure visibility that will be reexamined in the econometric analysis. Finally, we classified each BFI dimension in low or high, according to the score obtained by the respondent relative to the respective median. No statistically significant differences were found in any of the cases.12
Table 3. Visibility Index by Demographic and Socio-economic Variables, and Preferences for Status
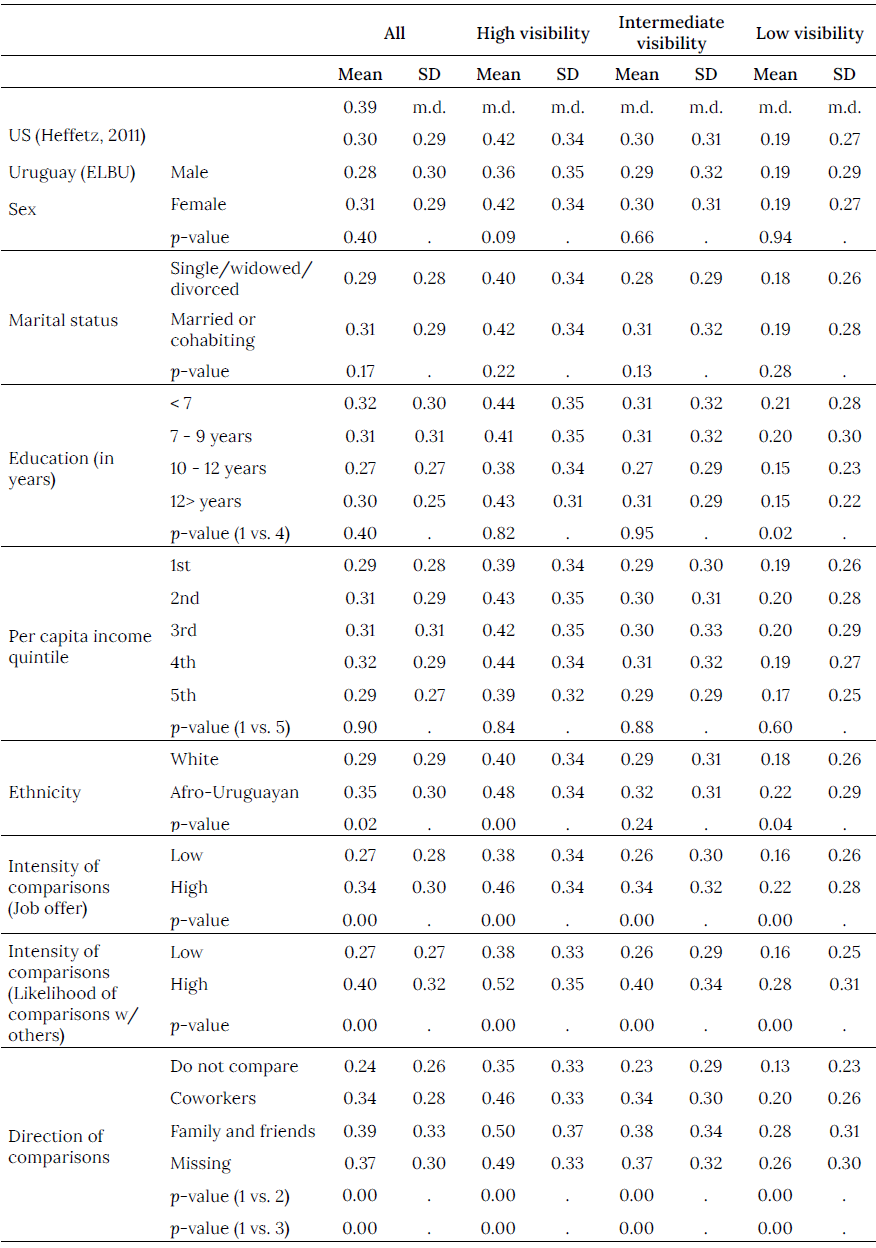
NoteThis table depicts visibility index averages and standard deviations disaggregated by socioeconomic, demographic, personality traits and preferences for status variables. The 31 items included in the scale were grouped into three categories (low, intermediate, and high) according to their visibility. The high visibility group includes the first 11 items in the ranking, the intermediate visibility group includes items in positions 12 to 21, the low visibility group includes items in positions 22 to 31.
Source: Authors, based on ELBU.
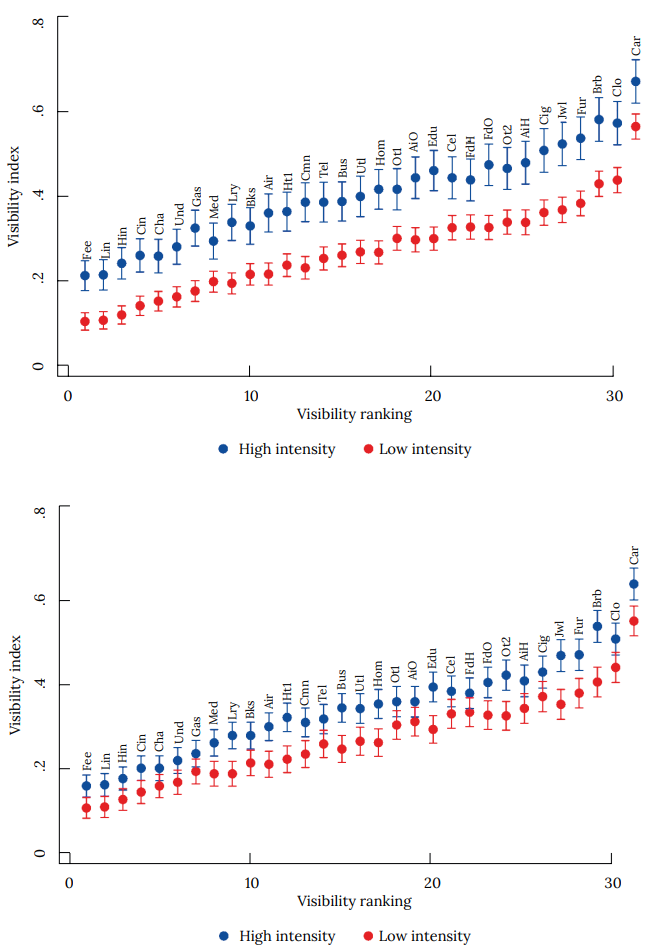
Consistently with Table 3, Figure A1 depicts a positive association between individual preferences for status, the direction of comparisons and the visibility index. Although individuals with a greater preference for status rank similarly for the 31 categories of goods, in general, they report higher scores.13 This descriptive analysis suggests that those survey respondents who consider interpersonal comparisons to be relevant, or who report a comparison group tend to more quickly identify whether a person like them increases their consumption of any of the 31 goods. This result might be consistent with the hypothesis that Heffetz index reflects the socio-cultural visibility of consumption. We return to these points in the econometric analysis.
B. Determinants of the aggregate expenditure visibility index
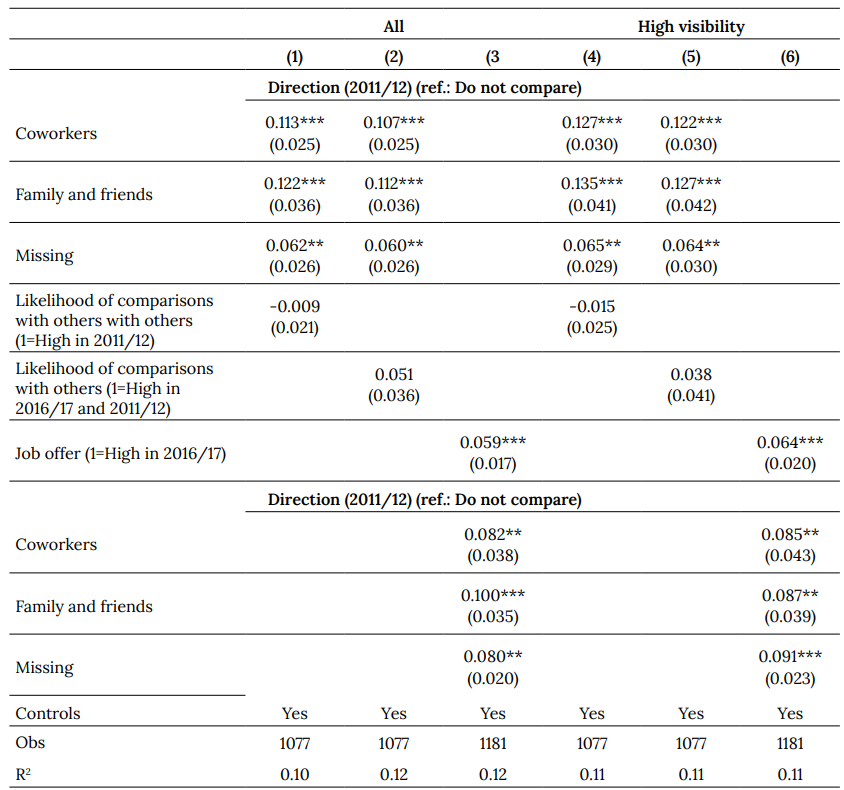
Our econometric analysis is based on the 1,181 observations with no missing information for all the variables of interest. We run OLS regressions on the aggregate visibility index (V I). Results are presented in Table 4, columns 1 to 5. We also built three groups of goods according to their visibility index value: high (first 11 items in the ranking), intermediate (positions 12 to 21), and low visibility (positions 22 to 31). Results for the high visibility group are presented in Table 4.14
Econometric estimations confirm the hints provided by the descriptive analysis. At the individual level, household size, labor force status, and living in the capital city (Montevideo) were the variables with a higher and statistically significant positive association to expenditure visibility. The latter result is consistent with previous findings indicating that in large urban centers, status concerns are higher.15
Regarding the BFI dimensions, we find that after controlling for preferences for status variables, conscientiousness is positively and significantly associated with the aggregate visibility indicator. However, the economic relevance of this effect is relatively small. For example, when compared to household size, the effect of adding a new member is equivalent to a 7-point increase in the conscientiousness score. Similarly, ceasing to be unemployed is equivalent to a rise of 18 points in the conscientiousness score (40% of the entire range of this variable). When we restrict the analysis to the subset of high visibility goods, the magnitude of this effect is slightly higher, but neuroticism and openness to experience also yield positive but imprecise effects. These results are different from the ones obtained for the overall index. In the case of openness to experience, this might reflect that, on average, these individuals are more open and receptive to new aesthetic, cultural, and intellectual experiences. They are also more curious, imaginative, and open to broader-ranging interests. Meanwhile, neuroticism has been interpreted as a symptom of emotional instability and a propensity for psychological disorder. It has been related to other social preferences, such as decreased interpersonal trust, negative reciprocity, greater risk aversion, and higher positionality concern (Almlund et al., 2011).
It is worth noting that incorporating preferences for status in the regression model enhances the statistical significance and increases coefficient size. In turn, agreeableness and extraversion do not exhibit statistical significance across specifications. Interestingly, despite the inclusion of this set of variables, the predictive power of the regression remains almost unchanged (Adj. R2 = 0.07 and 0.08).
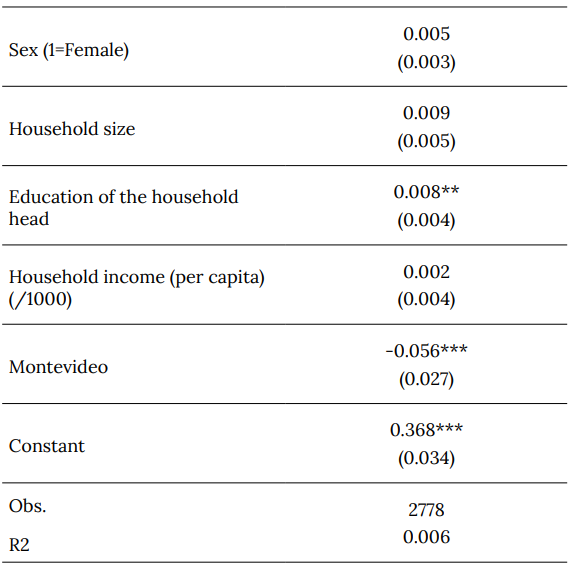
Table 4. Extended model. Estimated Coefficients. Aggregate Visibility Index
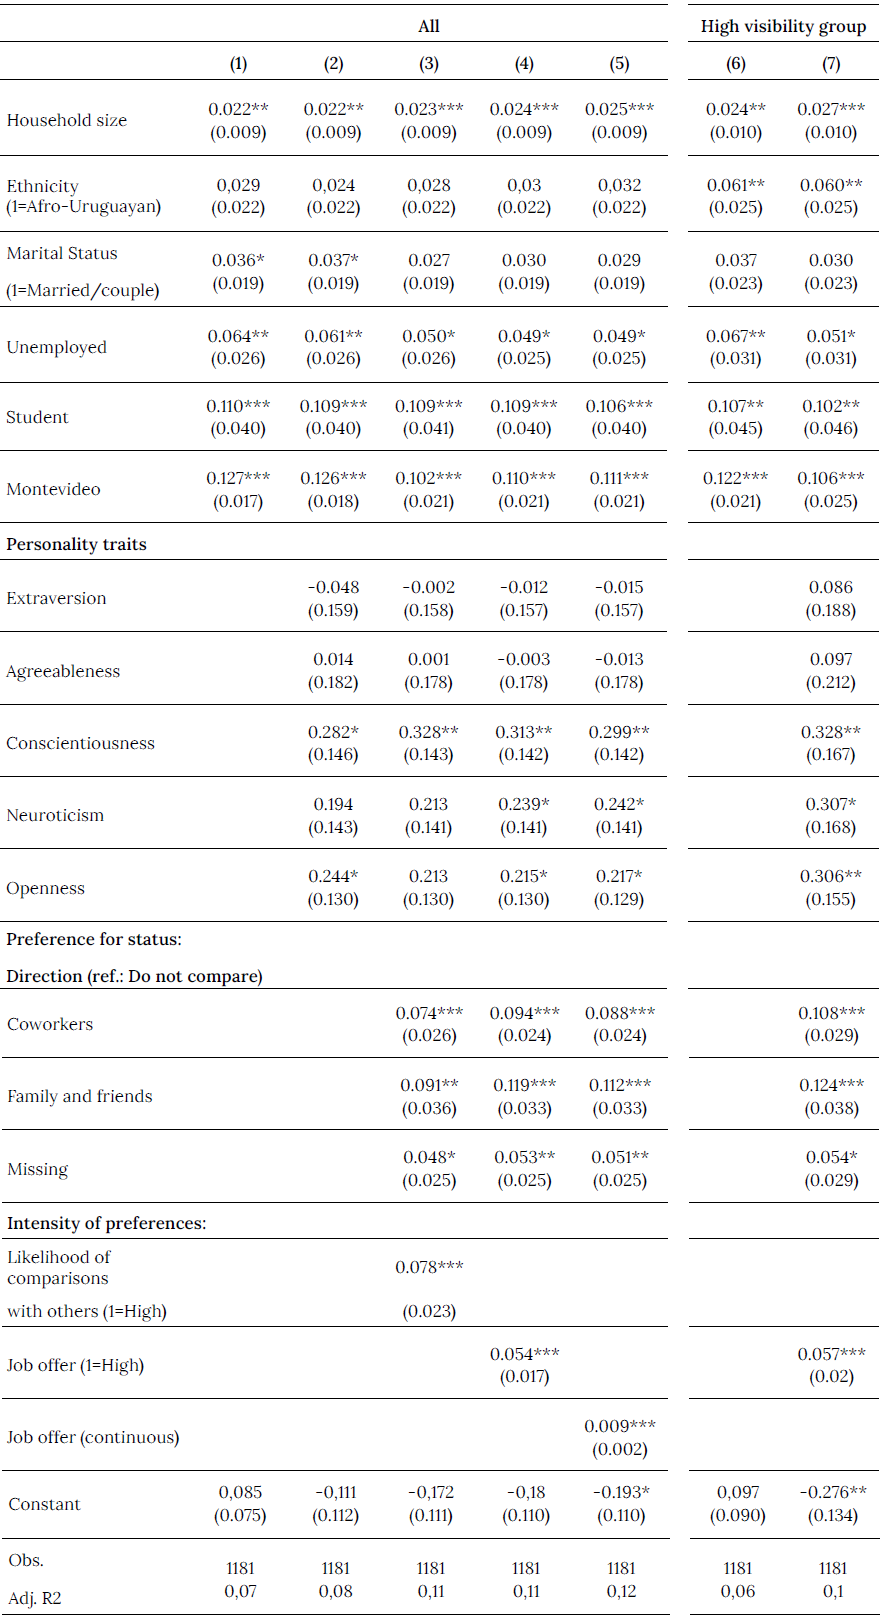
NoteThis table depicts OLS estimates for five model specifications. In columns 1 to 5, the dependent variable is the aggregate visibility index (V I). In columns 6 and 7 the visibility index is computed for the subgroup of high visibility goods (first 11 items in the ranking). Other control variables included in the estimation whose coefficients were not statistically significant in any specification were age, sex, presence of children, years of education, income quintile (four binary variables), employed, and retired.
Standard errors in parentheses.
*p<0.1
**p<0.05
***p<0.01
Source: Authors, based on ELBU.
In line with previous findings from the experimental literature, our analysis reveals a positive association between expenditure visibility and intensity of interpersonal comparisons for the three variables under consideration. Regarding the direction of comparisons, we confirm that those respondents who report comparing themselves with others (coworkers, family, or friends) exhibit positive and significant coefficients compared to those who report not comparing themselves with any of the aforementioned groups. However, it is noteworthy that the coefficients are very similar across the two groups.16
The coefficients of the preferences for status variables maintain their magnitude and significance across specifications. This suggests that both the intensity and direction of comparisons seem to be two relevant and complementary aspects in comprehending expenditure visibility. These findings imply that the visibility being measured transcends mere objective observability.
It is worth noting that including preferences for status significantly improves the predictive capacity of the model (Adj. R2 rises to 0.12), while not substantially affecting the remaining coefficients. These effects are greater than those associated to personality traits. Notably, in specification (5), a one standard deviation increase in the intensity of comparisons corresponds to a 12% increase in expenditure visibility, with a similar outcome for the direction of comparisons (10 and 11% respectively). In contrast, a one standard deviation increase in conscientiousness leads to approximately a 5 to 6% standard deviation increase in V I. When focusing the analysis solely on high visibility goods, the effects remain very similar, although the coefficients increase notably for the intensity of comparisons and the reference group of coworkers.
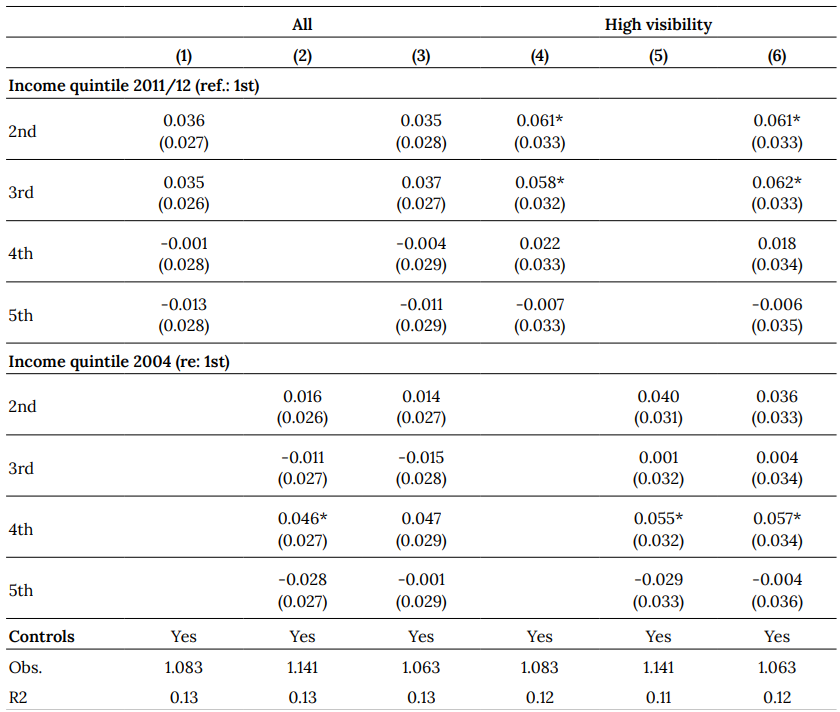
To conclude this subsection, we carried out a set of robustness checks substituting contemporary variables by their lagged values in previous waves. We first replaced present by past income quintiles (of 2011/12 and 2004), controlling for the same covariates included in the specification of Column 4 in Table 4. Table A7 of the Annex depicts the corresponding regression outputs for the aggregate visibility index (columns 1 to 3) and the subset of high visibility goods (columns 4 to 6). Results were consistent across these specifications, with the coefficients for the lagged value of income quintiles not being statistically significant.
Secondly, the variables reflecting preferences for status were substituted by their lagged values or a transformation, maintaining the covariables included in Column 4, Table 4. Table A8 in the Annex depicts the estimated coefficients for the variables of interest. Alternatively, we include the lagged value of the “Likelihood of comparisons with others” variable (Cols. 1 and 4) and a binary variable identifying those individuals responding that they compare themselves to others both in 2011/12 and 2016/17 (Cols. 2 and 5). Results were similar across these specifications, although the intensity of comparisons coefficients were not statistically significant. We finally substituted the current direction of comparisons by their lagged value (Cols. 3 and 6), and results remained unchanged, in terms of magnitude and statistical significance. Although we cannot rule out an endogeneity problem, these tests reinforce our conclusion that preferences for status positively affect the visibility of goods. We also carried out separate estimations for each BFI component divided into two sub-samples restricted to responses below and above the specific dimension’s median score. Similar results were found in all cases.17
V. Final remarks
In this research, we identified a set of visible goods for Uruguay, computed an aggregate visibility ranking and assessed its variability by population sub-groups using a rich set of covariates. Regarding the ranking of the different categories of goods, our results very much resemble previous findings for South Africa and the United States, suggesting that Heffetz (2012) survey instrument can be used in different cultural and socioeconomic contexts.
In terms of demographic and sociocultural heterogeneity, we identified no substantial differences in aggregate visibility levels or in the ranking for the 31 goods according to demographic variables or socio-economic status. These findings indicate high homogeneity levels in visibility valuations in Uruguay, a fact that might be related to emulative phenomena à la Veblen or Duesenberry, either within or between countries. In the case of racial ethnic ancestry, being Afro-descendant is associated with higher levels of expenditure visibility of goods within the group of high visibility goods.
In contrast to previous studies, our results suggest that the degree of visibility is associated with personality traits and the direction of the comparisons (who are the people whose consumption is observed). Regarding personality traits, in line with the previous literature, we found a positive and significant association between conscientiousness and visibility for all goods categories. Meanwhile, in the case of openness to experience and neuroticism, a similar relationship is identified for the subset of high visibility goods. These effects are independent from the ones related to interpersonal comparisons and could indicate a limitation of the visibility instrument, since some answers might also be reflecting personal characteristics not directly linked to positionality.
In addition to the above, a remarkable correlation was found regarding preferences for status: individuals with a higher propensity to compare themselves with others perceive visible goods expenditure more quickly, even after controlling for personality traits. At the same time, visibility levels vary for individuals with different reference groups (direction of comparisons). This finding opens up new research questions on how individuals choose their reference groups and which are the best ways to capture this information.
Even when potential endogeneity problems might be at play, preferences for status seem to have a greater impact on expenditure visibility than personality traits. In fact, one standard deviation increase in positional concern constitutes approximately a 10-12% standard deviation increase in the visibility of goods, whereas personality traits account for only half of this (5-6%).
While this investigation focused on assessing expenditure visibility, the aspect of positionality was not directly observed. Further research is needed to better understand the reasons underlying the higher visibility scores given to all goods categories by the group of individuals with a higher level of positional concern. Additionally, our findings raise questions regarding the relationship between visibility and positionality, suggesting the potential need for novel survey instruments and scales not strictly based on visibility.
At the same time, further exploration is needed to understand the connections among visibility, positionality, and status concern. These aspects are particularly relevant for less developed countries and those contexts in which institutions are weaker. In these cases, the pursuit of status could profoundly impact the distribution of economic results, consumption patterns, and aggregate efficiency (Weiss and Fershtman, 1998).
Finally, another area for further research involves investigating the relationship between our findings and actual consumption patterns. Providing evidence on this point requires the incorporation of visibility and positional scales into household expenditure surveys. The two existing studies that integrate this information for the United States, demonstrate that the socio-cultural visibility of goods is associated to substantial heterogeneity levels in household expenditure patterns (Maurer and Meier, 2008; Heffetz, 2018). To comprehensively analyze the potential policy implications of differences in expenditure visibility/ positionality levels, more research is warranted to determine whether higher valuations lead to increased consumption of visible/positional goods and a decrease in expenditures on less visible goods.