


Services on Demand
Journal
Article
 English (pdf)
 Article in xml format
 Article references
 Send this article by e-mail
Indicators
-
 Cited by SciELO
 -
 Access statistics
Related links
-
 Cited by Google
 -
 Similars in
SciELO
Similars in
SciELO -
 Similars in Google
Share

 Permalink
Cuadernos de Administración
Print version ISSN 0120-3592
Cuad. Adm. vol.20 no.34 Bogotá July/Dec. 2007
* The authors are indebted to two anonymous referees for their suggestions and comments. This paper is the result of a research carried out by Technical University of Lisbon and Pontificia Universidad Javeriana, Cali,
** Assistant Professor. Research Member of the Center of Urban and Regional Systems (CESUR), DECivil, Instituto Superior Técnico, Technical University of Lisbon; Lisbon,
*** Magíster en Geotecnia e Hidraúlica, Instituto Moscovita de Ingeniería Hidráulica y Adecuación de Tierras, Rusia, Moscú, 1990;Ingeniero hidrotécnico, Instituto Moscovita de Ingeniería Hidráulica y Adecuación de Tierras, Rusia, Moscú, 1989. Assistant Professor. Director of the Research Group in Advanced Management of Urban Water, Pontificia Universidad Javeriana; Cali,
ABSTRACT
In recent years the Colombian potable water and sewer service sector has experienced strong changes promoted by the regulating body (Comisión de Regulación de Agua Potable y Saneamiento Básico [Potable Water and Sewer System Regulation Commission]). In that sense, the regulating body has initiated a new rate structure that currently governs the sector, based on the comparative efficiency of the performance of the sector companies. Data envelop analysis (DEA) is one of the fundamental components in the model. The authors highlight that, although this methodology has been extensively used for energy regulation, its use is still very limited in the waterworks sector. This article, a product of joint research conducted by Universidad Técnica de Lisboa and Pontificia Universidad Javeriana de Cali, presents and discusses the comparative efficiency model adopted in
Key words: Economic regulation, comparative efficiency of performance,
RESUMEN
En los últimos años, el sector de agua potable y saneamiento básico colombiano ha experimentado fuertes cambios promovidos por el ente regulador (Comisión de Regulación de Agua Potable y Saneamiento Básico). En este sentido, el ente regulador ha puesto en marcha una nueva estructura tarifaria que rige el sector en la actualidad y que se basa en la eficiencia comparativa del desempeño de las empresas que participan en él. Dentro de este modelo, el análisis envolvente de datos (DEA, por sus siglas en inglés) es una de las piezas fundamentales. Se destaca que, aunque esta metodología se ha empleado extensivamente en la regulación energética, en el sector del agua es aún muy limitado su uso. Este artículo, producto de la investigación conjunta de la Universidad Técnica de Lisboa y la Pontificia Universidad Javeriana de Cali, presenta y discute el modelo de eficiencia comparativa adoptado en Colombia y concluye que, a pesar de algunos problemas cuya solución aquí se plantea, este es un paso importante hacia la calidad y excelencia del sector del agua colombiano.
Palabras clave: regulación económica, eficiencia comparativa de desempeño, Colombia, agua potable y saneamiento básico, análisis de envolvente de datos.
Introduction
Therefore, there is an incentive reorientation for the efficiency improvement of the company under analysis by means of the information extracted from other companies. The regulatory process becomes an artificial form of competition between the utilities regulated. The adoption of incentive regulation is justified in the water sector due to the high degree of “market failures” which eliminates any possibility of competition (except at the moment of a possible privatization). Moreover, generally there are a consider-able number of players that enable its use (Marques, 2006).
The Colombian YC model uses the bench-marking method of data envelopment analysis (DEA) technique as one of its main regulatory tools. DEA is based on mathematical programming techniques for assessing the relative performance of organizational units. DEA deals easily with multiple inputs and outputs and allows for the identification of a group of efficient organizations to each inefficient organization with a similar combination of inputs and outputs. However, it is not subject to statistical inference and it is very sensitive to the presence of outliers, namely if they are efficient.
This document, which is the result of a research project conducted by two universities (Technical University of Lisbon and Pontificia Universidad Javeriana, Cali), discusses the Colombian regulatory model of the water sector. It begins with a brief description of the reforms carried out. It then presents the major reasons that justify water and sewerage services (WSS) regulation and introduces the DEA method. Next, it describes and analyses the regulatory process adopted in
1. The Colombian Water Sector
The Colombian urban water sector is characterized by being completely decentralized, with municipal governments (a total of 1.091) legally responsible for supplies throughout their geographical jurisdiction, in both urban and rural areas.
It is estimated that there are more than 1.500 providers of water and sewerage services (WSS)in urban areas, and more than 12.000 community organizations in rural areas. In spite of this, 70% of the urban population, and 55% of the total population of the country are served by 40 companies, which comprise a total of 90 municipalities. There are a few companies with regional coverage, in other words, they serve more than one municipality. Nearly all of them are public entities and between them they encompass about 70 municipalities. At April 2004, a little more than 90 municipal administrations had placed their supply in the hands of the private sector by means of concessions or similar types of contract (Ministerio de Desarrollo Económico de Colombia, 2002).
In the decade between 1990 and 2000 urban water coverage rose from 86,5% to 94,4%, and rural coverage from 23,7% to 38% without taking into account unconventional supply systems, or 68% including them. These figures show the good performance in the sector. If we calculate the Millennium Development Goals, taking 1990 as the reference defined by the United Nations, we find that in December 2002 these targets had been surpassed by
Despite the advances made in coverage and the considerable financial resources channeled to the sector by the country, one of the major deficiencies is found in the quality of water supplied, with related effects of mortality, especially among children. A recent survey found that 99% of the population in the 23 largest cities were receiving water of potable quality. However, in the rest of the country, almost 60% of the samples fail to pass the minimum quality standards. One of the main reasons for this is that almost a third of the smaller municipalities, although equipped with water treatment plants, do not make the necessary purchases of chlorine to disinfect water (Fernández, 2004). This, in turn, is attributable to the weak technical capacity of the smaller utilities, as well as cash flow problems that restrict the availability of resources to purchase basic production inputs. Regarding continuity of service, two thirds of households report access to a 24-hour water service.
In this way, during the 1990s, sustained efforts were made to raise water tariffs closer to cost recovery levels, raising the average domestic tariff from US$0,33 per cubic meter in 1990 to US$0,78 per cubic meter in 2001 (Fernández, 2004). Given that 88% of households in Colombia are metered, this large tariff increase led to a strong demand reaction, reducing average household consumption from 34 to 19 cubic meters per month over the same period, which implies a price elasticity of demand around –0,3 (Barbero, 2004). Moreover, water tariffs also fall within the national cross-subsidy framework. Due to significant adjustments in the cross-subsidy framework over time, price trends for specific customer groups may vary significantly from the overall average. An important consequence of rising prices has been the postponement of major investments in the expansion of water supply capacity.
The reforms which took place in the water sector in the 1990s created the Regulatory Commission for Water and Basic Sanitation Services (Comisión de Regulación de Agua Potable y Saneamiento Básico, hereafter CRA) whose functions include the sector economic regulation, particularly the definition of methodologies and tariff formulas.
2. Yardstick competition using DEA benchmarking technique
WSS have several features that require regulation. Among them there are the economies of scale and the economies of scope, the provision of essential services to the society well being and a quasi-public good, the existence of asymmetric information, the need of very high and long-lived assets, and occurrence of externalities (Marques, 2005). These market failures sometimes lead to abuses by the utilities, which then provide an inefficient service, characterized by high prices and poor quality. Thus, the presence of regulation is fundamental for the protection of the various stakeholders (customers, Government and regulated companies). The magnitude of market failures and the large number of players call for incentive regulation and for the use of benchmarking in this domain. The regulatory process in which the performance of a regulated utility is based on the performance of other utilities within the same sector is known as YC. Its main advantages are the fact that it offers strong incentives towards efficiency and innovation, either in its operation and capital costs (OPEX and CAPEX, respectively) or in its capital expenses, as well as a fair recovery of costs and remuneration of the capital invested. This process also fosters the sharing and transparency of information, which is generally asymmetrical and imperfect. Moreover, it also has several disadvantages such as the difficulties intrinsic to its working principles(minimum number of utilities, comparability requirement and verifiability), to the adopted methodology (information quality and quantity, heterogeneity, discretionary…), to the hypothesis of collusive behavior among the regulated utilities and to the kind of commitment the regulator is able to assume when confronted with the regulated utilities (Marques, 2006).
In the scope of the water sector there are usually two YC approaches (Marques, 2006). The first relies on the benchmarking used to set the operators’ prices and tariffs (hereafter called price YC). The kinds of benchmarking used are diverse, depending on the actors and on the features of the countries involved. The second approach of YC application concerns sunshine regulation, which comprises the comparison and public discussion of the operators’ performance. Sunshine regulation is very popular in the water sector, not only because it is easily applicable but also because it is better accepted by the water utilities. Several countries, such as
DEA is a technique based on mathematical programming to evaluate the productive efficiency of homogeneous units (here WSS). DEA builds the non-parametric frontier formed by the union of a group of linear segments (piece-wise surface), which include the WSS observed. The relative measurement of efficiency is achieved through the comparison of the efficiency of the WSS analyzed with that of the other WSS which remain on that frontier (best practices). From these WSS, those that use similar inputs and outputs combinations are taken as benchmarks and, simultaneously, are the targets of the WSS under analysis (peer group and best practices).
The standard DEA model, called CCR (Charnes, Cooper and Rhodes), was derived from Farrell’s work (Farrell, 1957) and was developed in 1978 assuming constant returns to scale (Charnes, Cooper, and Rhodes, 1978). In 1984, this model was extended to account for variable returns to scale (Banker, Charnes, and Cooper, 1984), originating the model known as BCC (Banker, Charnes and Cooper). The BCC model deems variable returns to scale by adding a convexity constraint ensuring that an inefficient WSS is only compared against WSS of similar size. If we compute a CCR and a BCC model DEA, we may obtain a scale efficiency measure for each WSS. Hence, the measurement of technical efficiency can be decomposed into pure technical efficiency and into scale efficiency.
The CCR and BCC models can be deduced from the total factor productivity (TFP) concept leading to the primary problem of the DEA algorithm (also called multiplier problem). Unlike the TFP, the key-idea of the DEA technique relies on the free choice that each WSS makes of the inputs and outputs weights in order to maximize efficiency, but with the restriction that no WSS can present efficiencies higher than 1. In linear programming there is the dual formulation, named, in this case, the envelopment problem. The DEA dual model constructs an approximation to the true frontier, formed by the union of linear segments (piece-wise) that minimize the inputs amount for a desired level of outputs in production. In the primary case, the choice of weight focuses on the inputs and outputs, whereas in the dual case the choice falls on the WSS. The DEA CCR dual formulation for the input-minimizing view is:
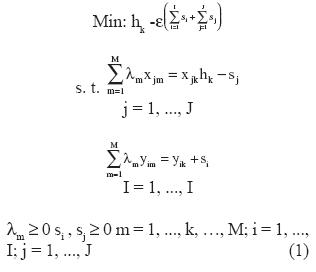
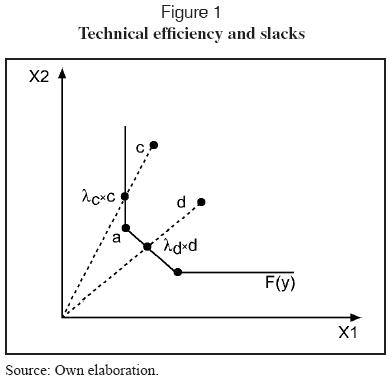
where λ are the WSS inputs and outputs weights, Si are the outputs slacks and Sj are the inputs slacks. The λm represents both the inputs and outputs proportion of the WSS m used to build the targets of WSS k under evaluation. The slacks, introduced as model variables, represent additional inefficiency sources, that is, they reflect the measure into which the inputs can be reduced after radial contractions have been done. WSS k is ef-ficient if and only if hk is equal to the unit and the slacks are equal to zero. In this case, the WSS are called best practices (peers). Considering only two inputs (X1 and X2) and one output (unitary) Figure 1 shows how the DEA model works. WSS a and b computed by formula (1) define the frontier F(y) with regard to which the efficiency of all WSS is calculated. WSS a and b are efficient (best practices) and WSS c and d are inefficient, that is, the latter can reduce their inputs producing the same quantity of outputs. WSS c by reaching the frontier can further reduce its input X2 producing the same quantity of outputs, being this amount the slack of input X2.
Other models were developed from the 1980s on (additive, multiplicative, categorical and non-discretionary variables, congestion models and others) and although the majority of them are endowed with more complexity, they sometimes enable a better and more complete description of reality to be made (see for more details about DEA technique, for instance, Cooper, Seiford, and Tone, 2000; Thanassoulis, 2001).
DEA use has several advantages, namely: (a) the identification of a group of efficient WSS to each inefficient WSS with a similar combination of inputs and outputs; (b) the ability to deal easily with multiple inputs and outputs; (c) the adoption of best practices as elements of comparison, rather than average values; (d) the non-assumption of a functional form for the frontier or for the term of inefficiency; (e) the decomposition of efficiency into several components, and(f) its conservative nature. However, the DEA technique has various problems, such as: (a) the sensitivity to the outliers, in particular the WSS onto the frontier; (b) the difficulty of measuring the associated error and testing the results and the specified models statistically, and (c) the complexity of integrating the environmental variables.
From the operational point of view, the lack of statistical results makes its practical use difficult. For instance, it is very tough for a regulator to take a decision based on DEA scores with direct effects on a company’s financial health and in the customers budget, given that the shifting of an input, sometimes only in units used (e. g. capital in quantities or in monetary units) has important consequences in efficiency values. The same happens with the sampling change (number of WSS) or with a choice of production technology (e. g. constant or variable returns to scale), which can be very troublesome to compute. Some of these problems have been minimized with the help of the bootstrap methodology (Simar and Wilson, 1998 and 2000). With regard to the identification of outliers and to the inclusion of the operational environment in the analysis, there was also relevant progress recently (see, respectively, Simar, 2003; Simar and Wilson, 2007) derived from the re-sampling (bootstrapping) procedure and from the order-m concept.
3. The Regulatory Model adopted in
CRA adopted an economic regulatory process based on an YC approach. CRA Resolution 287 of 2004 defines the criteria and the methodology to determine the Colombian WSS tariff system guided by several principles, where one of the most important is that of economic efficiency. Indeed, Article 87 of Law 142 of 1994 says that “the tariff regime will be oriented by criteria of economic efficiency, neutrality, solidarity, redistribution, financial autonomy, simplicity and transparency” and Article 92 states that “In tariff formulas, the Regulatory Commissions will assure benefits to users over time corresponding to the average reduction in cost to the water companies that provide the service; and, at the same time they will provide incentives to the water companies to be more efficient than the average, and to take advantage of the benefits resulting from more efficiency”2. The process adopted included in what is called price YC (see below) is based on a system of price caps defined for a period of five years. The maximum prices are determined according to two parts estimated separately for the water services (WS) and for the sewerage services (SS), namely a fixed part relative to average administrative costs and a variable part regarding the sum of the OPEX, the investment costs(CAPEX) and taxes. Notice that no additional parameter which encompasses extraordinary and unforeseeable situations is considered in the price cap formula. And there is no allowance for passing the cost through to users.
The average administrative costs for the WS and for the SS are the following:
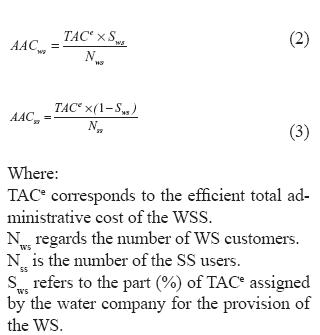
The efficient total administrative cost (TACe) will be equivalent to:
TACe =TACDEA+T (4)
T being the value of taxes per month plus other contributions included in the administrative costs (without the environmental taxes). The efficient administrative cost (TACDEA) will be obtained by:
TACDEA=AC×E (5)
In this formula, AC is the monthly average administrative cost of WSS (without taxes) to which the DEA technique is applied and E is the proportion of administrative costs taking into account the WSS efficiency that is admitted in the tariff. The value of E is obtained from the equation:
E=Min (PDEA× (1 + 0,046); 1,03) (6)
Where PDEA is the % of the operator’s relative efficiency obtained by the application of DEA.
The value of 0,046 claims to include the costs and the explanatory variables which are not accounted for in the DEA model. The value of 1,03 corresponds to the maximum value applied to the cost compared considering an efficiency of 100% and a maximum return of 3% over the capital expenses. The cost obtained will be the ceiling (cap) for the prices, while a minimum of 50% of that value will also be considered (floor).
The DEA model adopted is computed for two different groups of water companies, one for small companies with 2.500 to 25.000 costumers and another for the large companies with more than 25.000 costumers. The intention is to include the effect of economies of scale. The model adopted is of the CCR type (which achieves constant returns to scale) and it is oriented towards the minimization of inputs. It uses several non-controllable variables and adopts a procedure to simplify calculations(inversion of variables). The inputs are the administrative costs and the outputs are the number of WS customers (non-controllable), the number of SS users (non-controllable), the number of customers who have water meters installed (controllable), the number of customers in levels 1 and 2 of socio-economic classification attended to (non-controllable), the number of billing complaints decided in favor of the consumer (controllable), the density of customers per km of mains (non-controllable) and the number of attended commercial and industrial customers (non-controllable). Sample quality is controlled by minimum parameters for the WSS which are: service continuity of 80%, a level of water measurement of 70%, an efficient collection ratio of 60% and a relationship of WS customers to SS users of 50%. In order to take the outliers into account the following relationship was also observed for a confidence interval of 95%:
AC>ACaverage ±3×σAC () (7)
where σAC is the standard deviation of aver-age administrative costs.
With regard to the portion of variable cost that is determined by the sum of the three parts mentioned above, it is important to stress the way in which OPEX are calculated: they are obtained separately for the WS and the SS by means of the formulas:
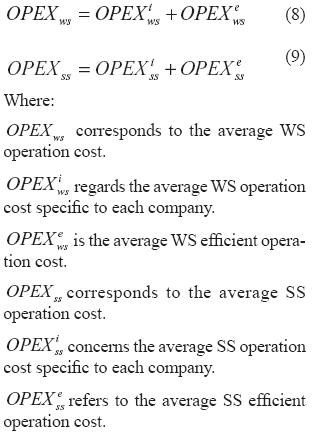
The first term of the right-hand side of formulas 8 and 9 comprises the OPEX part corresponding to energy and reagents costs that depend on each WSS and cannot be closely controlled by them. The second term refers to the remaining OPEX, more controllable by each company, and therefore determined on the basis of the performance of other WSS. The first term regarding the specific operation cost of WS is determined by the following formula (for the SS there are other equations which are not given for reasons of space):
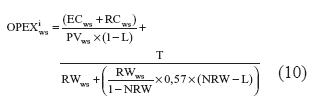
Where:
PVws is the annual water volume input to the distribution system for the base year.
RWws is the annual volume of revenue water for the base year.
L corresponds to the maximum allowable water losses level defined by CRA at 30%.
ECws relates to energy costs.
RCws concerns reagent costs.
T corresponds to the taxes associated with the OPEX.
NRW relates to the non-revenue water that is the difference between system input volume and billed authorized consumption.
If the operator buys water from other operators, an additional term will be added to formula 10. This, together with the computation procedures for energy costs, reagents and taxes are defined in CRA Resolution 287.
The average cost of efficient operation reached by comparison with other operators (benchmarking) comes from the equations given below for the WS and the SS:
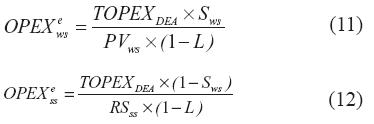
TOPEXDEA being the WSS total operation cost obtained by the DEA model, the RSss being the revenue water volume associated with the SS and the remaining parameters being as already mentioned. The efficient operation cost (TOPEXDEA) will be obtained from:
TOPEXDEA=OPEX×E (13)
where OPEX corresponds to the operation and maintenance expenses which are listed in the Article 19 of CRA Resolution 287 and the parameter E is the proportion of the OPEX that relates to WSS efficiency. The term E is obtained by the next formula where SDEA is connected with the score reached by the application of the DEA model
E=Min[SDEA×(1+0,088);1,03] (14)
As with the model for administrative costs, the value of 0,088 is intended to include specific characteristics not comprised in the DEA model. The value of 1,03 is the maximum value applied to the compared cost, considering an efficiency of 100% and a maximum return of 3% on CAPEX. The cost obtained from this will have a price ceiling, and a minimum limit of 50% of that value will also be adopted as a price floor.
The DEA model is also sorted for both groups of customers (2.500 and 25.000 and more than 25.000 customers). The model adopted is again of the CCR kind, and it draws on the idea of input minimization, although it employs a trick by using non-controllable variables. The inputs of the model adopted are the OPEX and the outputs (all non-controllable). The elements are the volume of water produced, the revenue sewerage volume, the volume of pumped water, the number of treatment plants actually used by the system (computed by a formula which takes into account scale effects) the equivalent length of mains (which includes the complexity and size of the network) and raw water quality. The procedures used are similar to those described in the administrative costs model regarding sample standardization.
The data used in the CRA-DEA model are based on standardized accounting, on management information reported by the WSS and on the elements required by the CRA. For this first regulatory period the data sup-plied considered the years 2002 and 2003.
4. Discussion of the regulatory model adopted
The Colombian regulatory process has been conducted transparently by the CRA. The tariff system for the WSS defined in Resolution 287 includes the fixed costs corresponding to the average administrative costs and the variable costs obtained by the sum of the OPEX plus the investment costs and the environmental charges by unit of consumption. The regulatory model uses the DEA method to determine the efficient administrative costs and the efficient OPEX. These costs have aroused some criticism in the Colombian regulatory process related to the drawbacks of the DEA technique mentioned above, discussed in this article.
For example, the specified models use constant returns to scale technology (CCR model). For the monopolistic and lumpy sectors the adoption of the CCR model is not the best one, at least in the short-term. The WSS usually only have flexibility to adjust their size in the long term. Under these circumstances, the BCC model would be preferred. WSS can be highly penalized when using this model, and could be wrongly seen to be inefficient. Besides, if the inefficiency decreases substantially the CCR model will raise the number of outliers according to the criteria adopted and, consequently, it will reduce the size of the sample. The trick related to the inversion of the model is correct from a theoretical point of view, but increases the complexity and the meaning of the model’s results.
From a different perspective, the number of variables is very large. So, rather than considering the non-controllable variables in the model, it would be better to employ a second stage and apply the Tobit regression, which is very easy to implement. Another and, more robust alternative (the Tobit regression produces biased results), consists of applying a second stage considering the bootstrap technique, even though this is more complex (see Simar and Wilson, 2007). It also appears that there is some kind of undesirable overlap between some of the variables.
Concerning the OPEX model, the variable related to energy (as well as reagent costs) should be modeled separately and not included in the DEA model. As the energy efficiency questions are very relevant, representing a significant part of the total cost, the energy variable is not easily controllable and therefore should be taken out of the model. Even then, the energy cost should be regulated by incentives, for instance by con-trolling the performance indicator of standardized energy consumption measured by the ratio between annual energy consumption in pumping and the sum of the volume per pump head in hundreds of meters. The reference value of this performance indicator, which represents the average amount of energy consumed per m3 at a pump head of 100 m, is between 0,35 and 0,45 kWh/m3 at 100 meters.
The variable length of mains is also relevant, and if the aim is just to analyze the OPEX (as in
Water losses are a very significant factor to be taken into account. The average loss is around 50% of system input volume. The output to be considered should be the revenue water volume rather than the produced water volume. Water losses can also be taken as an explanatory factor. Other hypotheses for the water losses inclusion can be to consider this factor as an undesirable variable (see, e.g. Seiford and Zhu, 2002). At all events, the authors think that the basic model should consider as output the revenue water volume and the water losses should be analyzed separately, regardless of the use of DEA techniques. Its relation to the tariff system should only aim to provide rewards or penalties to the best or worst performances (carrot and stick). In that case, for example, water losses can have a direct relationship with the rate of return of the operators. The reduction in water losses is linked to the investments made, which influence OPEX as well as CAPEX. The mixture and transference between CAPEX and OPEX is another pertinent issue. OPEX cannot be analyzed independently from CAPEX. In the latter, the investment levels should be carefully supervised to avoid transference of costs between CAPEX and OPEX(and in this case between CAPEX and administrative costs) and also “gold plate” practices.
The presence of outliers is a very important issue as well. Although this matter is carefully taken into account by the CRA, the authors would try to split the sample according to its size into several clusters. The DEA technique would then be applied, followed by an analysis of the efficient peers and a sensitivity analysis. If doubts arise or there were questions from the operators about the quality of the model, the statistical inference (bootstrap methodology) would be applied. It should be noticed that in addition to the recent method referring to identify outliers (Simar, 2003) there are other techniques available. Some of them very prompt, such as the peer count index, the superefficiency, the peer index and the Wilson method (see, e. g., Torgersen, Førsund, and Kittelsen, 1996).
Finally, note that, at the beginning of the regulatory process, operators do not have the same development level, and that the splitting of the population classes (2.500 and 25.000 and >25.000 customers) should be analyzed in terms of the outcomes obtained.
Concerning the administrative costs, and under the principle that two separate models were used, a model with one input and two outputs (one corresponding to the fixed portion of administrative costs and another to the variable part of OPEX)would be applied, that is, the administrative costs and the number of water and wastewater customers. The other variables would be considered as non-explanatory in a second stage. For the OPEX base model, the OPEX would be used as input and the water and wastewater revenue volumes, the number of customers and the mains length would be the outputs. The various explanatory factors mentioned would also be employed, including the water catchment quality(or the degree of treatment).
It should be noted that in DEA application, as in performance measurement in general, it is better to perform complex analyses of simple models than simple analyses of complex models.
Conclusions
This article analyzed the regulation of the WSS in
The Colombian regulator adopted an ambitious regulatory model based on an YC approach. The YC model consists of the regulation of an operator, based on the performance evaluation of the other operators from the same sector. The advantages of using YC are undisputable as proved by empirical cases in progress worldwide. The regulatory process has also applied the principles of transparency and neutrality and there are benefits from a sound institutional and regulatory framework, appropriate to the realities of the sector and
The Colombian YC model uses DEA bench-marking as its main regulatory tool. The benefits of employing this technique are also unquestionable. The role of benchmarking in the water sector is fundamental due to its particular features and so the DEA technique is one of the most effective tools for regulatory benchmarking although it also presents some problems.
Some comments and suggestions regarding the model adopted by the Colombian regulator are provided throughout the article, focused especially on the weaknesses of the use of DEA benchmarking technique which, although it has some imperfections and is criticized in many aspects, it is undoubtedly an important step forward towards quality and excellence in
Footnotes
1. On April 1, 2006, the Office of Water Services (Ofwat) was replaced by the Water Services Regulation Authority (Ofwat).
2. Articles translated by the authors.
List of References
1. Agrell, P., Bogetoft, P. and Tind, J.(2005). Dynamic DEA and yardstick regulation in Scandinavian electricity distribution. Journal of Productivity Analysis, 23 (2), 173-201. [ Links ]
2. Banker, R., Charnes A. and Cooper, W. (1984). Some models for estimating technical and scale inefficiencies in data envelopment analysis. Management Science, 30 (9), 1078-1092. [ Links ]
3. Barbero, J. (2004).
4. Charnes, A., Cooper W. and Rhodes E.(1978). Measuring the efficiency of decision making units. European Journal of Operational Research, 2 (6), 429-444. [ Links ]
5. Cooper, W., Seiford, L. and Tone, K. (2000). Data envelopment analysis: A comprehensive text with models, applications, references and DEA-solver software. Boston: Kluwer Academic Publishers. [ Links ]
6. Farrell, M. (1957). The measurement of productive efficiency. Journal of the Royal Statistical Society, 120A (3), 353-290. [ Links ]
7. Fernández, D. (2004). Colombia: desarrollo económico reciente en infraestructura balanceando las necesidades sociales y productivas de infraestructura. Informes de Base Sector Agua Potable. Washington: World Bank. [ Links ]
8. Jamasb, T. and Pollitt, M. (2001). Benchmarking and regulation: international electricity experi-ence. Utilities Policy, 9 (3), 107-130. [ Links ]
9. Marques, R. (2005). A regulação de serviços públicos. Lisbon: Edições Sílabo. [ Links ]
10. Performance benchmarking in water and sewerage services regulation: Principles and experiences. (2006). Water Utility Management International, 1 (2), 16-21. [ Links ]
11. Monteiro, A. (2004). Benchmarking the economic performance of Portuguese water and sewerage services. Proceedings of the 4th International Symposium of DEA (pp. 65-72), Birmingham: Aston University. [ Links ]
12. Ministerio de Desarrollo Económico de Colombia (2002). Balance sectorial. En Sector del agua potable y saneamiento básico: retos y resultados (pp. 30-35). Bogotá. [ Links ]
13. Seiford, L. and Zhu, J.(2002). Modeling undesirable factors in efficiency evaluation. European Journal of Operational Research, 142 (1), 16-20. [ Links ]
14. Shleifer, A. (1985). A theory of yardstick com-petition. Rand Journal of Economics, 6 (3), 319-327. [ Links ]
15. Simar, L.(2003). Detecting outliers in frontier models: A simple approach. Journal of Productivity Analysis, 20 (3), 391-424. [ Links ]
16. Wilson, P. (1998). Sensitivity analysis of efficiency scores: how to bootstrap in non-parametric models. Management Science, 44 (1), 46-61. [ Links ]
17. Simar, L. (2000). Statistical inference in non-parametric frontier models: The state of the art. Journal of Productivity Analysis, 13 (1), 49-78. [ Links ]
18. Estimation and inference in two-stage, semi-parametric models of production processes. (2007). Journal of Econometrics, 136 (1), 31-64. [ Links ]
19. Thanassoulis, E. (2001). Introduction to the theory and application of data envelopment analysis: A foundation text with integrated software. Boston: Kluwer Academic Publishers. [ Links ]
20. Torgersen, A., Førsund. F. and Kittelsen, S. (1996). Slack-adjusted efficiency measures and ranking of efficient units. Journal of Productivity Analysis, 7 (4), 379-398. [ Links ]

