


Services on Demand
Journal
Article
 English (pdf)
 Article in xml format
 Article references
 Send this article by e-mail
Indicators
-
 Cited by SciELO
 -
 Access statistics
Related links
-
 Cited by Google
 -
 Similars in
SciELO
Similars in
SciELO -
 Similars in Google
Share

 Permalink
Cuadernos de Administración
Print version ISSN 0120-3592
Cuad. Adm. vol.22 no.38 Bogotá Jan./June 2009
* This article is part of the research Determinants of School Performance in Secondary Schools in Antioquia, sponsored by the Comité para el Desarrollo de la Investigación (CODI), Universidad de Antioquia, Medellín, Colombia, and carried out by the Microeconomics Applied Group, between March 2006 and August 2006 (acta E01085). We really thank the collaboration of Walter Díaz, Germán Valencia, and Liz Jeanneth Londoño. The article was received on 2902-2008 and was accepted for publication on 16-06-2009.
** Magíster en Economía, Universidad de Chile, Santiago, Chile, 1999; Economista, Universidad de Antioquia, Medellín, Colombia, 1996. Director of Applied Microeconomics Group and Associated Professor of Economics, University of Antioquia. Medellín, Colombia. E-mail: davidtobon@udea.edu.co.
*** Magíster en Economía, Universidad de Antioquia, Medellín, Colombia, 2008; Economista, Universidad de Antioquia, 2005. Auxiliar professor, Faculty of Economic Sciences, University of Antioquia. Medellín, Colombia. E-mail: hmposada@economicas.udea.edu.co.
**** Economista, Universidad de Antioquia, Medellín, Colombia, 2004. Researcher of Applied Microeconomics Group, Centro de Investigación y Consultorías, Universidad de Antioquia. Medellín, Colombia. E-mail: riospaul@gmail.com.
ABSTRACT
This paper analyses how the institutional processes, the school management as well as the contexts in which the school and the students are circumscribed, could impact the performance in the high-school graduation-year test (ICFES). A survey was applied with the purpose of know the actions and interactions among educative process actors. Factor Analysis and Hierarchical econometric models were used with the purpose of construct indexes and measure the impact of the considered variables. We found that school level variables, including management, explain a high percentage of the performance variability, while those constructed variables associated to student's characteristics have a low impact. And parent human capital and the initial student conditions are much more important than the teacher human capital. Contrary to the expected, it's not clear what kind of use and if to increase infrastructure resources favors the achievement.
Key words: Quality education, institutionally, school management, factor model, hierarchical model.
RESUMEN
Este documento analiza la manera en que los procesos institucionales, la dirección de los colegios y las circunstancias del colegio y de sus estudiantes pueden afectar el rendimiento en la prueba del ICFES en el grado 11. Se aplicó un cuestionario que verifica las acciones e interacciones entre los actores que participan en el proceso educativo. Se utilizaron modelos de análisis factorial y modelos econométricos y jerárquicos para construir los índices y medir el impacto de los variables considerados. Se encontró que las variables de niveles de los colegios, incluida su administración, explican un alto porcentaje de la variabilidad en el rendimiento, mientras las variables construidas en asociación con las características del estudiante tienen un impacto bajo. El capital humano de los padres de familia y las condiciones iniciales del estudiante son mucho más importantes que el capital humano de los docentes. Contrario a lo esperado, no hay claridad sobre qué tipos de uso o de aumento de recursos de infraestructura podrían mejorar el rendimiento.
Palabras clave: educación de calidad, institucionalidad, administración de colegios, modelo factorial, modelo jerárquico.
RESUMO
Este estudo analisa como os processos institucionais, a administração escolar, e assim também os contextos onde o colégio e os estudantes estão circunscritos, podem impactar a realização na prova anual de segundo grau (ICFES). Aplicou-se um estudo com o propósito de conhecer as ações e interações entre os atores do processo educativo. Utilizaram-se Fatores de Análise e modelos de econometria Hierárquica com o propósito de construir índices e medir o impacto das variáveis consideradas. Encontramos que o nível das variáveis escolares, incluindo a administração, explicam uma alta percentagem da variabilidade de realização, enquanto que aquelas variáveis construídas associadas às características do estudante têm um baixo impacto. E é muito mais importante o capital humano dos pais e as condições iniciais do estudante que o capital humano do professor. Ao contrário do que se espera, não está esclarecido que tipo de utilização, e se é necessário aumentar os recursos de infra-estrutura que favorecem a realização.
Palavras chave: educação de qualidade, institucionalidade, administração escolar, modelo de fator, modelo hierárquico.
Introduction
This research analyzes the determinants of school performance in the last year of secondary school students, measured by the results of the State knowledge and aptitude test administered by the higher education authority (ICFES). The study contemplates the main variables that economic literature recognizes, which are: The students´ initial conditions, the infrastructure and human capital of the schools, and organizational and institutional restrictions, that is the different assets of the schools; the institutional restrictions are concerned with the way they are organized, how management and academic decisions are taken, how governing bodies interact, and the support they receive from higher levels such as mayoral programs1.
Qualitative principal components are used to quantify the qualitative variables and factorial analysis for adding variables in indexes. Later, a hierarchical model is used to observe the contribution of each variable and the variability of the performance in each level of analysis —in the student, in the context of the family and of the school. The results of the model lead to policy proposals for improving school achievements of the students of Medellin and the rest of the country.
This work is novel as it is based on a survey of 840 teachers and directors of 105 schools in Medellin, using demand revealing mechanisms, formerly developed for the problem of procurement of public goods (Clarke, 1971; Groves and Martin, 1975), but in this case aimed and teachers and directors, in an attempt to discover the interactions between them and the institutionalism of the schools, as well as their interaction with the local administration. Another objective was to discover indirectly the nutritional, affective and cognitive conditions of the students.
1. Theoretical Framework
School performance depends on a number of factors of supply and demand, among which in particular we find the school infrastructure, the students´ initial conditions, the human capital of teachers and directors, the environment inside and outside the classroom, the institutional system, and the incentives that regulate the interactions among the many actors inside and outside the schools. In Colombia it is believed that poor performance is not due to the lack of resources or lack of participation of the different social actors, but may be ascribed to institutional problems related to financing and supervision and control, bad management and a teacher incentive system which is not associated with personal performance (Wiesner, 1997; Alesina, 2001; Tobón et al., 2004).
Gaviria and Barrientos (2001) note that public investment should be emphasized in the institutions (interactions among directors, teachers and parents); Núñez, Steiner, Cadena, and Pardo (2002) recognizes the importance of a teaching career and teaching management, and Restrepo and Alviar (2004), find negative interactions between the parents´ education and achievement in the night-cy-cle, public and technical schools, with which the disadvantages of these schools increase rather than decrease as the parents education level rises. It is also found that the average achievement in Medellin and Valle de Aburrá, where the most developed municipalities in Antioquia are located, is higher than in other less developed rural regions.
Correa (2004) analyzes the ICFES test among students in Cali and finds that the significant differences in achievement are due to the distinct characteristics of schools and students. Further, the strength of the relationship between achievement and individual and family characteristics varies positively and significantly, as something that the schools could never offset Nevertheless, although everybody in Colombia recognizes the importance of providing the correct incentives and institutional adaptation, these are neither included nor quantified as variables in the estimated models.
In a Latin American perspective Mizala and Romaguera (2002) and Vegas (2002), center their analysis on the power of incentives and the importance of autonomy and the decision-making power of teachers in the performance of the Chilean students. Mizala, Romaguera and Reinaga (2004) confirm the importance of variables in the home to the achievement of the student´s goal, showing that other fundamental factors reflect the context of the country, such as the disadvantages faced by the aboriginal population, children who do not live with their parents for educational or economic reasons, and the fact that the mother helps with the children´s homework.
Scheerens (2000) and Vélez, Schielfelbein and Valenzuela (1993) stress that very few analyses include organizational factors in the schools. Scheerens (2000) points to the absence of teaching theory and pedagogy; Fuller and Clarke (1994), Scheerens (2000), and Ridell (1997) show the concentration of research in the supplying of physical, material and financial goods; Fuller and Clarke (1994), Heneveld and Craig (1996) show the importance of incorporating aspects related to the cultural context in which the school and teachers perform their activities. These authors also point out that the factors of school efficiency should not be seen as independent from each other, but, on the contrary, they condition each other and provide reciprocal feedback.
It is well known that one of the essential determinants of achievement is the family: its level of education and socioeconomic characteristics. There is perhaps more controversy on the specific effect of other factors such as the level of spending and the characteristics of teachers and schools. The pioneer work of Coleman et al. (1966) found that an increase in spending on schools does not have a significant effect on the distribution of the learning; that is to say, the differences were solely due to the differences in the social origins of the students and not to school variables. Among later works highlighting, supporting, complementing or refuting this, we find: Raymond (1968) which emphasizes the importance of salaries and incentives to teachers; Hambor, Phillips, and Votey (1973), and Glewwe and Jacoby (1994) emphasize the quality of school inputs; others place an emphasis on demand, sociocultural and family factors more than on the nature of the schools (Hambor et al., 1973; De Graaf, 1986; Sander, 1999; Sin-Kwok Wong, 1998; Ferrera, Pedraja, and Salina, 2005), or situations of violence in the school neighborhood (Grogger, 1997), or the levels of income in the area and region where the schools are (Garner and Raudenbush, 1991).
Recently, Bishop and Woessmann (2002) underline that there are school and teacher inputs which contribute to the acquisition of cognitive skills, independently of the characteristics of the family environment. Also, the student's performance in the high school tests depends, basically on student effort levels and the efficiency of state expenditure, as this expenditure determines and monitors the participation of the teachers and the quality of the teacher inputs and it is precisely the effort of such agents that establishes how efficient and well-oriented the expenditure is. Speaking of the tests, they say that they are a signal of student achievement because they allow a comparison of a student with the achievements of other classes and schools. This makes the quality of education more visible and transparent, and simplifies the monitoring of students, teachers and schools, and easily motivates the achievement of a common target, such as the maximization of high school graduation tests.
As McMeekin (2001) indicates, the concepts of the theory of organizations should be applied, examining the role of institutions inside the schools considering that the more developed the institutional environment is the better the achievement of the students will be. But account should be taken of the fact that individual incentives are an obstacle to cooperative relationships among teachers, because competition may cause rivalry and an unhealthy environment: Therefore, it is better to stimulate an environment of trust and cooperation which ameliorates institutional relationships and so obtains better results.
Finally, Piñeros (2002) reviews a number of works and concludes that when analyzing the results of variables for each group, although those referring to school inputs are greater in number, those on school and classroom management are more consistent.
2. Econometric Application
In terms of econometric techniques, multiple linear regression, linear or logarithmic hierarchical models, and the principal component methods were used; the use of Ordinary Least Squares (OLS) has been increasingly replaced by hierarchical models, due to both statistical and conceptual advantages. Hierarchical models are a technique used mainly for the methodological needs of research on the economics of education and, in general, in phenomena with nesting, when observations are not completely independent, that is to say, they are grouped in hierarchies denoting different levels and the interest lies in researching the variation due to each one of them (Castaño et al., 2005).
Hierarchical models offer statistical and conceptual advantages in comparison to OLS traditional estimates. In the former, the model does not waste information —as it would when adding school level data— gaining more explanatory power, besides, its specification allows recognizing that information inside a hierarchy is not independent, by which the significance of the coefficients is not spurious2. In the latter, it is easy to fall into the wrong level fallacy, which is to analyze the information of one level and move the conclusions to another. In the ecological fallacy the individual level information added and interpreted, while in the atomistic fallacy the microinformation conclusions are moved to a macro level.
The main objective of each of these models is to determine the direct effect of the individual and context variables on variables of human behavior allowing, in contrast with the analysis of classical regression, to incorporate independent variables at different levels, identifying which part of the variation of the dependant variable is due to the effect of individual factors and which is due to the context. Precisely one of the main characteristics of the teaching system is due to the grouping that characterizes it. Students are grouped in classrooms which are in turn grouped in schools. It is then necessary to use a model in which the organizational relations are relations among levels, in order to observe the determinants of the achievement of the students (Browne and Rasbash, 2004).
This methodology maintains the linear and normality assumptions of the traditional estimation methods, but those of homoscedasticity and independence are adapted, specially the latter, aiming to gain accuracy in response to the nesting phenomena given in the teaching process. The adaptation is based in the fact that individuals of the same group are more alike than those of different groups. This idea can be formalized through a model of variable components: Random errors have an individual and a group component. Besides, errors are not independent of the student's characteristics, which require an adjustment. The difference between fixed and random effects allows the existence of random effects to be established and helps to show which school characteristics produce them —interrelation variables (Restrepo and Alviar, 2004).
As a consequence, the multilevel analysis substitutes the traditional approach of aggregated measures at teacher and school level, as explanatory variables in one-level regression models for estimating the effects of average variables on the student learning, which present validity problems for statistical conclusions such as: Aggregation bias, undetected regression among subunit heterogeneity, parameter bias estimations, typical errors and problems related to obtaining the assumptions of independence demanded by single-level models.
Multilevel analysis allows many more questions to be explored and answered than traditional analyses. In the case of the teaching process a multilevel analysis can: (a) Estimate the main effect of each variable; (b) simul-taneously model the different levels of the variation with which it is possible to know what proportion of the variation in school performance is due to the characteristics of each level (student or school in a two-level model), and (c) allow the performance level and the strength of its relationship with the factors to vary freely in the different levels of addition (Llach, Montoya and Roldán, 1999).
Finally, it must be appreciated that this model cannot be considered as the solution to all the problems research in the social sciences, as it still rests in the assumption of normality and linearity; but it is a great step forward in solving problems of aggregation and disaggregation, as they are correct statistics and do not waste information (Bryk and Raudenbush, 1992).
3. Application
The statistical analysis of the determinants of Medellin student academic achievement is mainly centered in the quantification of the qualitative variables, its aggregation by indexes and the correct managing of the data hierarchical structure, but first we describe the data used.
3.1 General
One of the main purposes of this work is to observe the influence of institutional factors on student achievement. Surveys were required to do this. Although the results of the achievements analyzed correspond to the second semester of 2003, the use of 2005 information can be supported because ICFES
(i.e. the administrator of the test), changed its format from 2004. Besides, the quality of the educational systems changes quite slowly over time, mainly because its institutional and the human and infrastructure resources do not change in the short term.
We have two levels of information: Students and school. The sample contains 105 schools, 45 private and 60 public, 6 for boys, 15 for girls, and 84 mixed; most of the single-sex schools were private and denominational. A sample of 8,345 students was obtained, 49.5% girls and 50.5% boys3.
Student information consists of: ICFES test score4, gender, age, whether the student worked, and other variables describing personal and family socio-cultural characteristics and family (home owned/rented, family income, social segment, parents´ education level and occupation, number of people contributing to the household expenses, siblings´ schooling, chronological position of the student among siblings).
School level information was built up from our survey, with questions on different aspects affecting the academic achievement of the students from point of view of the teachers and directors; the teachers were asked about their environment and incentive structure and about student and parent characteristics and commitment. The survey of directors captured information about their commitment and the school as an institution. We also checked the school resources and infrastructure database at the Medellin Education Secretary Office.
3.2 Qualitative Data and Index
The construction of the index by factorial analysis, which consists of representing a group of variables in terms of another group of non-observable variables of minor dimensionality, and which are tightly related to each other, is not directly applied to qualitative variables, like most of the variables from our survey. Then the qualitative principal components method was used, since it allows both category variable quantification and data dimension reduction. Data are quantified in such a way that correlations among all interest variables are maximized, and variance and covariance matrix range on transformed data are diminished, maintaining, obviously, the nature of data. The methodology was first applied on the group of variables built up from the teachers' survey, then on the variables of the directors' survey. The Level 1 variables were not quantified because the number of variables was not large and most of them were numerical or in dichotomy, and in the context of hierarchical models they are completely manageable and interpretable; this does not apply to variables associated with parent human capital, as they include qualitative information, and index construction is susceptible to such variables. As the Level 2 variable number is very large and aims to improve interpretation and establish more clear relationships, its number was reduced through indexes using the factorial analysis methodology.
In the factorial analysis, the focus of interest is the explanation of the covariance structure or correlations among the variables considered, and the main objective is to determine whether subgroups of M elements can be built in P variables such that the variables inside are more strongly related to each other than to others from different subgroups. Other objectives of the factorial analysis are: (1) to determine if there is a small group of non-correlated variables which explains the relationships among the original variables, (2) to determine the number of subjacent variables, (3) to interpret these new variables, (4) to evaluate the individuals or experimental units from the group of data on these new variables, and (5) to use the new variables in other statistical analyses of the data.
Aseries of statistical tests were performed to observe whether the data obtained are appropriate to a factorial process. For our case, such tests were the statistical Kaiser Meyer-Olkin and Barlett sphere test.
3.3 Index Construction from the Universidad de Antioquia Survey of Teachers in Schools in Medellin
The survey contains 27 questions and was addressed to 7 teachers in each school in the areas of teacher human capital, student characteristics, student and parent commitment, methodology implementation, the working environment, autonomy, and teacher association. As most of variables are qualitative, the principal qualitative components procedure was applied and indexes were then built up using factorial analysis which produced 6 in-dexes5: Teaching human capital, student characteristics, student and parent commitment, methodology implementation, working environment, autonomy, and teacher association. The method used in the factorial analysis was the principal axis factoring together with the varimax rotation6. Next, for obtaining a representation from each school, a simple average of each one of these indexes for the teachers of each school was built up, which were considered Level 2 variables. Table 1 shows a rotated factor matrix.
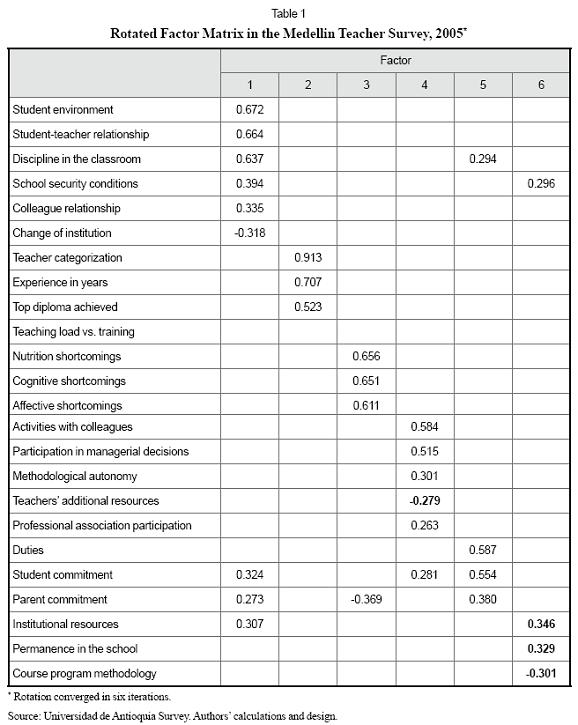
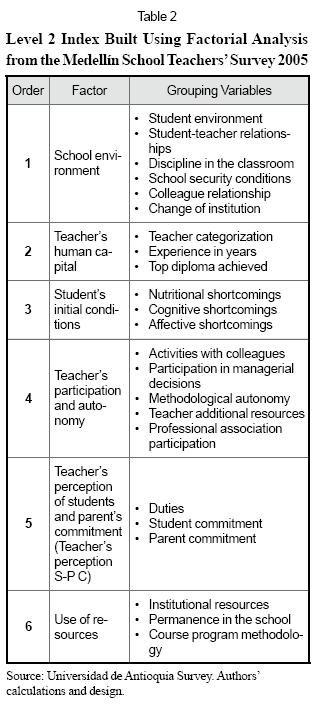
The 6 factors chosen represent the teachers´ general perception of different aspects of the school environment and were defined as indicated in Table 2.
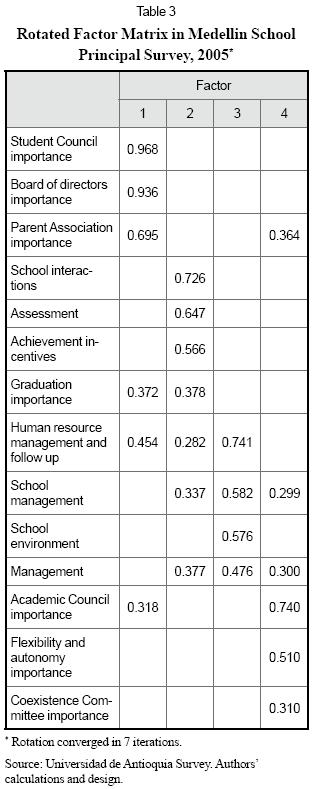
3.4 Index Construction from Universidad de Antioquia Survey of Medellin School Directors
This survey focuses more on the institutional aspects of the schools, and principal components were implemented. As the factorial analysis with all the quantified variables did not lead to clear association patterns, we decided to use only those variables describing directors´ perceptions of governability in the school, considering that in these answers there is a minor incentive to lie. The rotated factor matrix in this case is established in the Table 3.
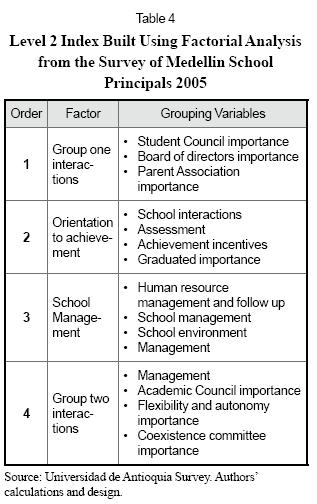
The four factors extracted at the end are defined in the Table 47:
After these quantification and construction index analysis, the first and Level 2 variable list considered is:
Level 1: ICFES test score, gender, age, if student at works, if student is the eldest sibling , whether house is owned, family income, social stratum, number of people contributing to household expenses, siblings´ schooling, chronological position of the student among siblings, number of siblings, number of members of the family group, school fees, parents´ human capital.
Level 2: School environment, teachers' human capital, student condition, teacher participation and autonomy, perception of commitment, use of resources, group 1 interaction, orientation to achievement, school management, group 2 interaction. In addition to the indexes there are other variables such as: nature of the school (private or public), number of students, teachers, teacher-directors, non-teaching employees, number of shifts, social stratum of the school neighborhood, type of school (boys, girls, mixed). Finally, variables are considered for infrastructure and resources of the school.
3.5 Estimation of the Different Hierarchical Models
3.5.1 The Empty Model (one way Anova)
The first step is to establish a model known as "empty" or variance analysis with random effects which do not have explanatory variables and have only one constant as predictor in both levels. In this model, the constant included in level 1 can be interpreted as the mean of the j-ieth unit of level 2; while the level 2 predictor constant is the grand mean of the population; this model divides the variability of the achievement (z_scoreij) in terms of level 1 variability (Ωe) and level 2 (Ω), that is to say, Var(z_scoreij)=Var(u0j + u)=Ω+Ω ; by which it is easy to see the e0ijue contribution of each level to the total variance (Table 5).
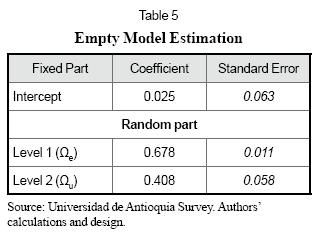
Observe that the estimator of the grand mean of the population of intercepts of the 105 schools is 0.025 with a standard error of 0.063, which according to Hox (1995)8 criteria would indicate that the zero parameter hypothesis is not rejected: This is not strange because achievement is standardized, and so it is supposed that the mean is 0. The model reveals that the level 1 variance is 0.6788 while level 2 variance is 0.408, which added together give the total variance of the dependent variable, that is to say: Most of the student achievement variability is located in level 1 (62%)9 and is connected to students´ characteristics. Now, as most of the variability is in level 1, we must first try to find variables which help us explain such variability.
3.5.2 Inclusion of Level 1 Variables
These variables are included in a standardized manner, aiming to make parameter estimations more interpretable, mainly to be able to consider the level 1 intercept as an adjusted average achievement for each school. First, it is important to clarify that the estimation procedure is the Full Maximum Likelihood, which provides an estimation of fixed parameters and the variance components with their corresponding asymptotic standard errors. This estimation method is appropriate when the sample is unbalanced (which it is in our case), because it allows us to obtain efficient estimators. Also it is important to remember that for large samples a parameter divided by its standard error has a normal distribution.
Very frequently it is convenient to use a t statistic to contrast hypothesis related to fixed parameters, as it may provide more precise results when the Level 2 sample is small but is large enough for allowing a large number of degrees of freedom t that permits its distribution converges to normal, which is what happens in this case as the Level 2 sample is more than 100; so, to see if the different variance components are zero, the asymptotic result that shows the variance divided its corresponding standard error, that distributes normal, is used. With this clarified, and as the program does not calculate p-values, the Hox (1995) criteria are used, in which a parameter is significant (the null hypothesis in which this is zero is rejected) if it is at least double the standard error (Table 6).
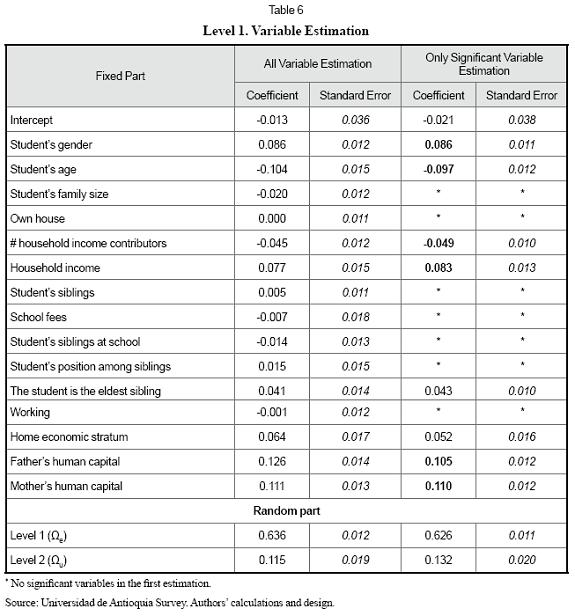
Table 6 shows that achievement is positively influenced by the mother´s and father´s human capital variables with a marginal contribution of 0.11 and 0.115 respectively; also, the higher the income and the socioeconomic stratum, the better the child´s achievement, by 0.083 and 0.052 respectively. It is also clear that boys do better than girls (0.086 higher) and that age has an inverse effect on achievement (-0.097 per year older). The eldest sibling records a positive influence of 0.043 on achievement. Finally, the more household income contributors there are, the lower the level of achievement by -0.049.
This result must be analyzed considering the great variability in the adjusted average achievement among schools (the variance component associated with the average achievement is more than double the standard error).
Also is important to study the differences in the slopes for the different schools, introducing a random variation into in these coefficients and testing one by one to see whether their variance is zero. Later, there will be an explanation of the adjusted average achievement variability and those slopes for which variations between schools were detected.
According to Hox, there is a significant variation for the gender and human capital of the mother, nevertheless, as they are closer to zero, 0.004 with a 0.002 error, and 0.008 with a 0.003 error respectively, the modeling of these variables can be discarded. The model does not converge for the slope associated with age, so, random variation for this parameter is discarded. The variables number of contributors, family income, eldest sibling, father´s human capital the zero variation hypothesis could not be rejected. Finally, for the social strata the associated slope variation is 0.014 with an error of 0.005, and an attempt to capture this variability with Level 2 variables could be tried.
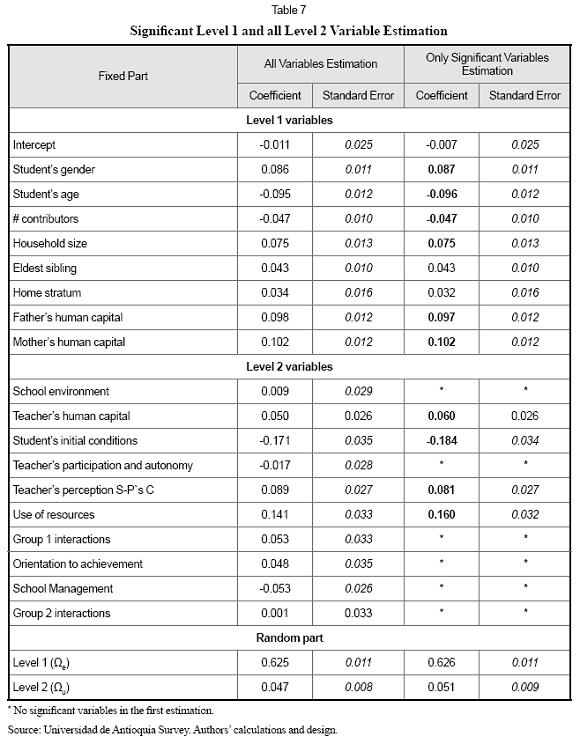
Now, observe in the two-level hierarchical model, contrary to expectations, that all the variables associated with institutionally, environment and management are not significant, so we need to exclude them from the analysis (Table 7). Instead of achievement, we add the following explanations: Where teacher human capital —years of training, experience, diplomas— is higher, average achievement marginally rises (0.060). Where teachers have a perception of deterioration of the nutritional, affective and cognitive conditions of the group of students in the school, the adjusted average achievement falls 0.184. But when high levels of commitment on the part of the parents and students are observed, the average achievement rises 0.081. Finally, where the methodological and pedagogical concepts of teaching are emphasized, the average achievement rises 0.160 (Table 7).
When a calculation is made of the reduction in the variance in average achievement due to the inclusion of level 2 variables and the reduction in the level 1variance due to the inclusion of level 1variables, the variance proportion explained in the adjusted average achievement in schools is:
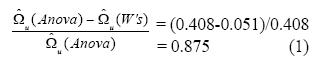
And the variance proportion explained in the level 1 is:
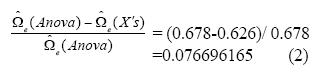
This means that level 2 explanatory variances explain 88% of the real variance in the adjusted average achievement of schools. Likewise, the level 1 explanatory variances explain only 7.6% of the true variance at student level, that is to say, there is something which explains a great deal of the variability, but could not be captured in this study. There is then the problem of capturing the individual innate skills. The work on this research has not made it possible to collect information on the innate intelligence and the cultural capacity of the individual.
In the final two-level hierarchical model we ran, the achievement is influenced positively for the father´s and mother´s human capital variables with 0.101 and 0.096 respectively (Table 8)10. This may mean that better educated parents are more conscious of the importance of a better education for their children, so they may look for better schools or implement complementary processes to schooling to provide extra stimulus for their children´s abilities; the fact the children live with more educated people leads them to a more analytical interrelation with the world, and gives them access to more efficient means of instruction11.
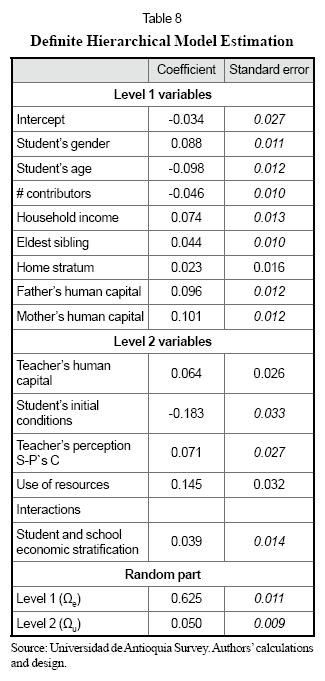
Moreover, the higher the income and the socioeconomic stratum, the higher the child´s achievement —by 0.074 and 0.023— which may be supported, among other things, by: Better nutrition levels, better schools, the possibility of complementary processes for the basic school study, the child does not have to work, etc.12. Boys do better than girls (0.088 higher) and age has an inverse influence on achievement (-0.098 for each year of age) which may mean that older students in groups may have failed a year, or experience some kind of cognitive deficiency; or they may be adults who have gone back to school to take up or complete certain studies. The eldest child enjoys a positive influence on achievement with 0.044, which may evidence the parents´ tendency to invest more in the first-born (better schools and more attention).
Finally, the higher the number of supporters in the household, the lower the level of achievement, by -0.046, which may be explained by the fact that in those large households with several people contributing to expenses there are more economic difficulties, less stability and leading family members cannot afford to pay for all that the household needs.
The adjusted average achievement of each school is explained as follows: Where the teacher´s human capital is higher, the achievement rises 0.064; where teachers have a perception of the deterioration in the student conditions, it falls 0.183; and where teachers perceive high student and parent commitment levels, it rises 0.071. It also rises 0.145 in those schools where methodological and pedagogical aspects are emphasized and regularly reviewed.
The school slopes associated with the strata variable is 0.023 plus a positive value which depends on the school stratum. For instance, if the school is stratum 4, the new slope would be:
0.023 + 0.039* (3)
The variance proportion explained for the adjusted average achievement in the school is:
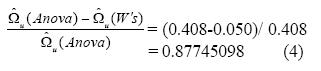
And the variance proportion explained for the included Level 1 variables is only 7.8%13.
Conclusions
Even though this class of studies in Colombia is subject to string information restrictions, the survey supporting this article provides useful information on schooling institutionality and the student´s initial conditions. We have thought that it is important in economics of education to apply information disclosure mechanisms in the survey design to get to know the institutionality and governance of schools and the high education support structures; however, constructed variables associated with management are not significant.
Instead of this, other school level variables explain a high percentage of the adjusted average achievement variability. Where the teacher´s human capital is higher, the average achievement marginally rises, where teachers have a perception of deterioration of the nutritional, affective and cognitive conditions of the group of students in the school, the average achievement falls. But where there are high levels of commitment of the parents and students, the average achievement rises. And, where the methodological and pedagogical concepts of teaching are emphasized, the average achievement also rises.
At student level, the higher the income, the socioeconomic stratum and the mother´s and father´s human capital variables, the higher the child´s achievement. It is also evident that boys do better than girls and that age has an inverse effect on achievement. The first-born enjoys a positive influence on achievement, and the more contributors, there are to household expenses, the lower the achievement.
Footnotes
1 Aimed at improving student conditions, human capital of teachers and directors and the infrastructure of public schools.
2 Iterative numeric procedures are used, usually by maximum verisimilitude to obtain efficient estimations. If the sample is "large" —and there is no established rule on what is or is not a large sample— the obtained estimations will be consistent (with a high probability of being close to the real parameter) and asymptotically efficient (non-biased and with little variance). The statistical tests are made with the superior level sample size in a hierarchical model, that is, the size of the relevant sample is the number of schools, as independence is presumed among them, but not among the students belonging to the same school.
3 33.8% of the students (2,823) studied in private schools and 5,522 (66.2%) in public schools, while the kinds of schools were 7.9% (659) boys, 12.3% (1,026) girls, and 79.8% (6,660) mixed.
4 The common nuclei score sum was used (biology, mathematics, philosophy, physics, history, chemistry, native language, geography, foreign language) and the elective test was not considered.
5 Each variable is associated with the factor in which it shows the highest loading.
6 With the varimax rotation is possible to obtain factors that are clearly marked by high loadings for some variables and low loadings for others.
7 Each variable is associated with the factor in which the variable shows the highest loading.
8 The Hox criteria do not specify the significance level, but the coefficient must at least exceed twice the standard error, and it is clear that at least the significance level is 0.05 (under the assumption of normal distribution).
9 This is one minus the inter-class correlation index.
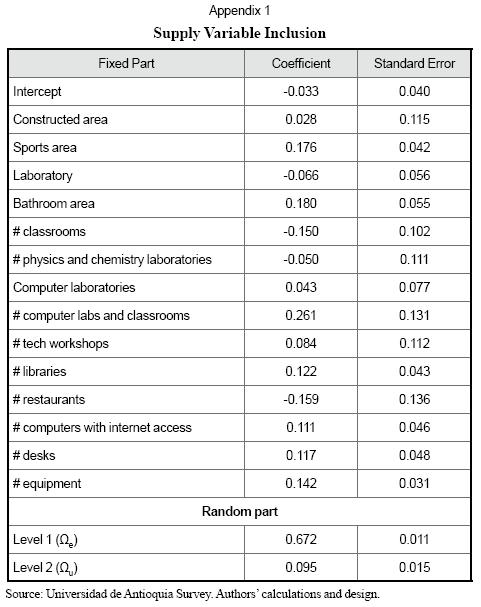
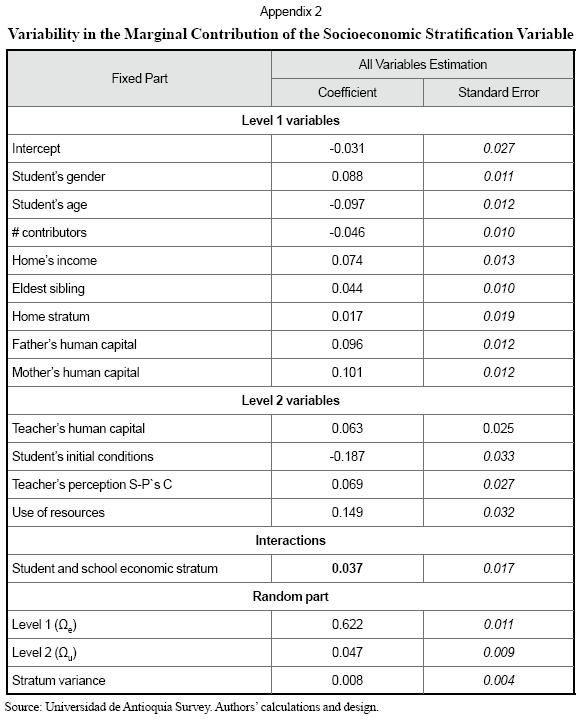
10 When inputs and infrastructure variables were included (kind of school, school stratification, number of teachers, school location, number of libraries, computer classrooms, laboratories, among others) following Hox, none of them help explain the variation in the adjusted average achievement among schools (See Appendix 1). And when including variation in the slope associated to the socioeconomic stratification, the slope for each school is 0.017 plus a positive value which depends on the school´s stratum, of 0.037 (See Appendix 2).
11 Cervini (2002), for Argentina, finds out that the two indicators related to the family cultural level, parents´ education, and books, availability of manuals and school inputs, have the greatest explanatory force and, besides, each has a specific value, with two different dimensions arising when it is to explain the level of student learning.
12 This is determinant in Colombia as there are many children from the lower economic strata who cannot study because they have to work.
13. In this final estimation we introduced interactions between Level 1 and Level 2 variables, and that is why the model is not nested in the previous models.All this implies that it is not possible to compare deviations between the last model and the others. However, the suggestion is to choose the most parsimonious model.
References
1. Alesina, A. (2001). Reformas institucionales en Colombia. Bogotá: Fedesarrollo y Alfaomega. [ Links ]
2. Alviar, M. y Restrepo, P. (2004). El logro académico y el efecto colegio en las pruebas ICFES en Antioquia. Lecturas de Economía, 60, 68-95. [ Links ]
3. Bishop, J. H. and Woessmann, L. (2002). Institutional effects in a simple model of educational production. IZA, Discussion paper, 484, 1-38. [ Links ]
4. Browne, W. J. and Rasbash, J. (2004). Multilevel modelling. En M. Hardy and A. Bryman (Eds.), Handbook of data analysis (pp. 459-480). London: Sage. [ Links ]
5. Bryk, A. and Raudenbush, S. (1992). Hierarchical linear models: Applications and data analysis methods. New York: Sage. [ Links ]
6. Castaño, E., Tobón, D., Vásquez, J., y Piñeros, L. (2005). Laboratorio de calidad de la educación en Medellin. Manuscrito no publicado, 146 p. [ Links ]
7. Cervini, R. (2002). Desigualdades en el logro académico y reproducción cultural en Argentina: un modelo de tres niveles. Revista Mexicana de Investigación Educativa, 7, (16), 445-500. [ Links ]
8. Nivel y variación de la equidad en la educación media de argentina. (2004).Revista Iberoamericana de Educación, 34 (4). Recuperado el 1 de mayo de 2005, de http://www.rieoei.org/deloslectores/844Cervini.PDF. [ Links ]
9. Clarke, E. H. (1971). Multipart pricing of public goods. Public Choice, 11, 17-33. [ Links ]
10. Coleman, J. S., Campbell, E. Q., Hobson, C. J., Mcpartland, J., Mood, A. M., Weinfeld, F. D., and York, R. L. (1966). Equality of educational opportunity. Washington: U. S. Government Printing Office. [ Links ]
11. Correa, J. J. (2004). Determinantes del rendimiento educativo de los estudiantes de secundaria en Cali: un análisis multinivel. Sociedad y Economía, 6, 81-105. [ Links ]
12. De Graaf, P. (1986). The impact of financial and cultural resources on educational attainment in the Netherlands. Sociology of Education, 59 (4), 237-246. [ Links ]
13. Díaz, L. G. (2000). Análisis estadístico de datos categóricos aplicado a la investigación biomédica. Bogotá: Universidad Nacional de Colombia. [ Links ]
14. Ferrera, J. M., Pedraja, F., y Salinas, J. (2005). Eficiencia en educación secundaria e inputs no controlables: sensibilidad de los resultados ante modelos alternativos. Hacienda Pública Española, 173 (2), 1-39. [ Links ]
15. Fuller, B. and Clarke, P. (1994). Raising school effects while ignoring culture?: Local conditions and the influence of classroom tools, rules and pedagogy. Review of Educational Research, 64 (1), 119-157. [ Links ]
16. Gamboa, L. F., Casas, A. F., y Piñeros, L. J. (2003). La teoría del valor agregado: una aproximación a la calidad de la educación en Colombia. Revista de Economía del Rosario, 6 (2), 96-117. [ Links ]
17. Garner, C. and Raudenbush, S. (1991). Neighborhood effects on educational attainment: A multilevel analysis. Sociology of Education, 64 (4), 380-397. [ Links ]
18. Gaviria, A. y Barrientos, J. (2001). Determinantes de la calidad de la educación en Colombia. Archivos de Economía, 159. [ Links ]
19. Glewwe P. and Jacoby H. (1994). Student achievement and schooling choice in low-income countries: Evidence from Ghana. Journal of Human Resources, 29 (3), 187-196. [ Links ]
20. Grogger, J. (1997). Local violence and educational attainment. Journal of Human Resources, 32 (4), 659-682. [ Links ]
21. Groves, T. and Martin, L. (1975). Incentives and public inputs. Journal of Public Economics,4 (3), 211-226. [ Links ]
22. Hambor, J. C., Phillips, L., and Votey, H. R. Jr. (1973). Optimal community educational attainment: A simultaneous equation approach. Review of Economics and Statistics, 55 (1), 98-103. [ Links ]
23. Hanushek, E. and Woessmann, L. (2007). The role of education quality for economic growth. Washington: The World Bank. [ Links ]
24. Heneveld, W. and Craig, H. (1996). Schools count: World Bank project designs and the quality of primary education in Sub-Saharan Africa. Washington: The World Bank. [ Links ]
25. Hox, J. J. (1995). Applied multilevel analysis. Amsterdam: TT-Publikaties. [ Links ]
26. Llach, J. J., Montoya, S., y Roldán, F. (1999). Educación para todos. Buenos Aires: IERAL. [ Links ]
27. McMeekin, R. (2001). A theoretical and empirical study of institutions inside school organitations. Paper prepared for the Vth Annual Conference of the International Society for New Institutional Economics, Santiago, Chile. Recuperado el 15 de febrero de 2006, de http://www.isnie.org/ ISNIE01/Papers01/mcmeekin.pdf. [ Links ]
28. Mizala, A. y Romaguera, P. (2002). Regulación, incentivos y remuneraciones de los profesores en Chile. Santiago: Ingeniería Industrial, Universidad de Chile. Recuperado el 10 de marzo de 2006, de http://www.webmanager.cl/prontus_cea/cea_2000/site/pags/20030328120541.html. [ Links ]
29. Mizala, A., Romaguera, P., and Ostioc, C. (2004). Equity and achievement in the Chilean school choice system: A multilevel analysis. Santiago: Center for Applied Economics Department of Industrial Engineering, Universidad de Chile. [ Links ]
30. Mizala, A., Romaguera, P., y Reinaga, T. (2004). Factores que inciden en el rendimiento escolar en Bolivia. La Paz: Ministerio de Educación. [ Links ]
31. Núñez, J., Steiner, R., Cadena, X., y Pardo, R. (2002). ¿Cuáles colegios ofrecen mejor educación en Colombia? Archivos de Economía, 193, 1-56. [ Links ]
32. Pérez, C. (2004). Técnicas de análisis multivariante de datos: aplicaciones con SPSS. Madrid: Pearson Educación. [ Links ]
33. Piñeros, L. (2002). Dimensiones del mejoramiento escolar, la escuela alza vuelo. Bogotá: Nomos. [ Links ]
34. Raymond, R. (1968). Determinants of the quality of primary and secondary public education in West Virginia. Journal of Human Resources,3 (4), 450-470. [ Links ]
35. Restrepo, P. y Alviar, M. (2004). El logro académico y el efecto colegio en las pruebas ICFES en Antioquia. Lecturas de Economía, 60, 67-95. [ Links ]
36. Ridell, A. R. (1997). Reforms of the governance of education: Centralization and decentralization. En W. K. Cummings and N. F. McGinn (Eds.), International handbook of education and development: Preparing schools, students and nations for the twenty-first century. London: Springer. [ Links ]
37. Sander, W. (1999). Private schools and public school achievement. Journal of Human Resources, 34 (1), 697-709. [ Links ]
38. Scheerens, J. (2000). School effectiveness in developed and developing countries: a review of the research evidence. Washington: The World Bank. Recuperado el 4 de abril de 2006, de http://www.worldbank.org/education/schools. [ Links ]
39. Sin-Kwok Wong, R. (1998). Multidimensional influences of family environment in education: the case of socialist Czechoslovakia. Sociology of Education, 71 (1), 1-22. [ Links ]
40. Tobón, D., Pérez, G., Valencia, G., García, D., Vanegas, P., y Castillo, G. (2004). Institucionalidad e incentivos en la educación básica y media en Colombia. Medellin: Universidad de Antioquia. [ Links ]
41. Vegas, E. (2002). School choice, student performance, and teacher and student characteristics: The Chilean case. Washington: The World Bank. [ Links ]
42. Vélez, E., Schielfelbein, E., and Valenzuela, J. (1993). Factors affecting achievement in primary education: A review of the literature for Latin America. Washington: The World Bank. [ Links ]
43. Visauta, B. (2005). Análisis estadístico con SPSS para Windows VII. Madrid: McGraw Hill. [ Links ]
44. Wiesner, E. (1997). La efectividad de las políticas públicas en Colombia. Bogotá: Tercer Mundo-Departamento Nacional de Planeación [ Links ]

